
. Introduction
Beach ridges that form during seaward migration of a shoreline indicate the successive positions of past shorelines; their age and distribution can therefore provide a geological record of past coastal changes (Tamura, 2012). Because beach-ridge deposits generally lack material suitable for radiocarbon dating (e.g., Isla and Bujalesky, 2000), luminescence dating of sand grains has been used as an alternative method for dating them (e.g., Murray-Wallace et al, 2002; Nielsen et al, 2006; Reimann et al,2011a; Tamura et al, 2012; Brill et al, 2015).
The Yumigahama Peninsula is a sandy coastal barrier with a well-developed sequence of beach ridges (Sadakata, 1991). An immense increase in sediment discharge from the catchment of the neighboring Hino River in response to 17th and 18th century mining of iron for the manufacture of swords (Sadakata, 1985; Tokuyasu, 1999) enhanced sediment deposition that caused rapid seaward migration of the shoreline and the development of a sequence of ridges. Absolute dating of the ridge sediments will help to quantify the effect of human activity on the geomorphology of this region.
Although optically stimulated luminescence (OSL) of quartz grains has generally been the first choice for dating Holocene coastal deposits, problems related to the OSL properties of quartz have been reported from many regions of Japan (e.g., Tsukamoto et al, 2003; Watanuki et al, 2005; Tokuyasu et al., 2010; Tamura et al., 2011, 2015). The use of post-infrared (post-IR) infrared stimulated luminescence (IRSL) of K-feldspar at relatively low temperatures (Thomsen et al, 2008; Reimann et al, 2011b) has reduced the undesirable effects of both anomalous fading and residual dose and has provided a robust method of dating Holocene sediments (e.g., Reimann and Tsukamoto, 2012; Preusser et al., 2014). However, there have been few attempts to assess the use of post-IR IRSL for dating Holocene sediments in Japan. In this paper, we confirm that quartz OSL dating is unsuitable for application to sediments from the ridge sequence of the Yumigahama Peninsula and assess the application there of K-feldspar IRSL and post-IR IRSL dating.
. Study area and sampling
The Yumigahama Peninsula is on the Japan Sea coast of western Japan (Fig. 1). It is a sandy coastal barrier that is 20 km long and 2.8–4.3 km wide, separating the Japan Sea from the brackish lagoon of Nakaumi Bay (Figs. 1B and 1C). The Sakai Strait, between the northwestern end of the barrier and the Shimane Peninsula, connects Nakaumi Bay to the Japan Sea. The sandy beach along the barrier is embayed; it is oriented NNW–SSE at its northwestern end and WNW-ESE at its southeastern end. The Hino River flows into the Japan Sea at the southeastern end of the barrier, and most of the sand discharged at the river mouth is transported northwest along the shore by dominantly northeasterly waves (Sato et al, 1998). The rocks of the Hino River catchment are mainly Cretaceous and Tertiary granite and Quaternary volcanic rocks.
Fig. 1
(A) Regional map showing location of the Yumigahama Peninsula. (B) Simplified geological map of the Hino River catchment (after Inoue et al., 2004). (C) Landform classification map of the Yumigahama Peninsula showing boundaries (dotted red lines) between the Uchihama, Nakahama, and Sotohama ranges (after Sadakata, 1991). Distinction between granitic and volcanic sands is based on mineral analyses by Sadakata (1991). The 1926 shoreline is after Inoue et al. (2004)
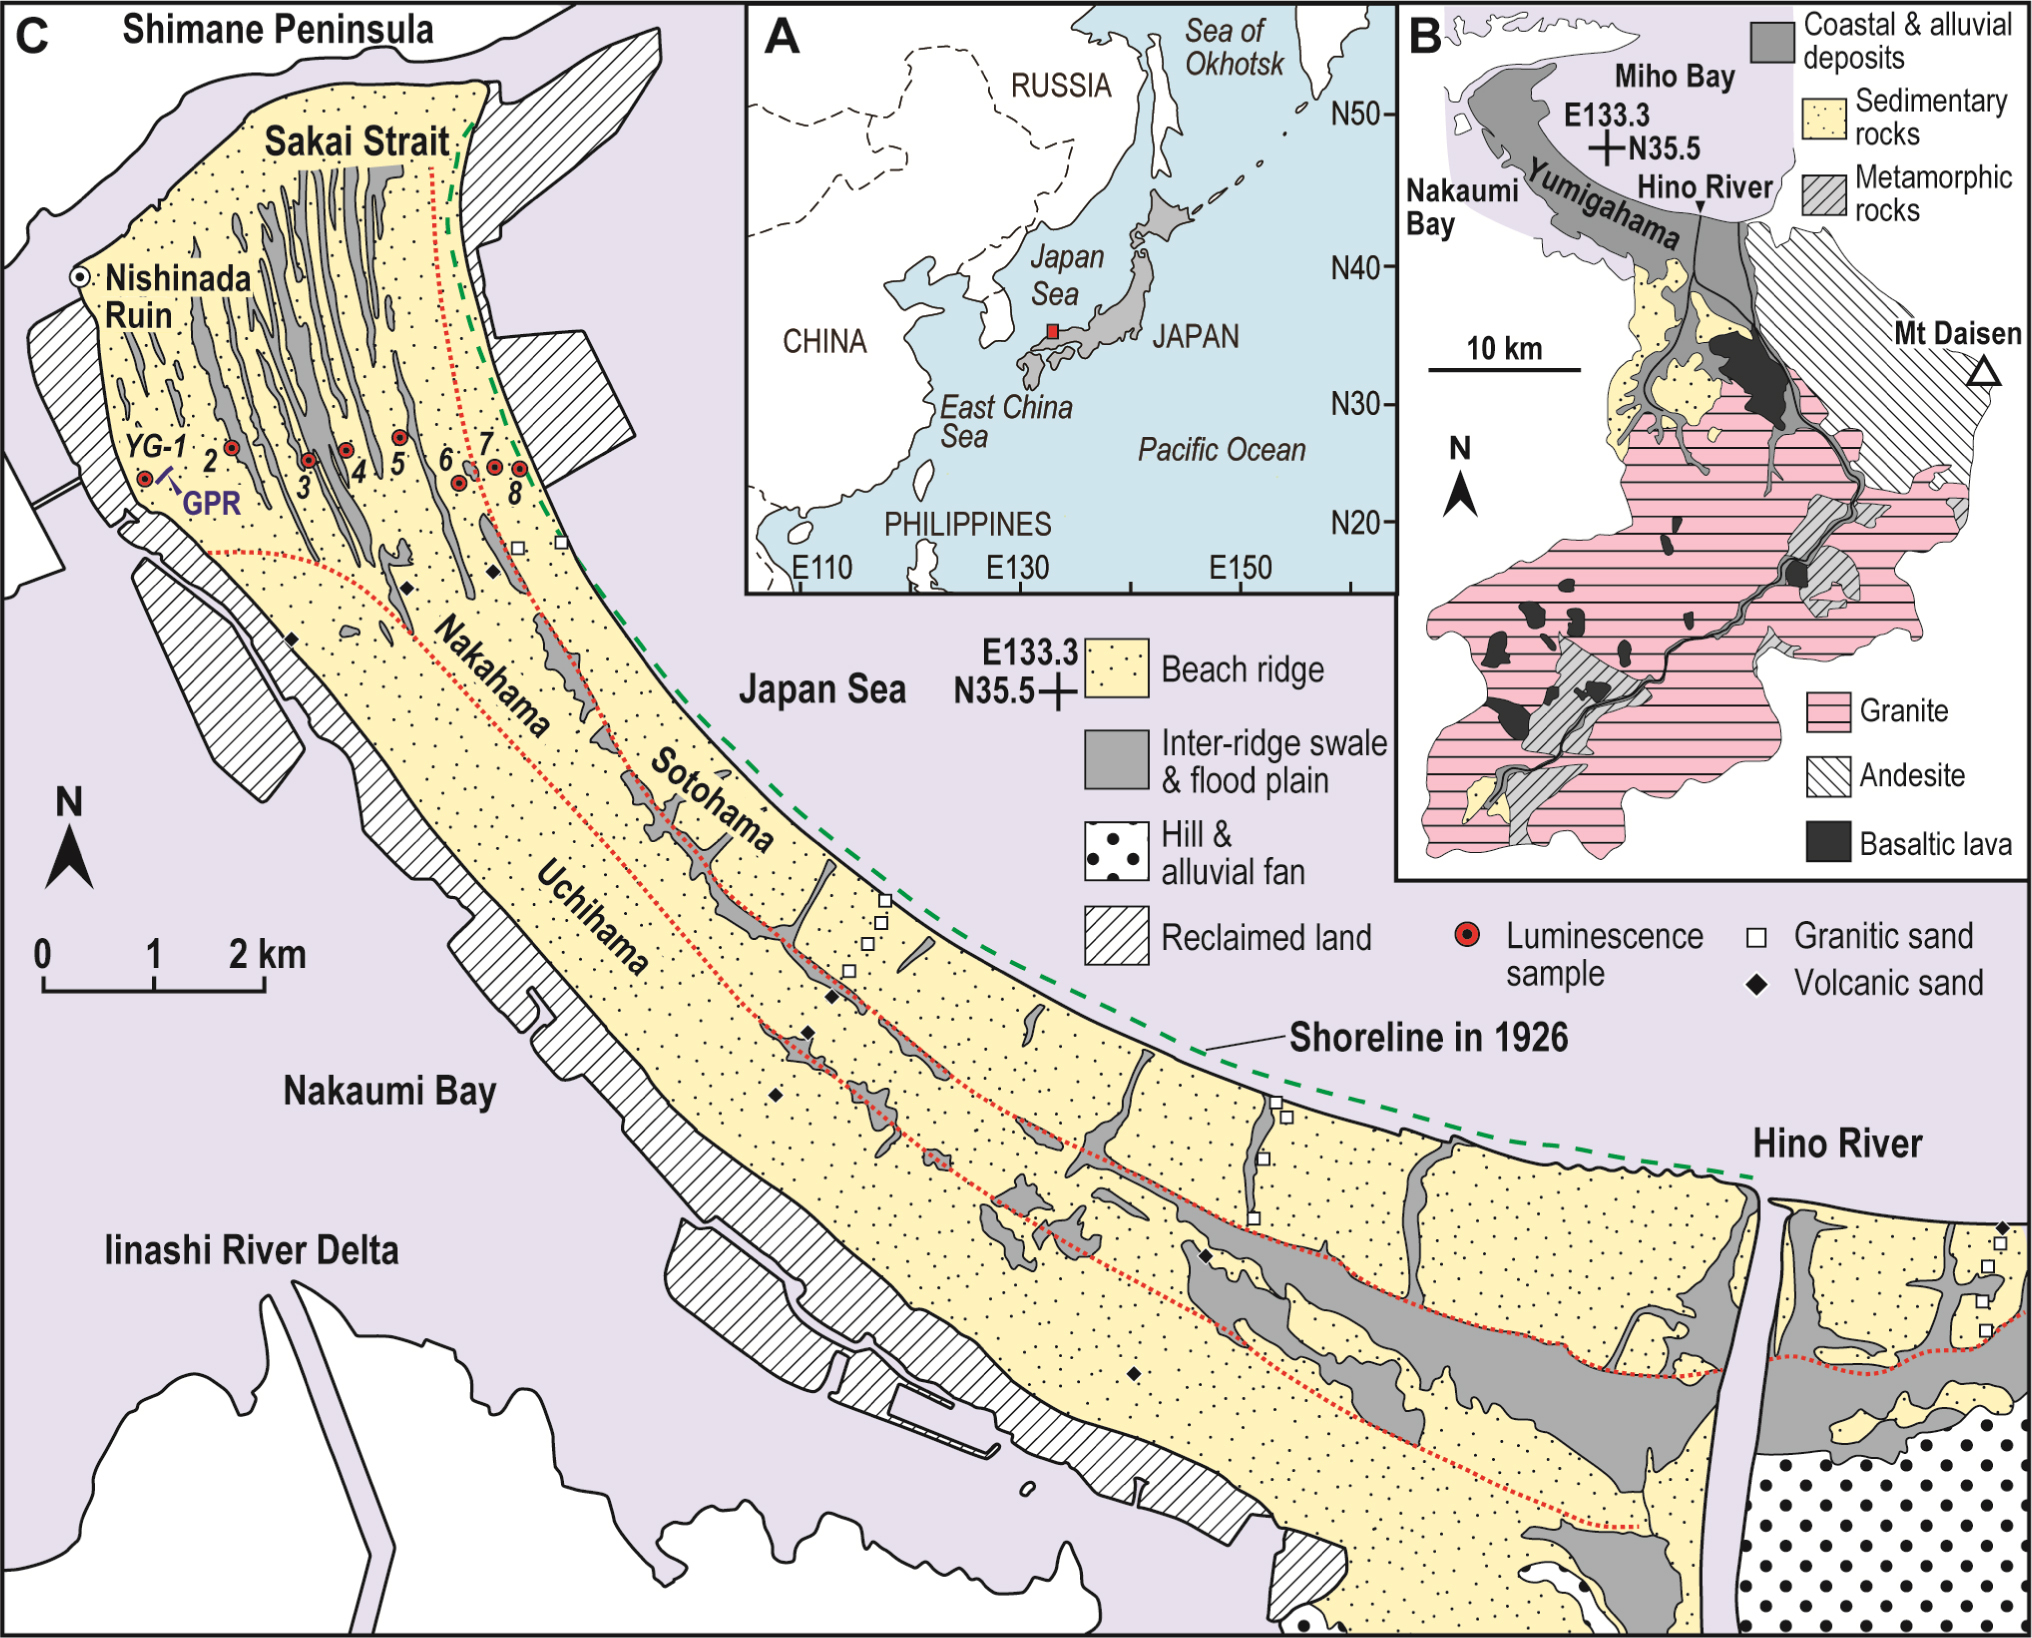
The Yumigahama coastal barrier (Yumigahama barrier hereafter) and coastal plain east of the Hino River form a continuous beach ridge plain that reaches 7 m elevation above mean sea level (Fig. 1C) in areas where several meters of aeolian sand overlies the beach deposits. Sadakata (1991) divided the ridge sequence into three roughly parallel ranges from the lagoonal coast to the ocean; these were named the Uchihama, Nakahama, and Sotohama ranges.
The Uchihama Range is the innermost of the three ranges and extends from the southeastern end of the barrier to about 2 km from the Sakai Strait. It is dominated by ridges with only minor inter-ridge swales. The Nakahama Range has pronounced ridges and inter-ridge swales and is widest near the Sakai Strait, where it extends from the lagoon almost to the ocean. The Sotohama Range does not have pronounced inter-ridge swales, is widest near the Hino River, narrows to the northwest, and is dissected by several creeks that flow perpendicular to the coast into the Japan Sea.
Before collecting our samples for luminescence dating, we carried out a ground-penetrating radar (GPR) survey along a shore-normal transect across the entire barrier, and confirmed that the ridge deposits show two radar facies: lower beach deposits and upper aeolian dune deposits (Fig. 2). The top of the beach deposit facies is generally deeper than 1–2 m. It is characterized by reflectors that dip consistently seaward, which is characteristic of prograded beach facies elsewhere (Tamura et al, 2008; Tamura, 2012). The upper facies shows horizontal to gently seaward dipping reflectors, which we interpreted to represent aeolian dune sands deposited on the beach.
Fig. 2
Example of the GPR data we acquired (transect location in Fig. 1C). The GPR survey was undertaken using a PulseEkko PRO GPR system (Sensors & Software Inc., Ontario, Canada) with bistatic, shielded 250-MHz antennae. Pulsed radar waves were automatically generated at a step size of 0.05 m, and their reflections were recorded. The GPR data were processed with Reflexw software (Sandmeier Scientific Software, Karlsruhe, Germany). Data processing included dewow filtering, zero-time correction, time-depth conversion, and static correction. The radar wave velocity was calculated by the common midpoint method at several points along transect. T.P. (Tokyo Peil) is the standard datum for elevation measurements in Japan. T.P. = 0 is mean sea level in Tokyo Bay.
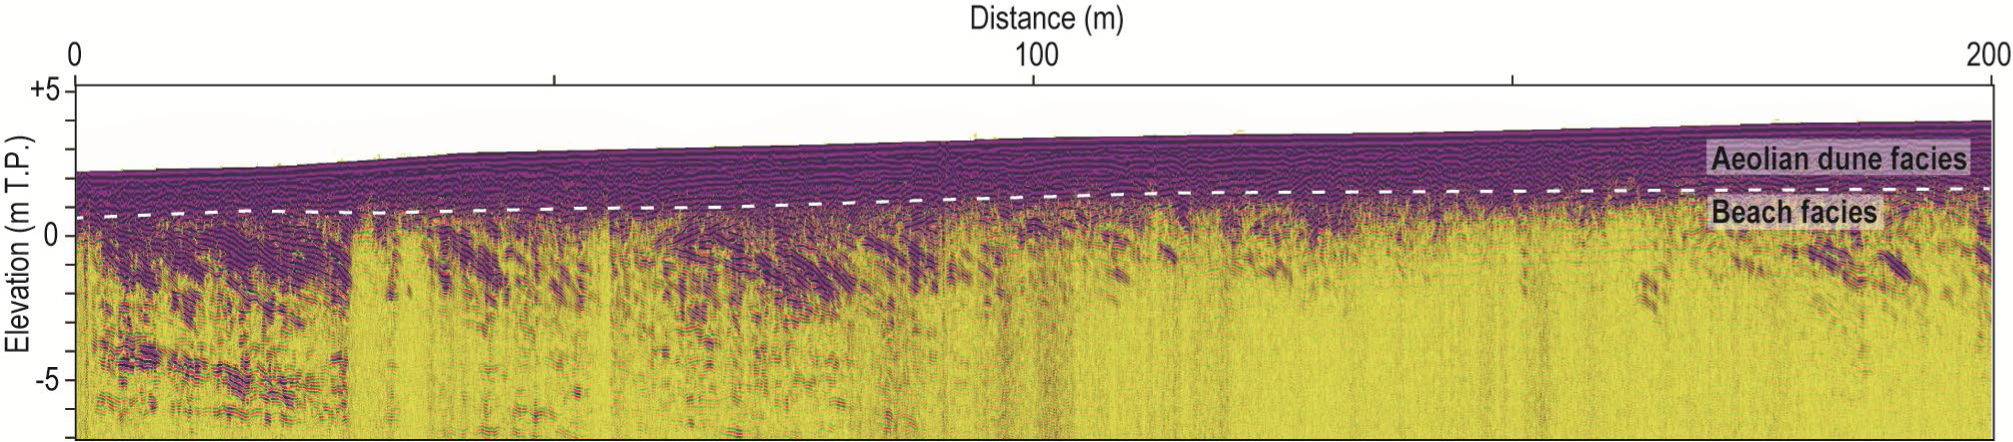
We collected samples for luminescence dating at eight sites in 2014 and 2015. The samples were taken from the bottom of auger holes of at least 90 cm depth so that surface disturbances were avoided. A light-tight stainless-steel tube (30 cm long, 6.5 cm inside diameter) was hammered into the bottom of each borehole to extract samples of sand that had not been exposed to light. Eight samples were collected (sites YG-1 to YG-8; Fig. 1 and Table 1) along a shore-normal transect across the north-western part of the Yumigahama barrier, where beach ridges and inter-ridge swales are clearly defined. Sites YG-1 to YG-6 were in the Nakahama Range and sites YG-7 and YG-8 were in the Sotohama Range. Comparison of sample depths with the GPR profile confirmed that our samples were taken from either the uppermost part of the beach facies or the base of the aeolian dune facies. Thus, the depositional age of the samples should young seaward (from YG-1 to YG-8).
Table 1
Details of sample sites, radionuclide and water contents of samples, and estimated dose rates.
| Sample | Distance from shoreline (km) | Surface elevation (m T.P.*) | Depth (m) | Water content (%) | K (%) | Rb (ppm) | Th (ppm) | U (ppm) | Dose rate (Gy/ka) |
|---|---|---|---|---|---|---|---|---|---|
| YG-1 | 3.25 | +2.97 | 1.80–1.95 | 28 | 1.3 | 50 | 6.0 | 1.1 | 2.45 ± 0.14 |
| YG-2 | 2.35 | +3.51 | 1.35–1.50 | 31 | 1.7 | 67 | 4.6 | 1.0 | 2.57 ± 0.15 |
| YG-3 | 1.79 | +2.75 | 0.90–1.05 | 32 | 1.4 | 54 | 4.0 | 1.1 | 2.37 ± 0.14 |
| YG-4 | 1.44 | +2.80 | 0.95–1.10 | 28 | 1.8 | 69 | 4.3 | 1.2 | 2.69 ± 0.15 |
| YG-5 | 0.94 | +4.14 | 1.40–1.55 | 32 | 1.6 | 55 | 4.1 | 1.0 | 2.46 ± 0.14 |
| YG-6 | 0.58 | +3.34 | 1.70–1.85 | 26 | 1.9 | 77 | 4.0 | 1.0 | 2.75 ± 0.15 |
| YG-7 | 0.25 | +2.62 | 1.15–1.30 | 6 | 3.3 | 149 | 3.2 | 1.0 | 4.39 ± 0.23 |
| YG-8 | 0.03 | +2.89 | 1.65–1.95 | 5 | 3.5 | 163 | 3.8 | 0.9 | 4.66 ± 0.25 |
. Methods
Sample preparation and luminescence measurement were done at the luminescence laboratory of the Geological Survey of Japan. Samples were prepared under subdued red light to avoid affecting the luminescence signals. Sediment within 20–25 mm of the ends of the tube was removed and used for measurements of moisture content and dosimetry. The remaining sample was dried, sieved to extract grains of 180–250 μm diameter, and then treated with HCl and H2O2 to remove carbonate and organic matter. Quartz and feldspar grains were then separated using sodium polytungstate liquids of densities 2.70, 2.58, and 2.53 g/cm3. The 2.53–2.58 g/cm3 fraction was taken to be K-feldspar. Quartz samples were extracted by etching the 2.58–2.70 g/cm3 fraction in 40% HF for one hour, followed by HCl treatment. Monolayers of dried quartz and feldspar grains were mounted on 9.8 mm diameter stainless steel disks.
Luminescence measurements were done with a TL-DA-20 automated Risø TL/OSL reader equipped with blue and infrared LEDs centered on wavelengths of 470 and 870 nm, respectively, for stimulation, and a 90Sr/90Y beta source for laboratory irradiation. For stimulation by blue and infrared LEDs, emitted luminescence through a Hoya U-340 filter, and a combination of Schott BG3 (3 mm thick), BG39 (2 mm), and GG400 (3 mm) filters, respectively, was measured with a photomultiplier tube.
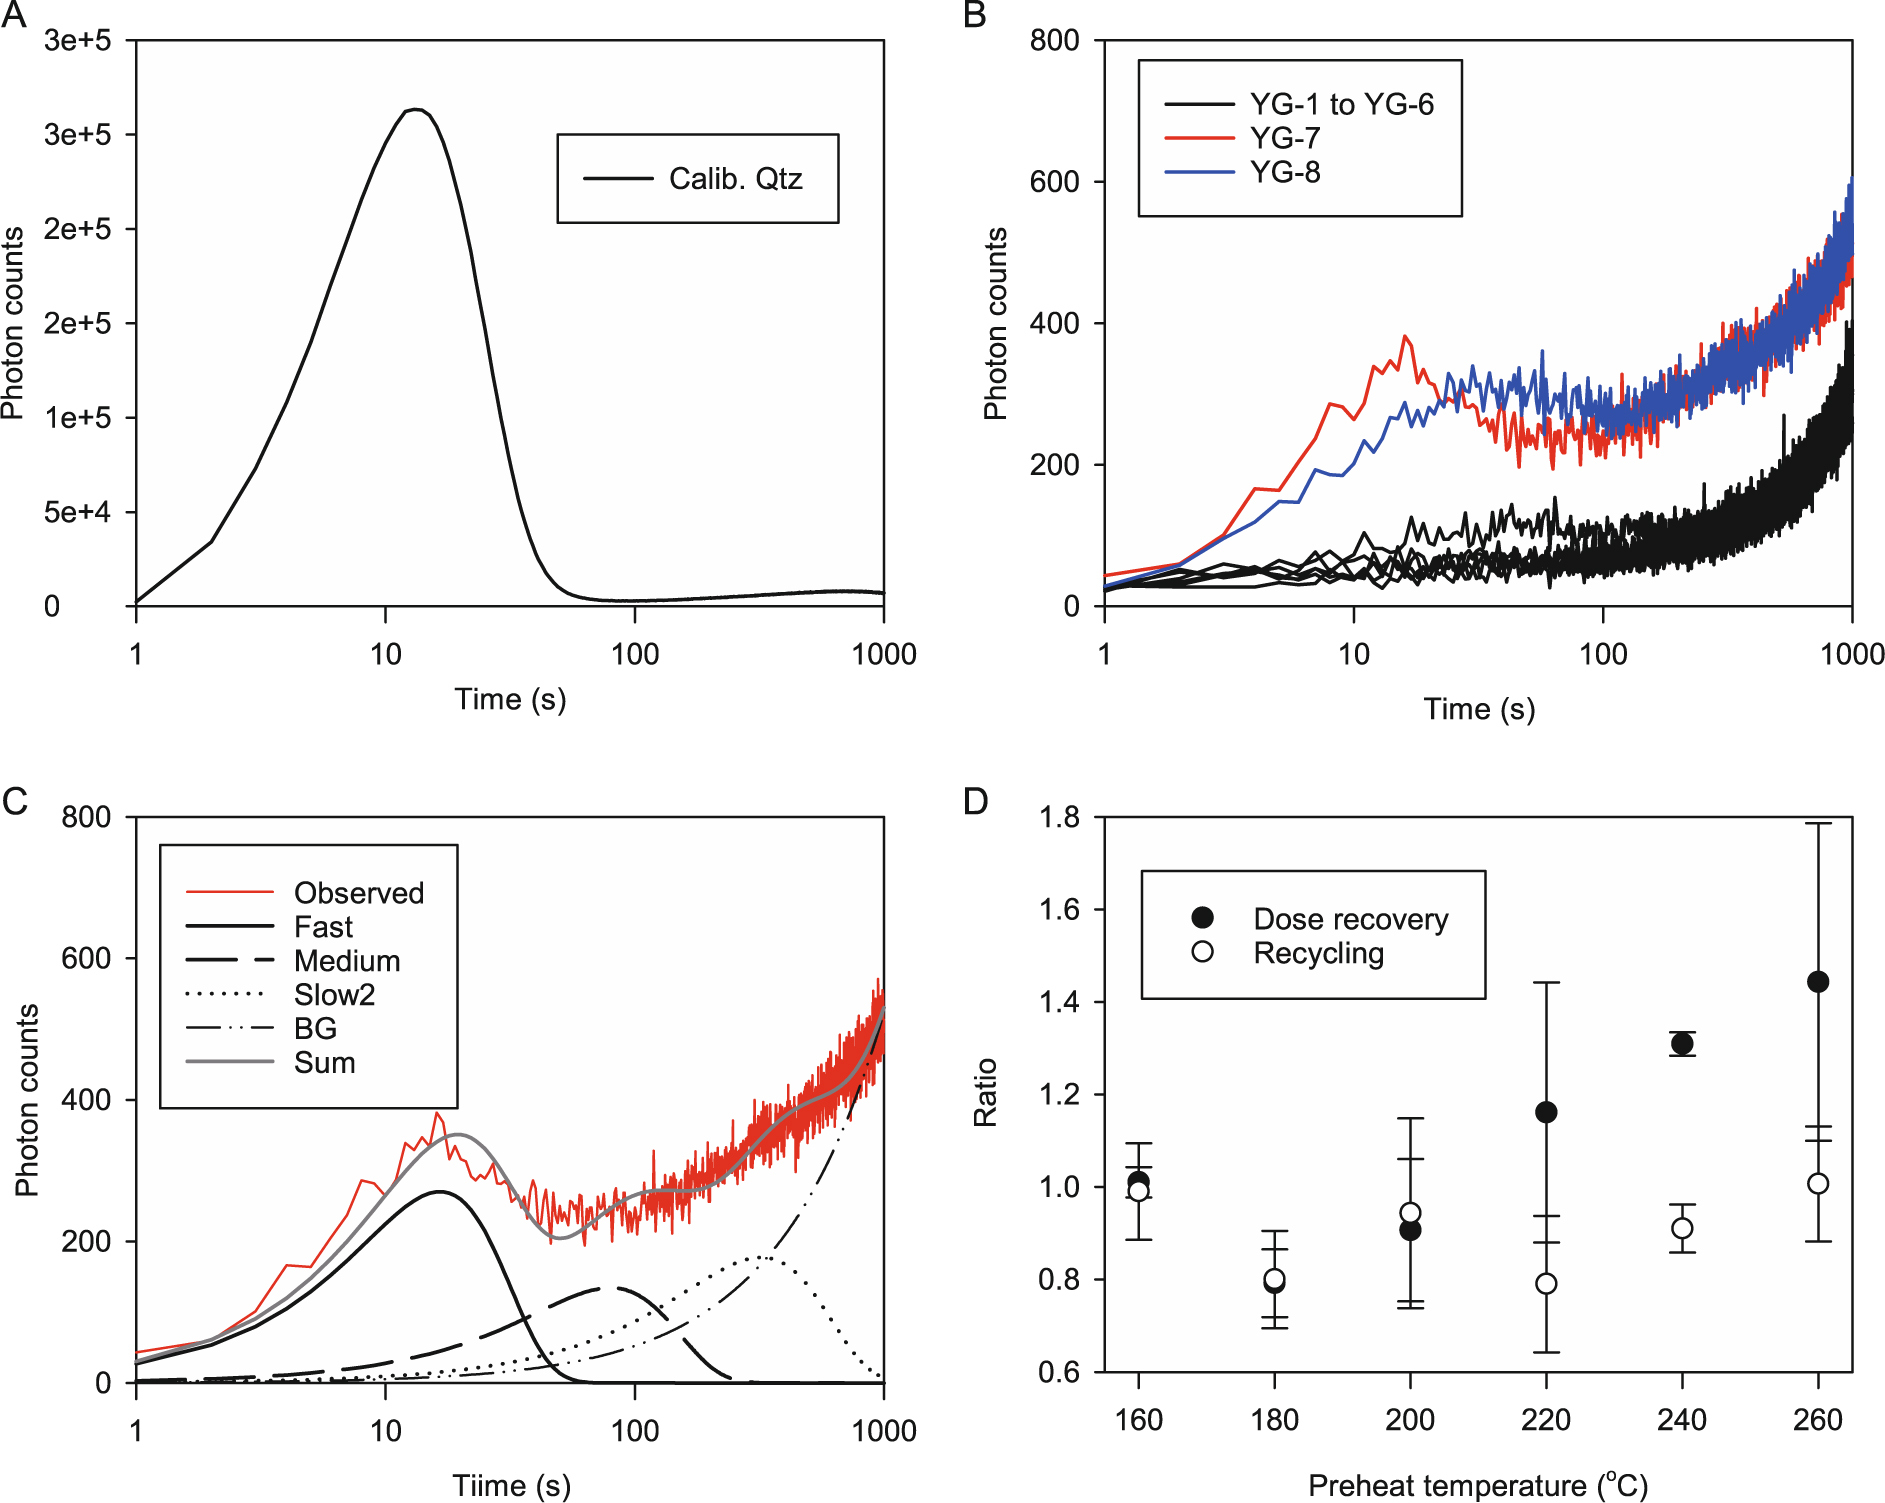
The linear-modulated (LM) OSL of our quartz samples and the calibration quartz provided by Risø-DTU (batch 10) were measured by linearly increasing the power of the blue LEDs from 0 to 72 mWcm-2 (Figs. 3A-C). Aliquots were irradiated with 20 Gy and preheated at 260°C for 10 s before LM-OSL measurements were made for 1000 s at 125°C. The resultant LM-OSL curve was fitted according to the equation by Bulur (1996) to separate the various components. The single-aliquot regenerative-dose (SAR) protocol was used to determine the equivalent dose (De) from the continuous wave (CW) OSL (Murray and Wintle, 2000). CW-OSL measurements were made at 125°C with a stimulation time of 20 s. The luminescence intensity was determined by integrating the first 0.5 s after subtracting the average intensity during the last 5.0 s. A preheat dose recovery test was performed on the quartz sample from location YG-7 by increasing the preheat temperature from 160 to 260°C in 20°C increments (Fig. 3D).
Fig. 3
LM-OSL curves of (A) calibration quartz and (B) quartz samples YG-1 to YG-8. (C) Fitting of LM-OSL curve of quartz sample YG-7. (D) Results of the preheat dose recovery test for quartz sample YG-7.
For K-feldspar samples, modified single-aliquot regenerative (SAR) protocols for IRSL and post-IR IRSL were applied to determine De (Figs. 4A–B, Table 2). The luminescence signal was sampled every 0.1 s for 100 s and the intensity was derived from the integral of the first 2.0 s of signal after subtracting the average intensity during the last 20 s of signal. A preheat dose recovery test was performed on the K-feldspar sample from location YG-1 by increasing the preheat temperature from 160 to 260°C in 20°C increments (Fig. 4C). On the basis of the test results, preheat and cutheat temperatures of 180°C were chosen. IRSL and post-IR IRSL measurements were made at 50°C and 150°C, respectively.
Fig. 4
Luminescence decay cuives and dose-response curves (insets) for K-feldspar samples (A) YG-1 and (B) YG-7 based on SAR protocols summarized in Table 2. (C) Results of preheat dose recovery test for IRSL of K-feldspar sample YG-1. pIRIR means post-IR IRSL.
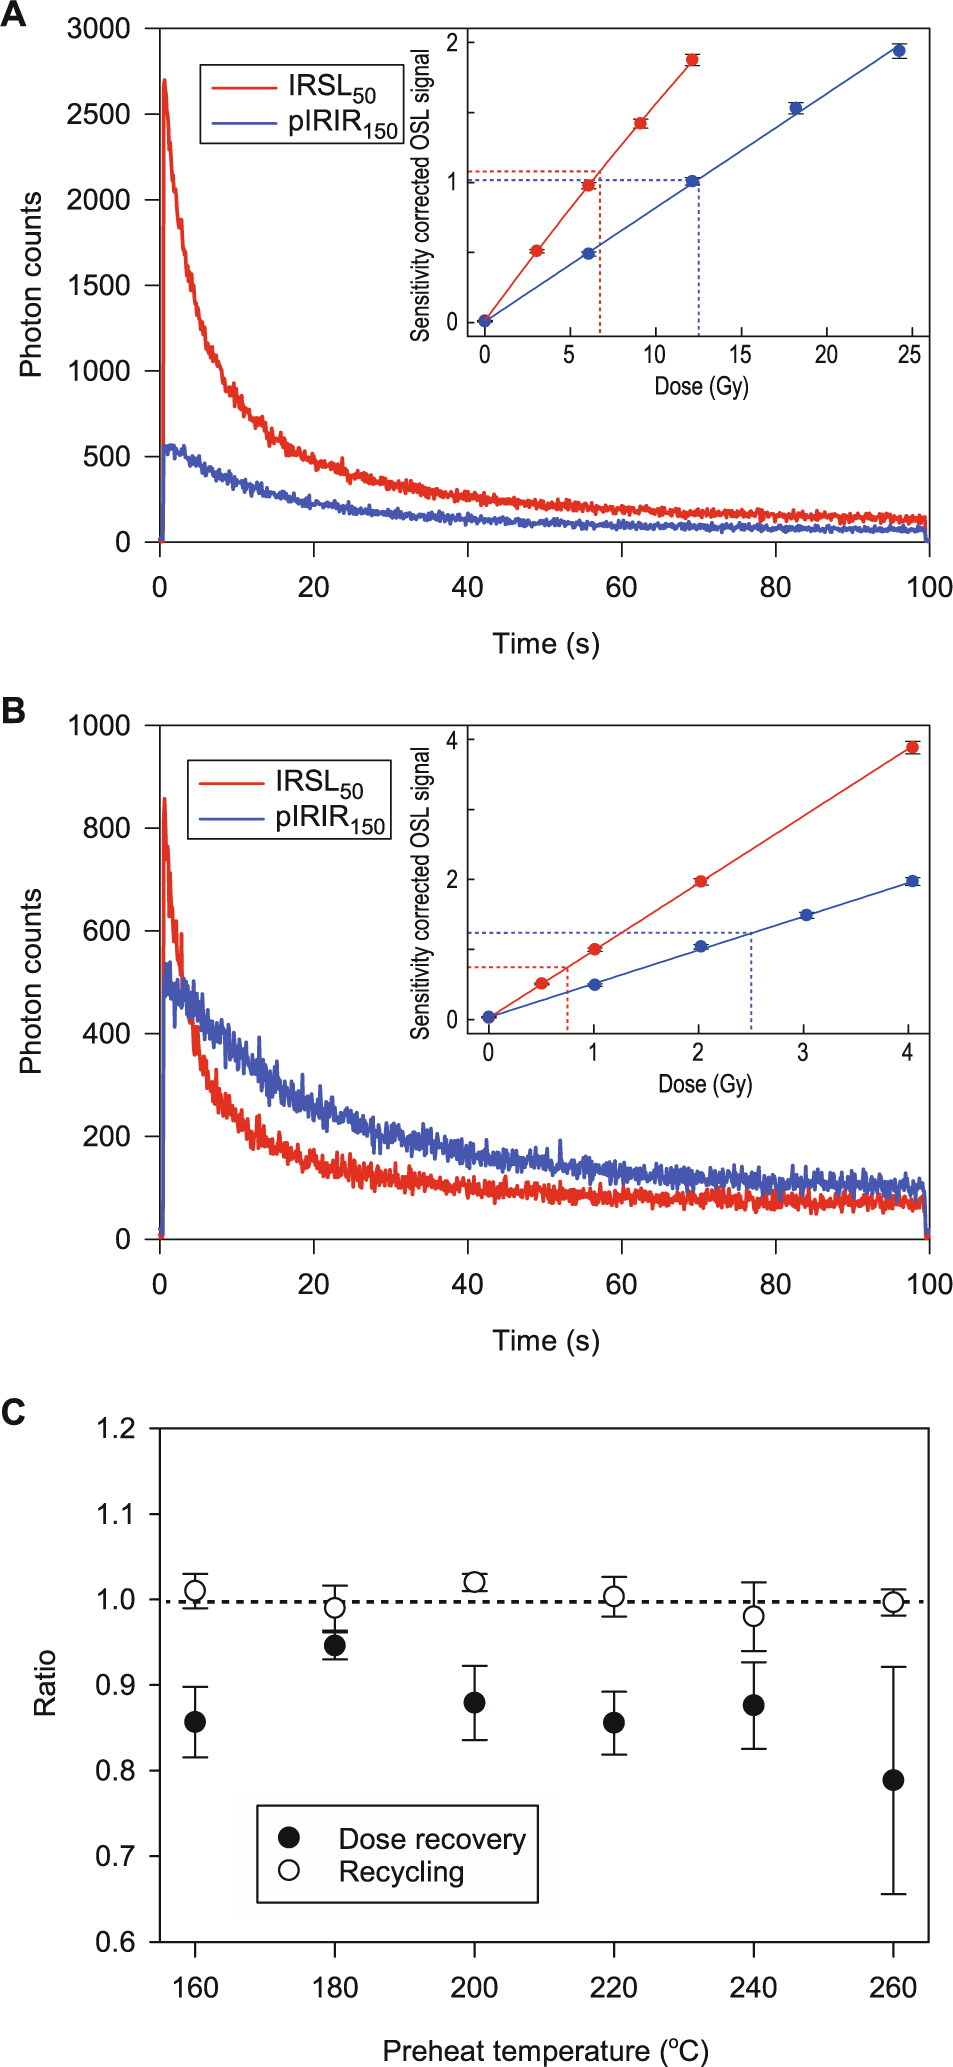
Table 2
Summaries of IRSL and post-IR IRSL SAR protocols used in this study.
Bleaching experiments and dose recovery tests were performed for all K-feldspar samples. Six aliquots per sample were exposed to artificial sunlight for 4 h in a UVACUBE 400 chamber (Hönle) with a SOL 500 lamp module. After bleaching, three aliquots were dosed and then used for a dose recovery test; the remaining aliquots were used to estimate the residual dose. Dose recovery was assessed after subtracting the residual dose from the recovered dose, and showed a value within ±10% of the given dose in all cases (Table 3). Fading tests were also carried out on the aliquots used for determining De by following the method of Auclair et al. (2003) (Fig. 5). We measured Lx/Tx, sensitivity corrected luminescence intensity, with delay times of 0.1–55 h following preheat. Aliquots were stored in the sample chamber of the Risø reader during the delay time. Fading rates evaluated for tc = 2 days (g2days value; g-values hereafter) were then calculated according to Huntley and Lamothe (2001).
Fig. 5
Fading test for K-feldspar samples (A) YG-1, (B) YG-4, (C) YG-6, and (D) YG-7. pIRIR means post-IR IRSL
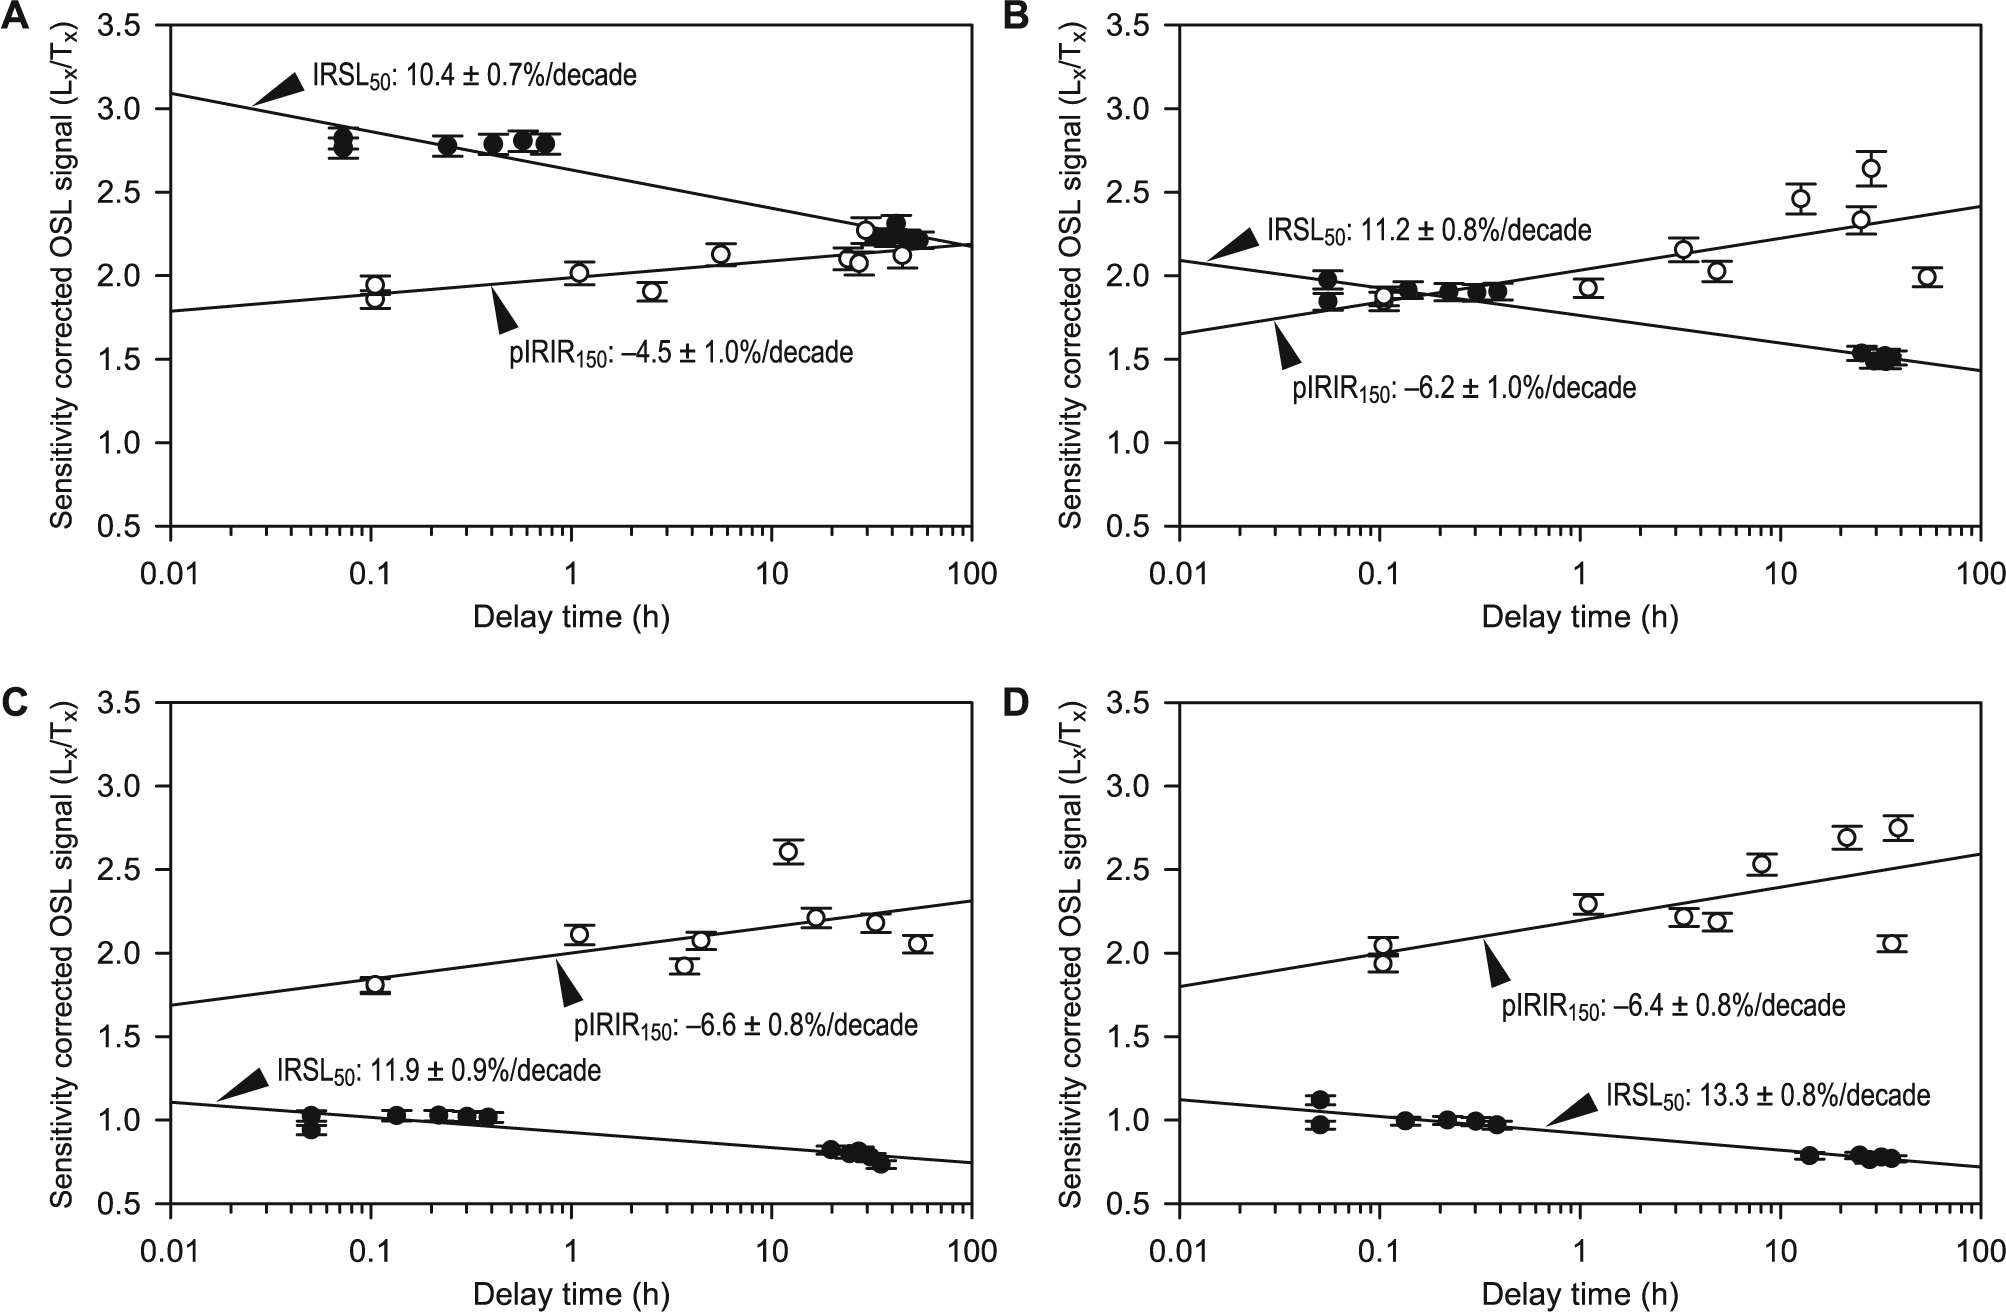
Table 3
Dose recovery ratio, equivalent dose (De), g-value, and luminescence age estimates for IRSL and post-IR IRSL (pIRIR) signals for all samples.
The environmental dose rate was determined using the DRAC of Durcan et al. (2015) based on the contributions of both natural radioisotopes and cosmic radiation. Concentrations of potassium, uranium, thorium, and rubidium were measured by inductively coupled plasma mass spectrometry and were converted to dose rate according to the conversion factors of Adamiec and Aitken (1998) (Table 1). The attenuation factors we used for beta and alpha rays were based on Mejdahl (1979) and Bell (1980), respectively. We used an a-value of 0.15 ± 0.05 (Balescu and Lamothe, 1994). The internal potassium content of K-feldspar was assumed to be 12.5 ± 0.5% (Huntley and Baril, 1997). Past changes of water content were unknown, so an error of 5% was applied to the measured value to account for them. Cosmic dose rate was estimated based on the work of Prescott and Hutton (1994).
Ten replicates per sample were measured for both the IRSL and post-IR IRSL protocols, with the exception of sample YG-3, for which IRSL was measured for only six replicates. Mean De values were determined by applying the Central Age Model of Galbraith et al. (1999) and then dividing the model result for each sample by an environmental dose rate to obtain age estimates. Fading corrections were performed for uncorrected ages by using mean g-values of each sample based on Huntley and Lamothe(2001) and using the R Luminescence Package (Kreutzer et al, 2012; Fuchs et al, 2015). All ages are expressed relative to AD 2015 (Fig. 3).
. Results
Quartz OSL
The results of our LM-OSL measurements show that the sensitivity of our quartz samples from the Yumigahama barrier was much lower than that of the calibration quartz (Figs. 3A and 3B). The LM-OSL signals from quartz samples from the Nakahama Range (YG-1 to YG-6) were close to background level, but subtle OSL signals were evident for samples YG-7 and YG-8 from the Sotohama Range. The fitting of the LM-OSL curve for sample YG-7 revealed fast, medium, and slow2 components, as defined by Jain et al. (2003) (Fig. 3C). The preheat dose recovery test for sample YG-7 resulted in a wide range of dose recovery and recycling ratios (Fig. 3D), suggesting that the standard SAR protocol is unlikely to be effective for quartz samples from our study area.
IRSL and post-IR IRSL of K-feldspar
Linear dose-response curves were obtained from samples YG-1 to YG-8 for both IRSL and post-IR IRSL signals (Fig. 4). For all samples, De estimates for post-IR IRSL were much higher than those for IRSL (Table 3).
Fading tests (Fig. 5) raised two issues. First, the IRSL signals showed higher g-values (11–13% per decade) than those reported in other studies (e.g., Li et al, 2014). Second, all samples showed negative g-values for post-IR IRSL signals. Negative g-values indicate an increase of luminescence intensity during storage, and have been reported previously for IRSL signals from Japanese loess sediments (Watanuki et al, 2005; Thiel et al, 2011). In general, g-values for post-IR IRSL are lower than those for IRSL (Reimann et al, 2011b; Li et al, 2014), but they are rarely negative. Because the cause of the negative g-values we obtained is unknown, we did not correct post-IR IRSL ages for fading.
We estimated IRSL ages with and without fading corrections but only obtained uncorrected post-IR IRSL ages (Table 3). The estimated ages became consistently younger in the seaward direction, which is concordant with seaward accretion of the ridge sequence. Uncorrected IRSL ages were considerably younger than uncorrected post-IR IRSL ages (Table 3). In contrast, fading-corrected IRSL ages were older than post-IR IRSL ages except for the two youngest samples (YG-7 and YG-8).
. Discussion
We assessed the validity of our luminescence age estimates by reference to the Holocene sea-level history in the region and the nearby Nishinada Ruin archaeological site (Fig. 1C). The seaward accretion of the beach-ridge sequence probably started when the post-glacial sea-level rise ceased during the middle Holocene, as was the case for other beach-ridge plains in Japan and elsewhere (e.g., Murray-Wallace et al, 2002; Tamura et al, 2008); this is supported by the results of our GPR survey, which show reflectors representing the beach deposits almost at the same elevation along the length of the survey transect (Fig. 2). The Japan Sea coast of western Japan in the region of the Yumigahama barrier has been tectonically stable during the last 100 kyr (Okuno et al, 2014). Therefore, the Holocene sea-level history of the Yumigahama Peninsula can reasonably be approximated by the reconstruction by Tanigawa et al. (2013) of the history of the Toyooka Basin, 150 km east of our study area (Fig. 6). Tanigawa et al. (2013) showed that the post-glacial rise ceased there at 6700 cal BP and that sea level during the following stillstand was close to the present sea level. Thus, the maximum duration of the formation of the sequence of beach ridges of the Yumigahama barrier was from 6700 cal BP to the present (Fig. 6). The Nishinada Ruin site, at the northern end of the Yumigahama barrier (Fig. 1C), contains pottery from the Early Jomon Period (Sasaki et al, 2011), which spanned from 6 to 5 ka (Habu, 2004). Thus, we infer that the Yumigahama barrier began to form between 6.7 and 5 ka.
Fig. 6
Comparison of corrected and uncorrected IRSL ages and uncorrected post-IR IRSL (pIRIR) ages with the initial stage of beach-ridge formation (shaded light gray) inferred from the Holocene sea-level curve for the Japan Sea coast of western Japan (Tanigawa et al, 2013) and an age inferred from Nishinada Ruin (Sasaki et al, 2011) (Fig. 1C). T.P. (Tokyo Peil) is the standard datum for elevation measurements in Japan. T.P. = 0 is mean sea level in Tokyo Bay.
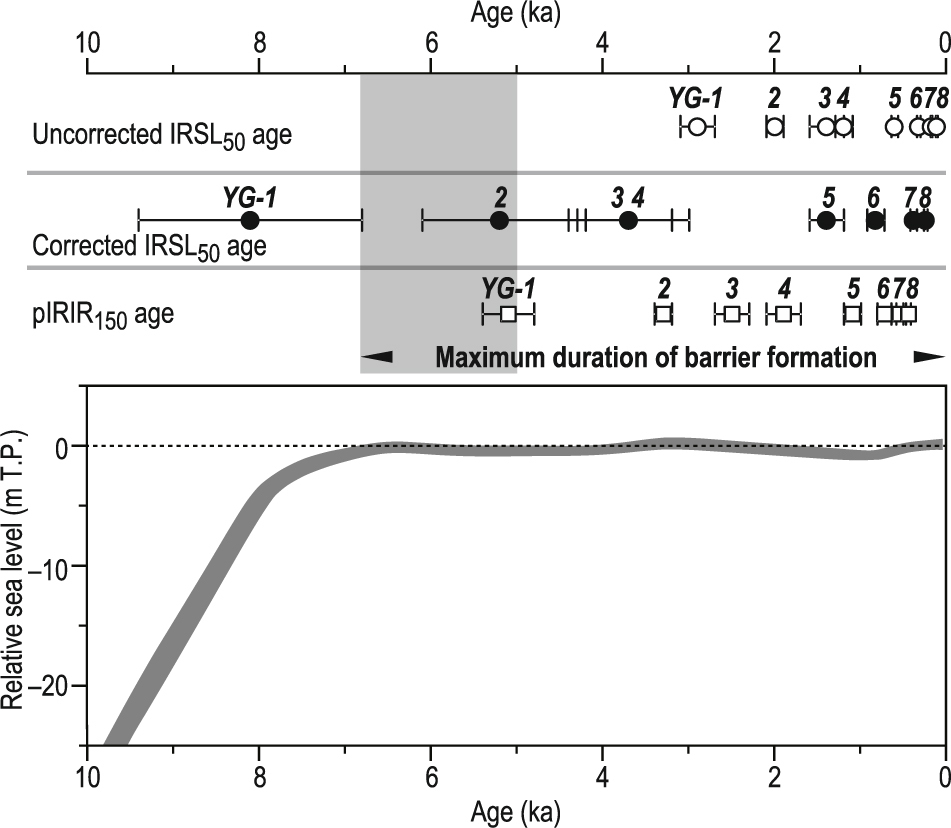
Comparison of our results with the sea-level history of Tanigawa et al. (2013) indicates that the corrected IRSL age of 8.1 ± 1.3 ka that we obtained for sample YG-1, the most landward and oldest of our samples, was slightly overestimated, even if the error range is considered (Fig. 6). The beach and foredune environment in which beach-ridge sediments accumulate is strongly exposed to sunlight, so our overestimation of the age of sample YG-1 is unlikely to be derived from incomplete bleaching of the sand before burial. Site YG-8 is only 30 m landward of the 1926 shoreline, which suggests that the age of sample YG-8 should be about 100 years. The corrected IRSL age of the YG-8 sample is 0.25 ± 0.02 ka, about 150 years older than expected, which is equivalent to a dose of 0.7 Gy. If this excess is assumed to be the residual dose, the age obtained for sample YG-1 with a lower dose rate is about 290 years (Table 1), which is still insufficient to account for the overestimate. It is thus likely that the g-values we obtained do not represent the rate of anomalous fading during geological storage, as has been reported elsewhere (e.g., Wallinga et al, 2007; Kars et al, 2012; Preusser et al, 2014). For high g-values, slight inaccuracies in their determination result in large errors in the corrected age estimate; for example, using a slightly lower g-value of 10%/decade would result in a corrected age for sample YG-1 of c. 6.7 ka, which better fits the sea-level curve of Fig. 6.
The uncorrected post-IR IRSL ages are within the period of barrier formation (Fig. 6), but appear to be underestimated. The uncorrected post-IR IRSL age of sample YG-1, without subtracting the residual dose, is 5.1 ± 0.3 ka. As was the case for the corrected IRSL age, the estimated age of sample YG-8 suggests a residual dose of 1.6 Gy, which if applied to sample YG-1 gives an age of 670 years. If this residual dose applies, the post-IR IRSL age of sample YG-1 is c. 4.6 ka, which postdates the initiation of the Yumigahama barrier by more than 400 years. Again, a fading correction with an appropriate g-value would result in an estimate of the age of sample YG-1 that fits within the period of initiation of the Yumigahama barrier.
We next considered the timing of the transition from the Nakahama Range to the Sotohama Range in terms of the observed quartz OSL properties and our IRSL and post-IR IRSL age estimates from K-feldspar. In contrast to the fine volcanic sands of the Uchihama and Nakahama ranges, the Sotohama beach ridges consist of coarser granitic sand containing iron slag (Sadakata, 1991). Sadakata (1991) attributed this difference to the start of iron mining on weathered granite (locally called “Kanna-Nagashi”) in the catchment of the Hino River and the associated increase in discharge of granitic sand at the river mouth, which increased the rate of shoreline progradation. We consider that the fast component of quartz OSL evident in samples YG-7 and YG-8 (Fig. 3B) reflect the higher granitic sand content in the Sotohama Range, which agrees with the results of Tokuyasu et al. (2010) who showed that granitic quartz sand exhibits a stronger fast OSL component than volcanic quartz sand.
Small-scale iron mining in the region started during the Medieval Period, and began to expand in response to technological advancements in the mid-17th century, after which human settlements appeared on the Sotohama Range; mining peaked toward the end of the 18th century (Tokuyasu, 1999). Thus, we consider that the boundary between the Nakahama and Sotohama ranges represents the shoreline during the 17th and 18th centuries. The corrected IRSL ages of samples YG-6 (Nakahama Range) and YG-7 (Sotohama Range) are 0.83 ± 0.10 ka and 0.39 ± 0.04 ka, respectively, both of which are older than the boundary between them (Fig. 7). However, subtracting a residual dose of 0.7 Gy, as inferred from sample YG-8, provides dates of 0.36 and 0.16 ka, respectively, for samples YG-6 and YG-7, which are approximately concordant with the age of the transition between the two ranges.
Fig. 7
Corrected and uncorrected IRSL ages and uncorrected post-IR IRSL (pIRIR) ages of samples plotted against distance landward from the 1926 shoreline (after Inoue et al, 2004). Inset is an enlargement of the area shaded grey.
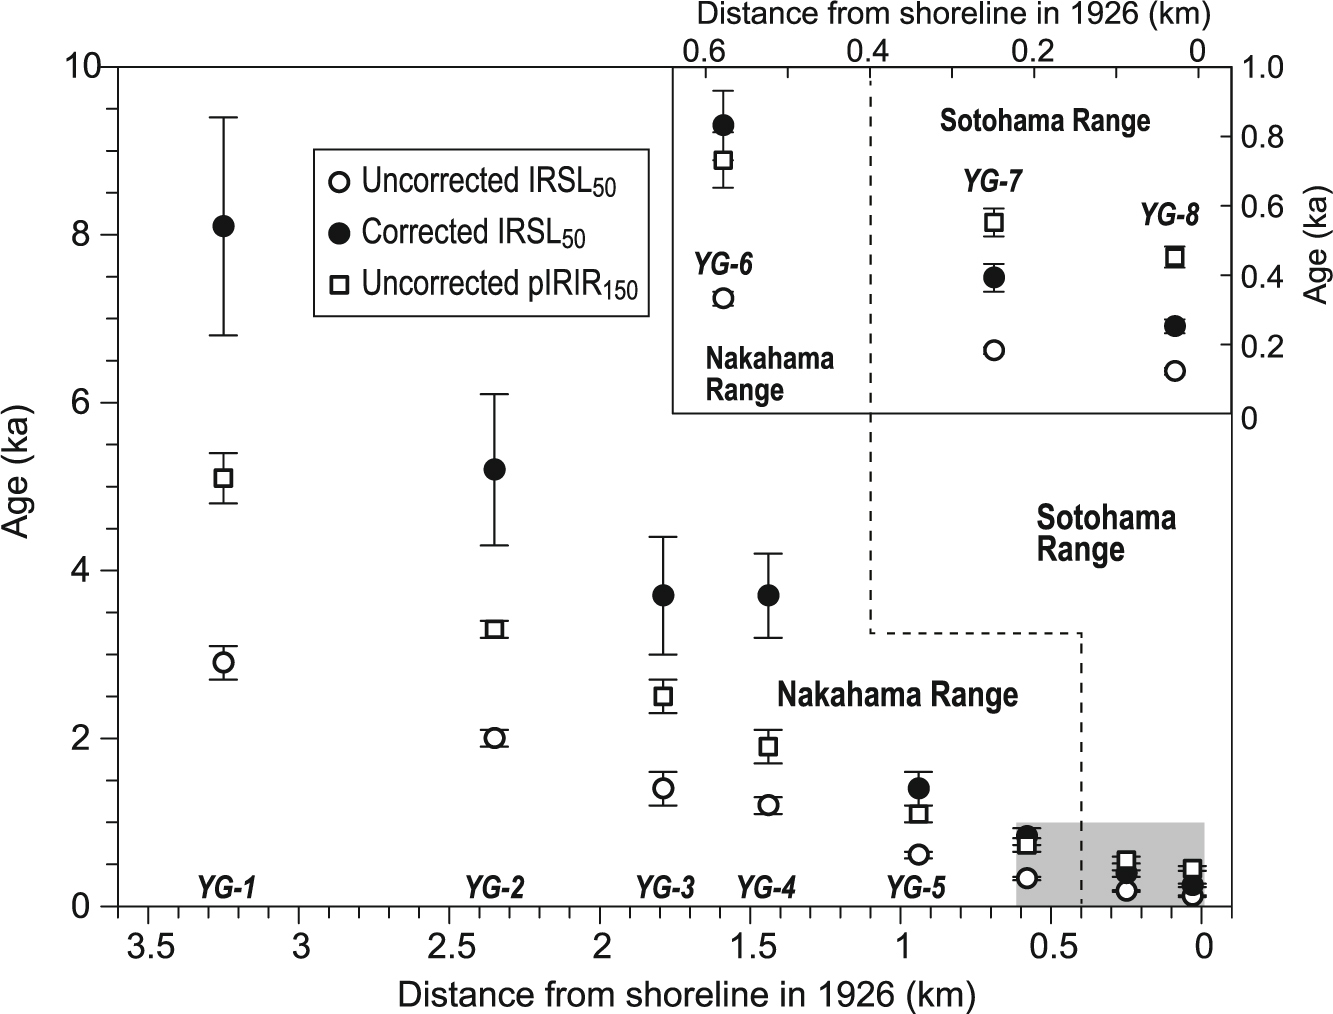
Although problems of slight over- or underestimation remain, the corrected IRSL and uncorrected post-IR IRSL ages of samples plotted against distance from the 1926 shoreline (Fig. 7) appear to show two linear trends, with a change of gradient between samples YG-6 and YG-7 that suggests an increase in the rate of shoreline progradation at the transition from the Nakahama to Sotohama ranges. Sample YG-4 provided the only pronounced outlier from these linear trends. However, the g-value we determined for sample YG-4 is higher than those of samples YG-1 to YG-3 and YG-5, and may have been responsible for the overestimate. Assuming that the shoreline progradation started during 6.7–5 ka, we estimate the rate of progradation of the Nakahama Range to be 0.4–0.6 m/y. As discussed above, we consider the ages of samples YG-7 and YG-8 to be 0.16 ka, and 0.10 ka, as inferred from the 1926 shoreline, respectively, which indicate that the rate of progradation of the Sotohama Range was c. 3–4 m/y.
. Conclusions
Our IRSL50 and post-IR IRSL150 dating of beach-ridge sands of the Holocene Yumigahama barrier was successful in that all of the dates we obtained were of Holocene age and there were no age reversals. However, fading-corrected IRSL ages were slightly overestimated and uncorrected post-IR IRSL ages were slightly underestimated. Fading tests of IRSL signals gave higher g-values than previous studies, which significantly affected our age estimates. Fading tests of post-IR IRSL signals resulted in negative g-values, which we could not explain. Thus, we did not apply fading corrections for post-IR IRSL age estimations. However, the underestimation of uncorrected post-IR IRSL ages suggests that the post-IR IRSL signal is also subject to anomalous fading. These observations indicate that standard fading tests do not estimate appropriate g-values for K-feldspar in samples from the Yumigahama barrier. The cause of the negative g-values we obtained is especially problematic and should be further investigated. Improvement of the results of fading tests might be achieved by reviewing the experimental protocols, including the amount of regenerative dose used, storage times, and preheat times.