
. Context and concept
Within the framework of architectural and historical studies, the relevance of dating techniques has been illustrated through performance prediction of existing structures, as well as by the selection of appropriate replacement masonry units (Laefer et al., 2004). In addition, as far as the conservation of built heritage is concerned, building dating helps specialists in the field of cultural heritage to justify conservation or reconstruction measures with respect to the historical and aesthetic values of a monument.
Built heritage is dated, whether absolutely or relatively, by using historical sources, such as ancient maps and plans, drawings, paintings and written records that testify to the year of construction or transformation. The archaeology of a building is also useful to confront results obtained from historical studies and helps to better understand the morphological transformations of a construction through time. Laboratory tests may also provide data regarding material properties and compositions. Such characteristics, regarding the type of material used and their specific characteristics, may be related by specialists to a particular period of time or region of production. Where ceramic materials are concerned, these laboratory tests require samples that can be analysed with expensive and sophisticated dating tools, such as the thermoluminescence technique (TL), the optically stimulated luminescence technique (OSL), or radiocarbon and archaeomagnetic dating (Stella et al., 2014). Such studies are always time-consuming and never operated on-site, which also draws a barrier between the archaeologists and scientists.
In this context, the primary motivation of this study was to evaluate the validity of an innovative method for dating monuments with low-tech, non-destructive instruments, which are easy to handle, even for non-scientists. The second objective was to estimate the correlation between the decay of a brick wall exposed to weathering and the date of construction of the monument. Among the non-destructive tools used to assess the hardness of building materials and the effect of climate on their resistance, the Schmidt rebound hammer is one of a kind.
Initially used for concrete hardness characterisation, the Schmidt hammer was, at its origin, employed for its ability to quickly assess the strength of concrete through the value of its mean rebound values. Since then, this method has also been applied to rock and ceramic materials. Based on such a method, its use was soon diverted to rock studies as a dating method known as Schmidt hammer exposure dating (SHED). This method is based on the principle that a rock surface which is uncovered for longer periods of time is relatively softer compared to a covered one. Since this hardness is measurable with the hammer, it becomes possible to build a calibration curve based on different measurements from stones of known ages. Rock-surface hardness as an indication of exposure has also been used in archaeological contexts, as it is non-destructive, designed for in situ testing and has proven to be an extremely efficient technique for field assessments (Betts and Latta, 2000). This field of research is still being explored in geological studies in which the surface weathering of a rock outcrop is widely used as an indicator of rock age (McCarroll, 1994; Shakesby et al., 2006; Sanjurjo et al., 2009; Stahl et al., 2013; Matthews et al., 2016; Tomkins et al., 2016; Tomkins et al., 2018). Research carried out by Tom-kins et al, (Tomkins et al., 2016) indicates that granite weathers linearly over significant spatial scales for regions with a similar climate. According to Shakesby et al, (2006), the weathering rate declines slowly over very long timescales, often exceeding 100,000 years. Although these studies provide SHED calibration curves that correlate with the degree of decay of a rock type with its age, the time laps under the scope are measured in kilo annum (ka). Therefore, the validity of SHED for dating monuments is a central question to this research, as very few studies have explored this domain. The use of the Schmidt hammer for assessing the state of decay of a material was discussed by Iqbal (Iqbal, 2016). She proposed a new approach for quantifying the soiling and dating exposure of limestone façades based on rebound values, for time laps that do not exceed 30 years of exposure to the environment. Her research showed that the higher the level of contamination or soiling accumulation, the lower the surface hardness. Similarly, the results presented in this paper are based on the assumption that historical brick masonry which is exposed to climatic conditions for a longer period of time is likely to be more weathered in comparison with the earlier brick masonry.
. Historic Bricks
Bricks produced prior to the mid-20th century show high variability in colour, geometry and mechanical properties (Laefer et al., 2004) compared to the industrially made ones. This results from the quality and variability of the raw material, as well as the traditional techniques and methods used for shaping and firing. In this paper, the traditional bricks which are studied are differentiated from the industrial ones, as they are made by hand and differ by the methods used for shaping and firing the raw material. Hand moulding and pressing were in use for manufacturing fired-clay bricks before mechanical extrusion appeared. The firing process also involved the use of a kiln type that saw some technical improvements over time (Perez-Monserrat et al., 2017). The firing technique influences the physical and chemical properties of the product, as well as its weathering resistance to climatic conditions, as the firing temperature is a major factor that influences the degree of vitrification and the brick’s resistance to decay (Elert et al., 2003; Cultrone et al., 2004). On this particular aspect, it is well known that bricks fired at higher temperatures have higher durability. A longer heating period will also ensure a better-quality product.
Among the different types of kilns used to fire bricks, the field kiln was the most primitive and popular, and was used from the early ages until the 19th century. It was built near the construction site for temporary use only. This type of kiln is erected with raw bricks, stacked together and covered with a layer of clay and grass. During firing, the whole production is exposed to varying temperatures, depending on the relative position of the bricks within the kiln, which in turn affects the mechanical properties, porosity and water absorption of the material. This was proved by Laefer (Laefer, 2001 and Laefer, 2004) who showed that the variability from a single firing exhibited over a 100% strength difference between the strongest and the weakest brick.
The downdraft kiln is a refined version of the updraft model (see below) for larger production (50,000−60,000 bricks) and with better heat distribution. The flames surround the bricks, allowing the heat directed upwards to go downwards by means of flues placed under the kiln floor and connected to a chimney. Although this technique was an evolution in the brick-making process, it still gave a variable quality product which could influence the durability of the material. The continuous draft model is made of chambers with multiple firing places to allow the distribution of heat from one chamber to another by flues. This model was widely used until the mid-19th century, as it reduced heat wastage. In 1858, Hoffman and Hieut improved the chamber kiln into a series of continuous chambers adjoined to each other in a circular form. Firing and cooling occur sequentially in the chambers, allowing the heat to be transferred from one chamber to the next for preheating. From 1910, continuous chamber kilns quickly became established in Europe, with 90 to 95% of all bricks burned with this technique. Similarly, the modern tunnel kiln invented in 1751 is based on the chamber kiln process. Here, brick production is moved on tracks over three days through a stationary heat source before cooling. The benefit of this evolution is mass production and reduction in maintenance costs. More details regarding kiln types, their history and performances can be found in Hoehne (1910), Rhodes (1968), Laefer (2001) and Laefer et al. (2004).
In the framework of this study, the author assumes that the bricks used for the tests were fired by updraft and downdraft kilns, as the churches used as case studies were erected between 1600 and 1895. Therefore, it was expected that the quality and properties of the bricks fired since the mid-18th century until 1858 vary because of the joint presence of field kilns and tunnel kilns in the same area.
. Methods
. Schmidt hammer and rebound values
The Schmidt hammer is a low-cost tool that is easy to handle, making it perfect for on-site inspections. Different models exist depending on the type of materials and hardness to be evaluated. Widely used for stone (Sachpazis et al., 1990; Amaral et al., 1999; Yasar and Erdogan 2004; Aydin and Basu 2005; and Fort et al., 2013), concrete, mortars (Schueremans et al., 2011; Sanchez and Tarranza 2014) and bricks (Brozovsky et al. 2008; Matysek and Latka 2012; and Roknuzzaman et al., 2017), this tool is also considered to be non-destructive in comparison with more destructive tests which usually involv sampling. It can be seen that past research which has made use of Schmidt hammers has mostly been focused on establishing calibration curves that correlate with the strength of the material and rebound values to provide a straightforward method to assess the quality of the brand-new products.
The principle of the Schmidt hammer test is based on the absorption of part of the spring-released energy through the plastic deformation of the material surface, while the remaining elastic energy causes the actual rebound of the hammer (Sharma et al., 2011). A rebound value, Rn is measured for each impact n of the hammer on a surface at the same point, with n=1 to 10. It is also recommended to select different points on a surface and calculate an average rebound value for each impact. Weathering factors, such as freeze and thaw, salts, pollution or biotic agents modify the surface roughness of the brick and affect its durability by progressively weakening and disintegrating its surface. This process leads to superficial hardness reduction. Knowing that the Schmidt hammer is sensitive to surface roughness (Aydin, 2009), researchers also found applications in geomorphological studies and rock-decay assessments to show the existence of a link between the hardness of the material and its degree of decay when exposed to climate agents (Day 1980; Pope et al., 2002; and Owen et al., 2007) or biotic agents (Guglielmin et al., 2012). The use of a Schmidt hammer for brick hardness comparison was also highlighted by Debailleux (Debailleux, 2018) who showed that repeated hammer impacts on the same point generated increasing rebound values until the fifth impact. The results also proved that there were no statistically significant differences between mean rebound values after the fifth impact as the curves of the rebound values (Rn progressively level off. It can also be considered that the mean value of the first rebound value, R1 refers to the superficial hardness of the outer skin of the brick, whereas the fifth rebound value, R5 approximates the hardness of the unweathered material. This was also emphasized by Aydin (Aydin, 2009) in earlier research carried out on rocks.
. Weathering indices
Building stone weathering, and especially the degree of damage and the rate at which it occurs, has been a matter of research and discussion (Fort et al., 2013). In the field of archaeometry, past research has been devoted to comparing surface hardness values of building stones with their exposure age (Betts and Latta 2000 and Fort et al., 2013).
As early as 1965, tests carried out on intact and weathered rock surfaces indicated that the reduced values of surface hardness could be used as a weathering indicator (De Puy, 1965). This also means that materials exposed to weathering are more prone to decay compared to the non-exposed materials, and this difference is noticeable through the evaluation of the Schmidt rebound value.
Research conducted in the frame of geology and rock mechanics suggests that stone decay is a linear process (Shakesby et al., 2006 and Winkler, 2005), while others contend that the deterioration rate is not constant (Sanjurjo et al., 2009; Betts and Latta, 2000; and Fort et al., 2013). As far as ceramic materials are concerned, the dependency between surface hardness and decay with relative age remains a relevant research domain, as comparable studies that use Schmidt hammers do not exist.
With regards to rock-surface weathering, Matthews et al. (2016) observed that the comparison between both the first and fifth rebound values allows the decay of the material to be quantified, as the difference between the mean rebound values of the first to nth impact on a surface can be expressed as the percentage of the mean rebound values of the nth impact (Rn). The result In (%), called the material-surface weathering index, is obtained from the equation:
. Sampling procedure
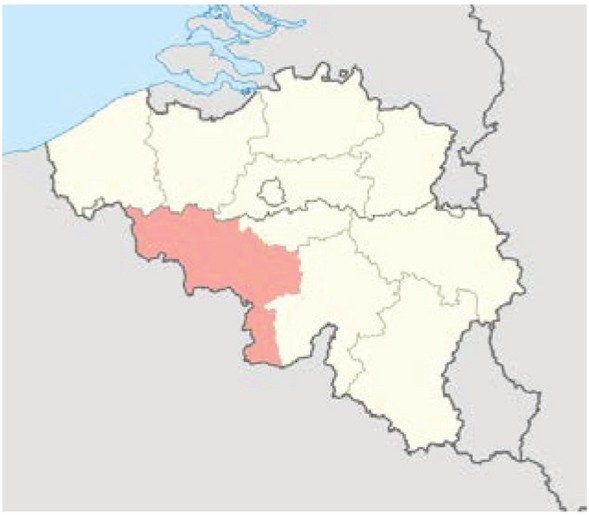
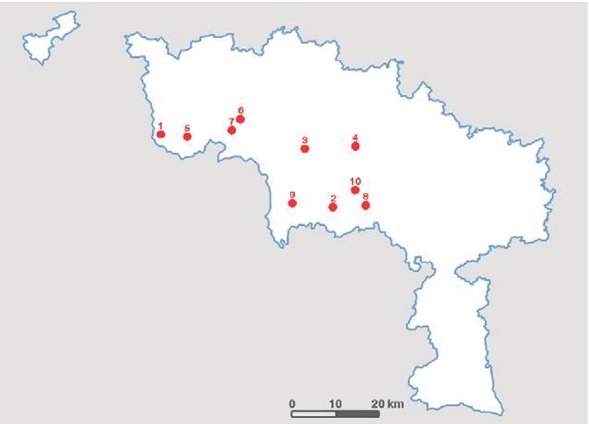
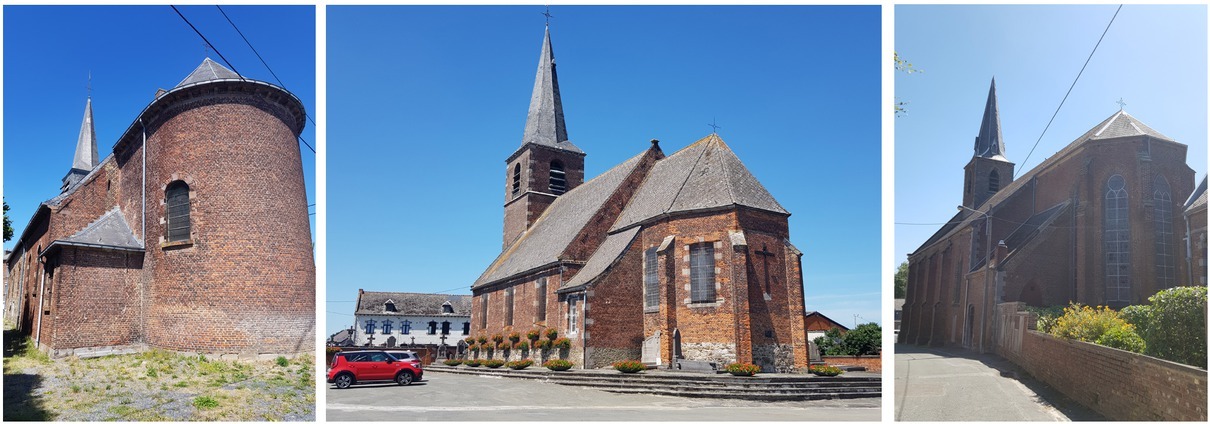
Ten churches, built with traditional bricks between 1600 and 1895, listed as built monuments and precisely dated by historical sources were chosen in a particular area of Belgium (Figs. 1 and 2). These monuments have the advantage of being mostly oriented, meaning that the altar usually faces east, whereas the main entrance faces west. This repetitive orientation of the buildings facilitates comparisons between measurements done on façades. Fig. 3 illustrates three churches built in 1717, 1725 and 1856 that were selected for the tests.
Schmidt hammer tests were done on each façade of the buildings according to the points of the compass. For each façade, depending on the building’s scale, at least 20 bricks were selected, all located in two different zones of each façade. All tests were performed by the author with a Schmidt hammer type LB held horizontally, perpendicular to the brick surface during summer time (TMean = 15.4°C; RH = 69%). Each brick was successively impacted five times at its centre, and for each impact done on each brick, a rebound value Rn was calculated for each façade.
. Results and discussion
. Rebound values
Table 1 provides the mean rebound values measured for the first five impacts Rn (with n=1−5) for each building and each façade. No measurements were acquired for the west façades of Churches 1 and 2, nor were they for the east façade of Church 10, due to the occurrence of stone masonry at these locations.
Table 1
Rebound values measured for the first five impacts, Rn (with n=1−5).
The plot of the mean Schmidt hammer rebound values R1 and R5, built with all the measurements from the façades and compared as a function of the construction dates is shown in Fig. 4. The results indicate that the mean R1 rebound values are within the range of 24.2 (Church 7, 1790) and 31.2 (Church 5, 1774), while the mean R5 values are within the range of 34.1 (Church 2, 1717) and 41.1 (Church 5, 1774). Although the oldest monuments show the lowest R1 values, the results also show that the different R1 values do not strictly increase from the oldest building (Church 1) to more recent ones, at least until 1790. From 1717 (Church 2) to 1774 (Church 5), the mean first rebound value increases before dropping to lower values. Considering the results of the whole dataset, the hardness of the bricks is not corelated with the age of all the monuments. This suggests that other parameters, such as raw material quality and the manufacturing process, influence the conservation of the building material.
Fig 4
Mean Schmidt hammer rebound values R1 and R5 as a function of the construction dates. Uncertainty bars are shown.
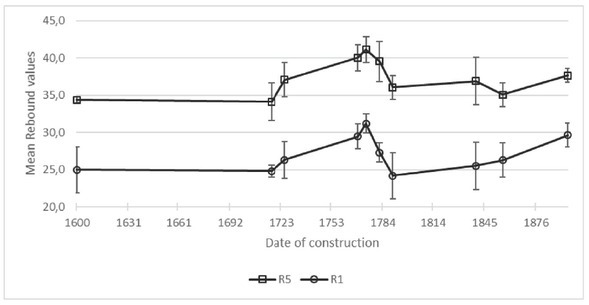
A clear correlation exists between R1 and R5 values as both the mean values fluctuate in the same proportion for the time laps with a ratio of 127% (minimum, Church 10) and 149% (maximum, Church 7). The mean R5 values for all the buildings indicate that the material strength is not higher for more recent products. On the contrary, bricks used between 1769 (Church 4) and 1782 (Church 6) present higher R5 values, which could indicate that these products are more resistant compared to the other samples. Fig. 4 shows that hard bricks with high R5 values, such as those tested on Church 5, also present higher R1 values. Therefore, there is a clear dependency between the material strength and its resistance to weathering. In other words, the hardness of the brick influences the degree of decay of the material when it is exposed outdoors. The most ancient bricks dated back to 1717 present lower R1 rebound values, which confirms that the oldest brick samples were more weathered than the more recent ones.
Contrary to what could be expected, the R5 mean rebound values did not linearly increase through time. Although the R5 mean hardness values were relatively stable from 1790 to 1895, extreme R5 values were measured for churches between 1769 and 1790 (Fig. 4) which may indicate that both the field and tunnel kilns were in use since the mid-18th century. All in all, the expected age-hardness relationship was not observed for the whole dataset. Churches built between 1790 and 1895 showed increasing R1 values, which indicate the effect of weathering on these samples, while R5 values, representative of brick strength, tend to stabilize, showing products of comparable strength.
. Weathering indices
A plot of the weathering indices (I5) as a function of the building dates is shown in Fig. 5. For better understanding, the results have been grouped into four orientations, corresponding to four points of the compass (Table 2).
Fig 5
Weathering indices (±95% confidence intervals; n=30) as a function of the building dates and grouped into the orientations of the compass.
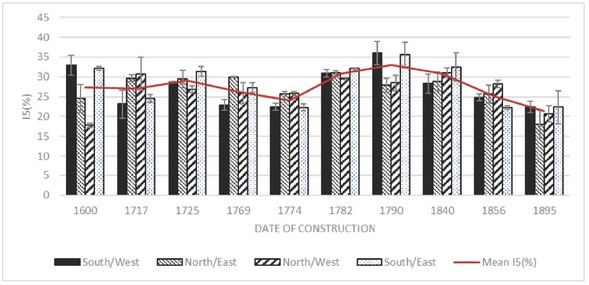
The results indicate that I5 (%) values do not strictly decrease from 1600 to 1895, which is coherent for the first and fifth rebound values discussed in the previous section. However, things are different for churches built after 1790. It is interesting to call to mind that these samples also present increasing R1 values. Variations of I5 (%) values (Table 2) are contained within a range of 0.31% (Church 6, South/East) and 19.33% (Church 10, North/East).
Table 2
Weathering indices (I5) as a function of the building dates and specific orientations of the façades (mean ± 95% confidence interval; n=30).
Fig. 6 shows the relationship between I5 (%) values with the corresponding age of the construction. The dataset can be divided into three groups (G1, G2 and G3) with specific observations. Group G1, constituted of Churches 1 to 3 (constructed between 1600 and 1725) shows rather constant weathering indices for the whole period of time, although
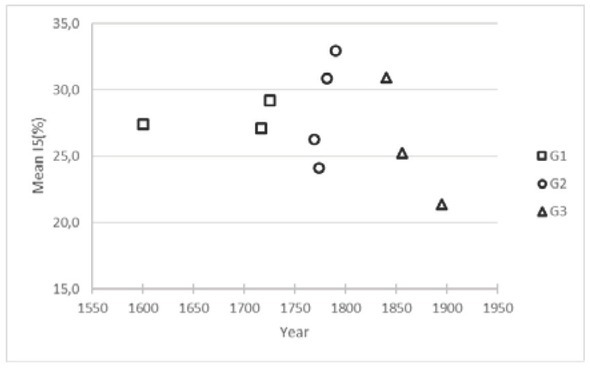
only few buildings of this period were found. During a very short period of time (1769−1790), a variability of I5 (%) values was observed for group G2 (Churches 4 to 6). Within this period, the lower I5(%) values may correspond to better products and bricks fired at higher temperatures. Logically, bricks presenting higher weathering indices could be viewed as potentially more altered because of poorer quality. Group G3 concerns churches built since 1790, with I5(%) values with decreased weathering indices over time.
For this group (G3), the equation of the best fit line and the coefficient of determination (R2) are listed in Table 3. A high coefficient of determination, up to 0.8, was found for each orientation of façade, except for north−west façades (R2= 0.6). The best result, with the maximum coefficient of determination, is obtained when a mean value of I5 (%) is calculated, based on all the façades‘ measurements.
. Conclusions
Fired clay bricks are well known to present non-heterogeneous structures, mainly influenced by the raw material, the firing process and the long-time exposure to climatic conditions.
The presented study was the first step to explore the occurrence of a relationship between the degree of decay of brick masonry and its age. A non-destructive tool able to evaluate the harness of ancient bricks was used to compare the results obtained from a sample of 10 churches, built between 1600 and 1895.
Schmidt hammer tests were carried out on each façade in order to measure the mean rebound values (Rn with n=1−5) for bricks. These tests refer to the resistance of the surface to successive n impacts of the hammer on the brick surface. Based on these results, for each façade, the weathering index I5 (%) was used to quantitatively evaluate the degree of decay of the brick surfaces.
The tests indicate that the Schmidt hammer is efficient for evaluating historical fired clay brick weathering, as the rebound values measured for each successive impact were significantly affected by the degree of decay of the material exposed to climatic conditions for centuries.
However, the results illustrate that the first and fifth mean rebound values do not decrease with the respective time of construction for the whole dataset. This means that R1 and R5 values are not strictly correlated with the ages of construction. Therefore, this research confirms that other factors, such as the quality of the raw material (composition and homogeneity), the type of kiln used for firing, as well as the parameters that define the process (brick locations within the kiln, temperature, duration) play an important role in the capacity of the material to resist decay when it is exposed to identical climatic conditions.
The mean R5 values and mean R1 values measured for the whole data set vary in the same proportions, which indicates that the first rebound measurement is a reliable indicator for estimating brick quality. However, for the samples under scope, the research also highlights that there is no relationship between the quality of brick and its age. This also means that older bricks can show higher hardness and higher compressive strength, compared to recent samples.
The fact that the mean R1 values were strongly correlated with R5 ones, and that superficial hardness is not strictly related to the time of exposure, also explains why the weathering indices I5 (%) values did not increase with the age of the building. Indeed, this rule was only observable for buildings constructed between 1790 and 1895. This trend could be explained by better-quality products, as confirmed by the low fluctuation of mean R5 values, during this period. This hypothesis is also confirmed by the invention of modern kilns which appeared in 1750, and the progressive abandonment of the traditional kilns in the area under scope. The difficulty to establish a strong relationship between the date of construction and decay of the bricks was also illustrated by the equable I5 (%) values measured for the oldest samples dated between 1600 and 1725. Although only three samples are concerned, for such a period of time of exposure, it is unconceivable that decay remains constant, contrary to the indications of the samples spread out between 1769 and 1790.
Based on these observations, the preliminary results tend to indicate that SHED is a hazardous technique to date masonry dating back to 1790 or that made of bricks fired with uncontrolled methods and traditional kilns. This is because the Schmidt hammer measures the hardness of the material and this hardness depends not only on the weathering factors but also on the initial properties of the product. As such, it is difficult to interpret the respective influence of both parameters.
However, the occurrence of a high correlation between the parameters, with a coefficient of determination R2ranging between 0.64 (north/west) and 0.90 (south/west), with a mean value of 0.95, indicates that SHED is a valid approach for masonry buildings that have been standing since 1790. The influence of the orientation of the façade on the R2values was also highlighted and shows the influence of sampling when conducting SHED tests on masonry. Such findings reduce expectations for older constructions. Future works should firstly confirm these preliminary results by enlarging the dataset with more samples. Hypotheses related to the influence of the brick-making process will be examined through the scope of complementary laboratory tests carried out on samples (petrographic analysis, mineralogical composition and micro-structure), as well as through deeper historical studies related to kiln technology and evolution.