
. Introduction
Scots pine is a very useful archive of changes in ecosystems, because it has a specific sensitivity to local environmental conditions, including climate. (Schweingruber, 1985; Richter et al., 1991; Lindholm et al., 1997, 2000; Mäkinen et al., 2000; Wilczyński et al., 2001; Wilczyński and Skrzyszewski, 2002; Macias et al., 2004). Various indicators, such as an increase in the stem diameter, can be used to describe tree vitality. Furthermore, the diameter increment can also be used to assess the sensitivity of trees to climatic factors in polluted areas (Malik et al., 2012).
Year-on-year variations in tree-ring widths are mainly caused by meteorological conditions. Industrial pollution impairs the sensitivity of trees to climatic factors. However, the trees retain their year-on-year tree-ring width changes, even during periods of high-pollution emissions.
Experiments and analyses of the stable isotope composition of annual tree rings conducted by various scientists (e.g., Craig, 1954; Burk and Stuiver, 1981; Leavitt and Long, 1982; Edwards and Fritz, 1986; Ehrelinger and Vogel, 1993; Farquhar and Lloyd, 1993; Yoder et al., 1994; Schleser et al., 1999; Roden et al., 2000, Roden, 2008; Barbour et al., 2002, 2004; Gagen et al., 2004; McCarroll and Loader, 2004; Szczepanek et al., 2006; Treydte et al., 2007; Sensuła et al., 2011; Leonelli et al., 2012; Sensuła, 2016a), have confirmed that the stable isotope composition of wood can be varied by climatic changes. Through photosynthesis, trees convert carbon dioxide and water into saccharides (C6H12O6)n by using light. The climatic controls are therefore factors which control stomatal conductance, and are dominated by relative air humidity and soil-moisture status, while those which control the photosynthetic rate are dominated by light levels and leaf temperature (McCaroll and Loader, 2004). The δ18O of cellulose might also depend on the isotopic composition of water used during photosynthesis (Burk and Stuiver, 1981; Edwards and Fritz, 1986; Yakir et al., 1990; Saurer et al., 1997a; Anderson et al., 1998; Switsur and Waterhouse, 1998; Barbour et al., 2002; 2004; Saurer et al., 2002, 1997b). Farquhar and Lloyd (1993) and Roden et al. (2000) have reported that the oxygen isotopic composition of trees (δ18O) can be influenced by the δ18O in meteoric water and the δ18O of atmospheric vapour. Patterns in the δ18O of meteoric precipitation reflect condensation and evaporation within air masses (Siegenthaler and Oeschger, 1980; Rozanski et al., 1993). Schleser et al. (1999) has found that changes in temperature coefficients can be due to the nonlinear transformation of environmental signals through biological systems.
A combination of several independent indicators constitutes a useful tool in environmental analysis, such as in dendrochronological and climatological research. Scientists attribute the variations in the stable isotope composition to climate changes, and also to anthropogenic effects (Gagen et al., 2011; Leonelli et al., 2012; Sensuła and Pazdur, 2013a, 2013b; Sensuła, 2016b). A decrease in the δ13C concentration in the air and the biosphere is associated with an increase in the CO2 concentration in the atmosphere (Craig, 1954; Farquhar and Lloyd, 1993; Saurer et al., 2002; McCarroll and Loader, 2004, McCarroll et al., 2009; Pazdur et al., 2007, 2013; Keeling et al., 1996; Rinne et al., 2010; Sensuła and Pazdur, 2013a, 2013b; Battipaglia et al., 2013). The average global atmospheric CO2 concentration has risen from 331 ppm in 1975 to 393 ppm in 2012 (NOAA). Raw δ13C data can be corrected to a pre-industrial atmospheric δ13C (McCarroll and Loader, 2004; McCarroll et al., 2009, NOAA).
According to Saurer and Siegwolf (2007), the stronger response of photosynthetic capacity (A) indicates that some species could enhance biomass accumulation due to the increasing CO2 during the last decade, whereas other species responded more strongly with reduced stomatal conductance and less transpiration and water loss. According to scientists (Farquhar and Lloyd, 1993; Ehlelinger and Vogel, 1993; Scheidegger et al., 2000; Saurer et al., 2004; Silva and Horwath, 2013), a combined analysis of carbon and oxygen isotopes in tree rings can be used for determining whether stomatal conductance (g) or photosynthesis (A) contribute the most to the variations in the amount of carbon acquired per unit of water lost – the iWUE – intrinsic water-use efficiency) in response to environmental changes (Eq. 1.1).
The observed anthropogenic impact on the carbon cycle is mainly related to various global industrial activities (Martin et al., 1988; Ferrio et al., 2003; Keeling et al., 1996; Pazdur et al., 2013; Boden et al., 2016). However, the other pollution effects go beyond the scope of this paper, and have been the subject of other publications (Sensuła, 2016a, 2016b; Sensuła et al., 2015a, 2015b; Sensuła and Wilczyński, 2017; Sensuła et al., 2017). In the literature, there is an absence of reports on climate signals recorded in respect of the tree-ring width and the stable isotope composition of trees growing in the wide Silesia region (Sensuła et al., 2015a). The aim of this study is to extend the current knowledge of the interaction between climate and the trees’ response in three forests in the Silesia region (Poland), to answer the question of whether there is a similar or different pattern in the regional climate signals recorded in the trees. Further, we aim to obtain additional information on the climate-radial growth relationships of pine and to examine the differences in the stable carbon and oxygen isotopic composition of α-cellulose extracted from the pine (Pinus silvestris L.) growing, under CO2 anthropogenic-emission stress, in the most industrialised part of Poland.
. Materials and methods
The climate-radial growth relationships were analysed for the period 1951–2012, whereas the climate-stable isotopic relationships were analysed for the period 1975–2012. The software programs Statistica 12 (Statsoft Inc. 2014, Kraków, Polska) and DendroClim2002 (Biondi, 1997) were used for the statistical analyses.
Sampling sites
The dendroclimatological sampling reported in this paper included 16 pine sites in three regions – Dąbrowa Górnicza near Huta Katowice (HK), Kędzierzyn-Koźle (KK), and Łaziska (LA). The sampling sites were located at varying distances from industrial factories (distance range: 1–20 km from the factories, Table 1).
Table 1
The localisation of the sampling sites.
At each site, 20 pine trees were sampled by taking one increment core per tree at a height of 1.3 m above ground. All 320 tree samples were dominant and co-dominant individuals without damage. The examined pine stands were located in similar habitat conditions around the industrial factories. All the pine stands were classified as fresh mixed broadleaved forest and aged between 80 and 100 years.
Meteorological data
Meteorological data were provided by the Polish Institute of Meteorology and Water Management (IMGW-PIB). The temperature, humidity, sunshine duration and precipitation data were obtained from the meteorological stations in Katowice and Opole.
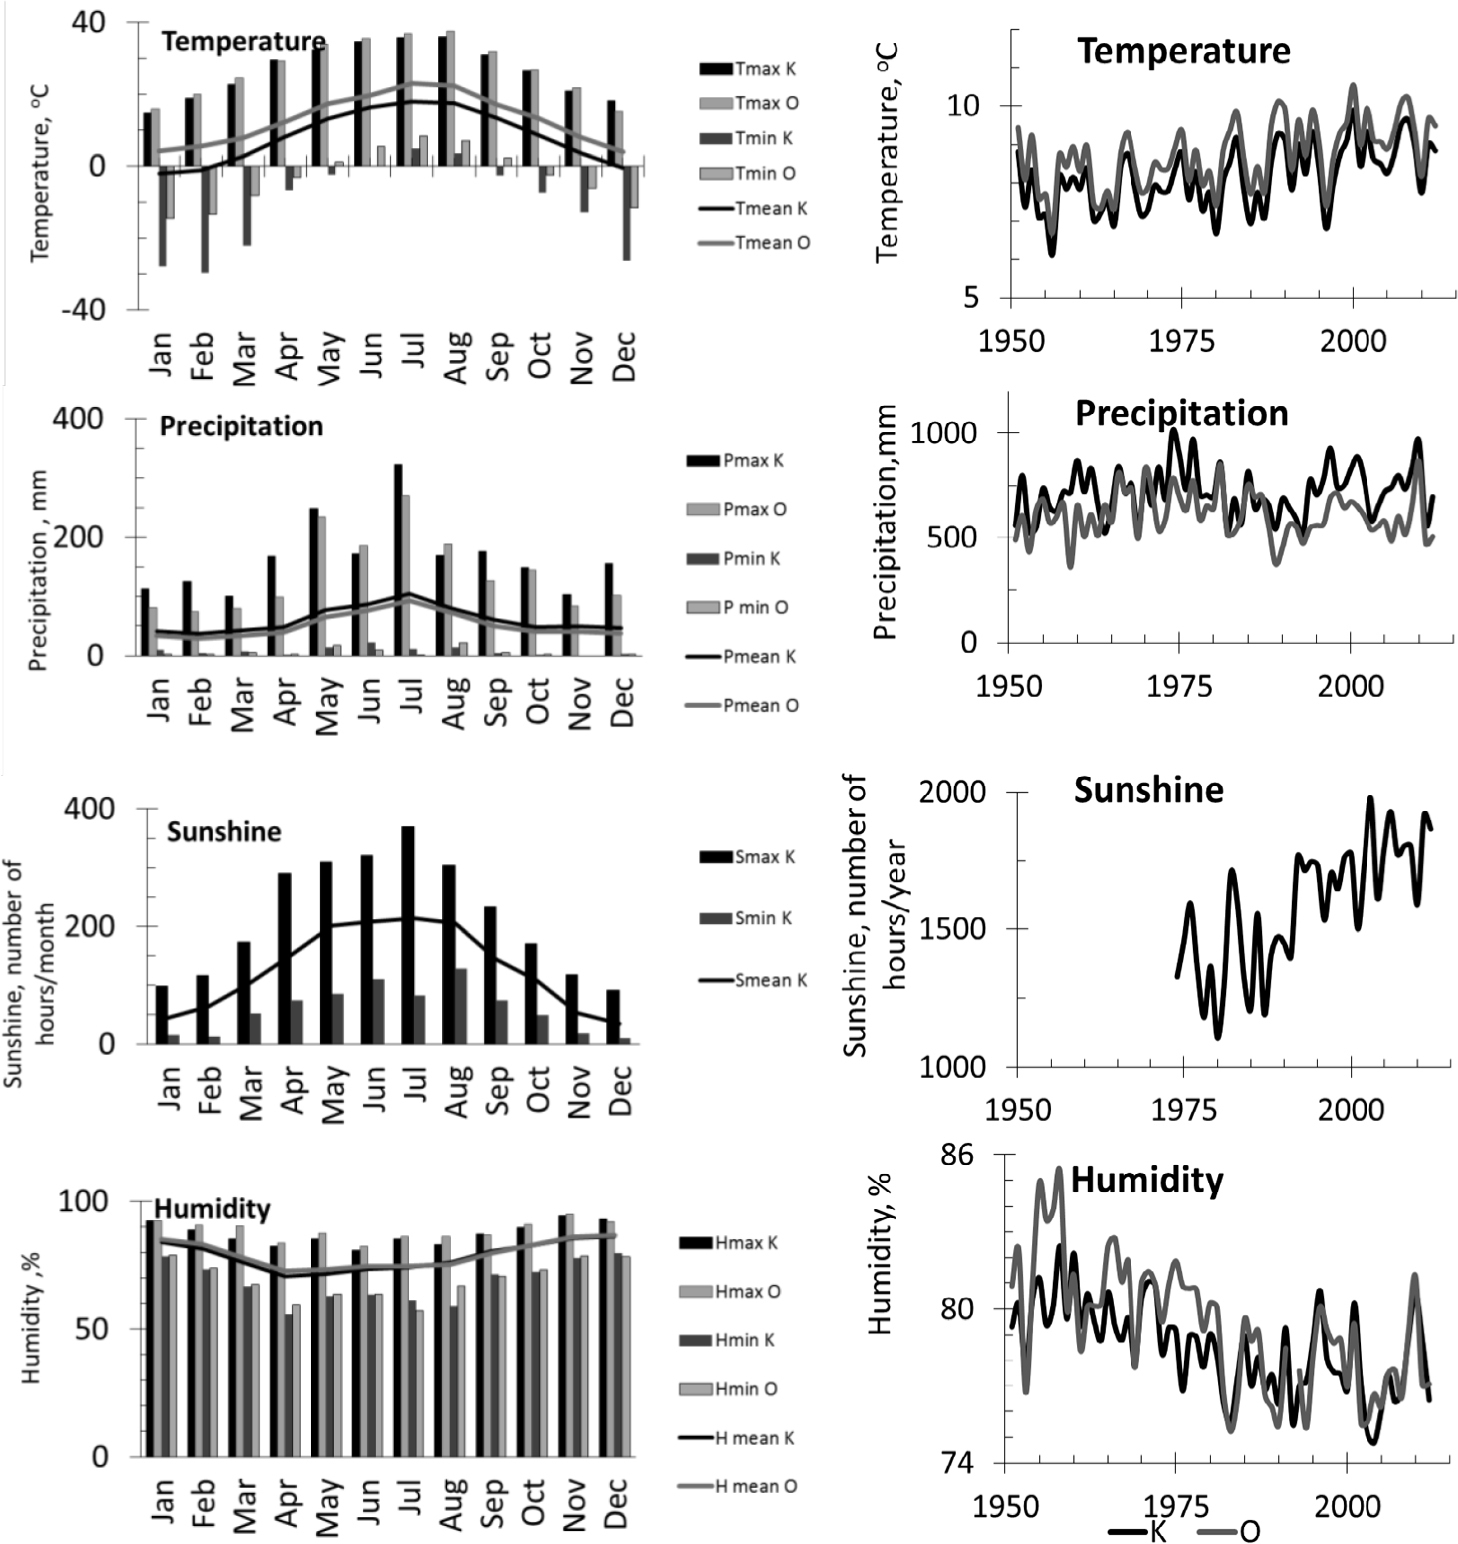
The period from 1951 to 2012 was characterised in the regional climate records by the following: an annual mean temperature of approximately 9°C (annual range of 6.5 to 10.5°C/yr), a mean annual precipitation of around 610 mm (annual range of 360 to 870 mm/yr), mean annual number of sunshine hours of approximately 1530 h (annual range of 1108 to 1978 h), and relative humidity of around 80% (annual range of 75% to 86%). The lowest precipitation was observed between the mid-1980s and the mid-1990s (Fig. 1).
The dendrochronological procedures
The tree-ring widths were measured to the nearest 0.01 mm, and were absolute-dated and rechecked using the COFECHA computer program (Holmes, 1983). The standardisation process of the tree-ring widths eliminates their medium- and long-term variability, and emphasises short-term variations. The tree-ring width series standardisation removes the non-climatic (long-term) trends in growth associated with increasing tree age – the major source of non-stationarity in the time series. Accordingly, the series of the annual sensitivity indices (asi) were calculated as follows (Eq. 2.1):
where xi denotes the tree-ring width in year i and xi-1 represents the tree-ring width in the previous year (Fritts, 1976).
Then, the site chronologies were determined on the basis of the tree series. The indexed site chronology revealed the short-term variance due to the variation in climatic factors. For each pine stand, the following indicators were calculated: rbt (mean between-tree series correlation), EPS (expressed population signal), SNR (signal-to-noise ratio), and MS (mean sensitivity). The similarity of the short-term incremental reactions of trees in each pine stand was evaluated by calculating the average between-tree series correlation (rbt). The mean correlation coefficient between all standardised tree-ring series was used for estimating the strength of the chronology signal. It is a statistical quantity representing the common variability in the radial increment of the trees. The mean correlation technique of the indexed series was used for evaluating the chronology signal strength. An advantage of the technique based on correlation versus the analysis of variance (ANOVA) method is that it allows the use of all the indexed series (Briffa and Jones, 1990). The expressed population signal (EPS) facilitates an assessment of the representativeness of the site’s chronology (Wigley et al., 1984; Briffa and Jones, 1990). The EPS index quantifies the degree to which the site tree-ring chronology represents the hypothetical (general) ideal chronology, which may in turn be regarded as the macroclimate signal (Wigley et al., 1984). In turn, the SNR index is an expression of the strength of the observed common signal among the trees (Wigley et al., 1984). The change in the tree-ring width was evaluated using the mean sensitivity (MS). MS is a measure of the inter-annual changes between successive tree-ring widths (Fritts, 1976).
To estimate the dendrochronologically uniform regions for pine, a cluster analysis of the indexed site chronologies (Ward’s method and 1-r Pearson’s distance) was conducted. The variables were 16 series of correlation coefficients calculated between the indexed site chronology and monthly temperature, precipitation, relative humidity, and duration of direct solar radiation from the previous September to the September in the year of the ring formation. A principal component analysis (PCA) was applied to classify the pine populations. The variables considered were 16 indexed site chronologies. A response function analysis (Fritts, 1976; Holmes, 1983) was used to identify the principal components.
The isotope analysis
In this study, we assessed the stability of the relationship between tree-ring cellulose δ13C and δ18O and the climate over the period 1975–2012 for Scots pine. The chronologies were based on a pooled-ring approach, with 10 trees per 3 sites (LAP in the LA region, ZKC in the KK region, and HKF2 in the HK region). The absolute-dated annual tree rings were manually separated as thin slivers, and then pooled (equally weighted per tree) and homogenised. The α-cellulose samples were extracted using Green’s method (1963), with further modifications (Pazdur et al., 2007; Sensuła and Wilczyński, 2017) in the Silesian University of Technology, Poland.
The carbon and oxygen stable isotope compositions were measured by IRMS (Isoprime, GV Instruments, Manchester, UK) in the Institute of Physics, the Silesian University of Technology, Poland. We reported the isotope values in the delta notation as follows (Eq. 2.2):
for carbon (δ13C) and oxygen (δ18O) in respect of the international standard, which was Vienna Pee Dee Belemnite (VPDB) for carbon and Vienna Standard Mean Ocean Water (VSMOW) for oxygen. Rsample and Rstandarddenote the molar fractions of 13C/12C and 18O/16O for the sample and the standard, respectively. The calibration was done using an internal standard (C-3 and C-5, IAEA for δ13C and C-3, IAEA for δ18O).
To test the stability of the climate-isotope relationship over the period 1975–2012, we performed correlation analyses. The analysis of the temporal stability of the climate proxy was based on forward evolutionary intervals (base length: t1 = 26 years) in the bootstrap (Biondi, 1997) correlation function. The start year in this method is fixed. Using the evolutionary intervals gives the possibility to calculate a progressively greater number of years (ti+1 = ti+1) for a correlation-coefficient calculation. To calculate iWUE on the basis of δ13C in plants we used the formula according to Farquhar and Lloyd (1993); McCarroll and Loader (2004), Saurer et al. (2004) and and Silva and Horwath (2013) Eqs. 2.3–2.5:
where ci is intercellular CO2 concentration, ca is ambient CO2 concentration, a (ca. 4.4‰) is the discrimination against 13CO2 during CO2 diffusion through stomata, and b (ca. 27‰) is the discrimination associated with carboxylation.
. Results
Dendrochronology
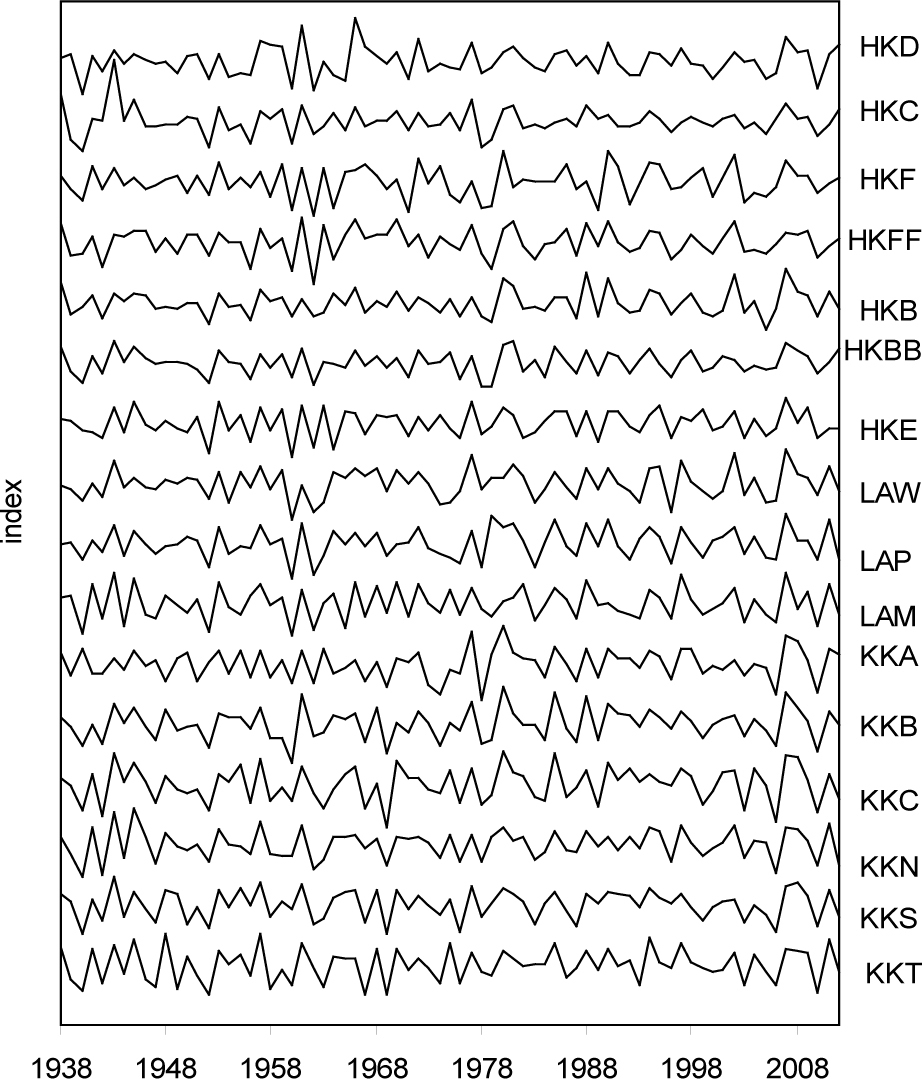
The indexed site chronologies showed a high similarity of year-on-year processes and indicated the strong dynamics of the size of the radial growth of pines in various sites in certain years (Fig. 2).
The rbt indices ranged from 0.399 to 0.521 (Table 2). This indicated the various strengths of the short-term signal in individual chronologies. All EPS values of the site chronologies were greater than 0.85. The EPS and SNR values of the site chronologies indicated a strong climatic signal, which in turn indicated a high representativeness of the indexed site chronologies. The mean sensitivity of all the tree-ring widths of the pine partial populations ranged from 0.158 to 0.308. Therefore, we found that throughout the study period particular pine populations showed strongly differentiated sensitivity to short-term environmental factors. The lowest sensitivity was exhibited by the pines from KK. The variance explained by the first eigenvector of the indexed ring width series was different, and ranged from 36% to 66%, indicating a high homogeneity of growth reactions of the pines in most sites (Table 2).
Table 2
The statistics of 16 tree-ring-site collections for the period 1951–2012 (MS: mean sensitivity, rbt: mean between-tree series correlation, EPS: expressed population signal, SNR: signal-to-noise ratio, Var.PC1: variance in the first component).
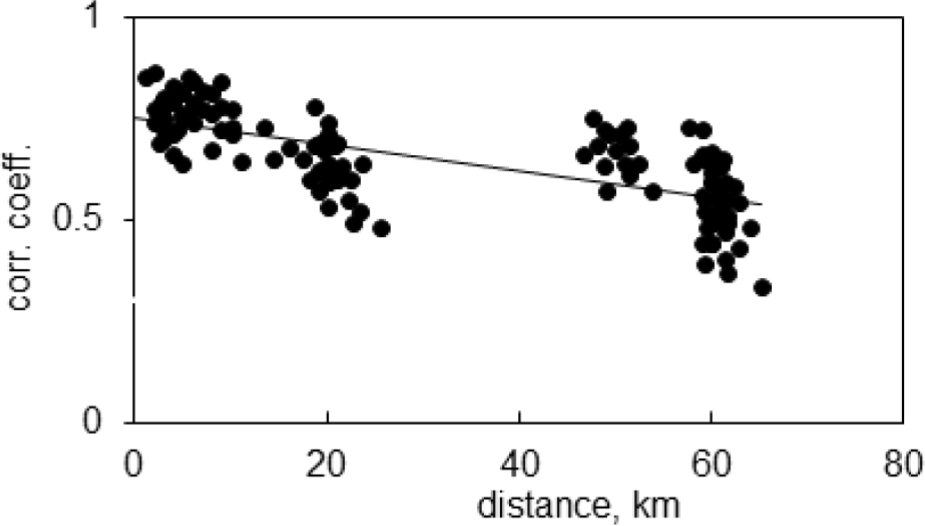
The indexed site chronologies were correlated with each other within a common period from 1951 to 2012. The similarity between site chronologies decreased with distance, and was high within each of the considered regions; further, it was often high between sites from various regions (Fig. 3). This grouping exhibited the regional locations of the pine sites and suggested a division of the tested area into three dendrochronologically similar regions: KK, LA, and the nearby HK. In all cases, the correlation was significant (p < 0.01).
Fig. 3
The correlation coefficients between the indexed site chronologies and the distance between pine sites.
To identify the reaches of the dendrochronologically uniform regions more clearly, a PCA was used. The first component (PC1) accounted for 65% of the variance among the site chronologies. All the indexed site chronologies correlated highly with PC1 (Fig. 5). Since 17 pine chronologies were clustered tightly with PC1, a high common variance between all the pine populations was obtained. The second component (PC2) accounted for 12% of the variance among pine chronologies. PC2 divided the pine populations into three regional groups (Fig. 4).
Fig. 4
The results of the cluster analysis of 16 correlation-coefficient series (left) calculated between the indexed site chronologies and 26 climatic parameters (see Fig. 5) and the location of 16 indexed site chronologies to the loadings of the first and second components (right).
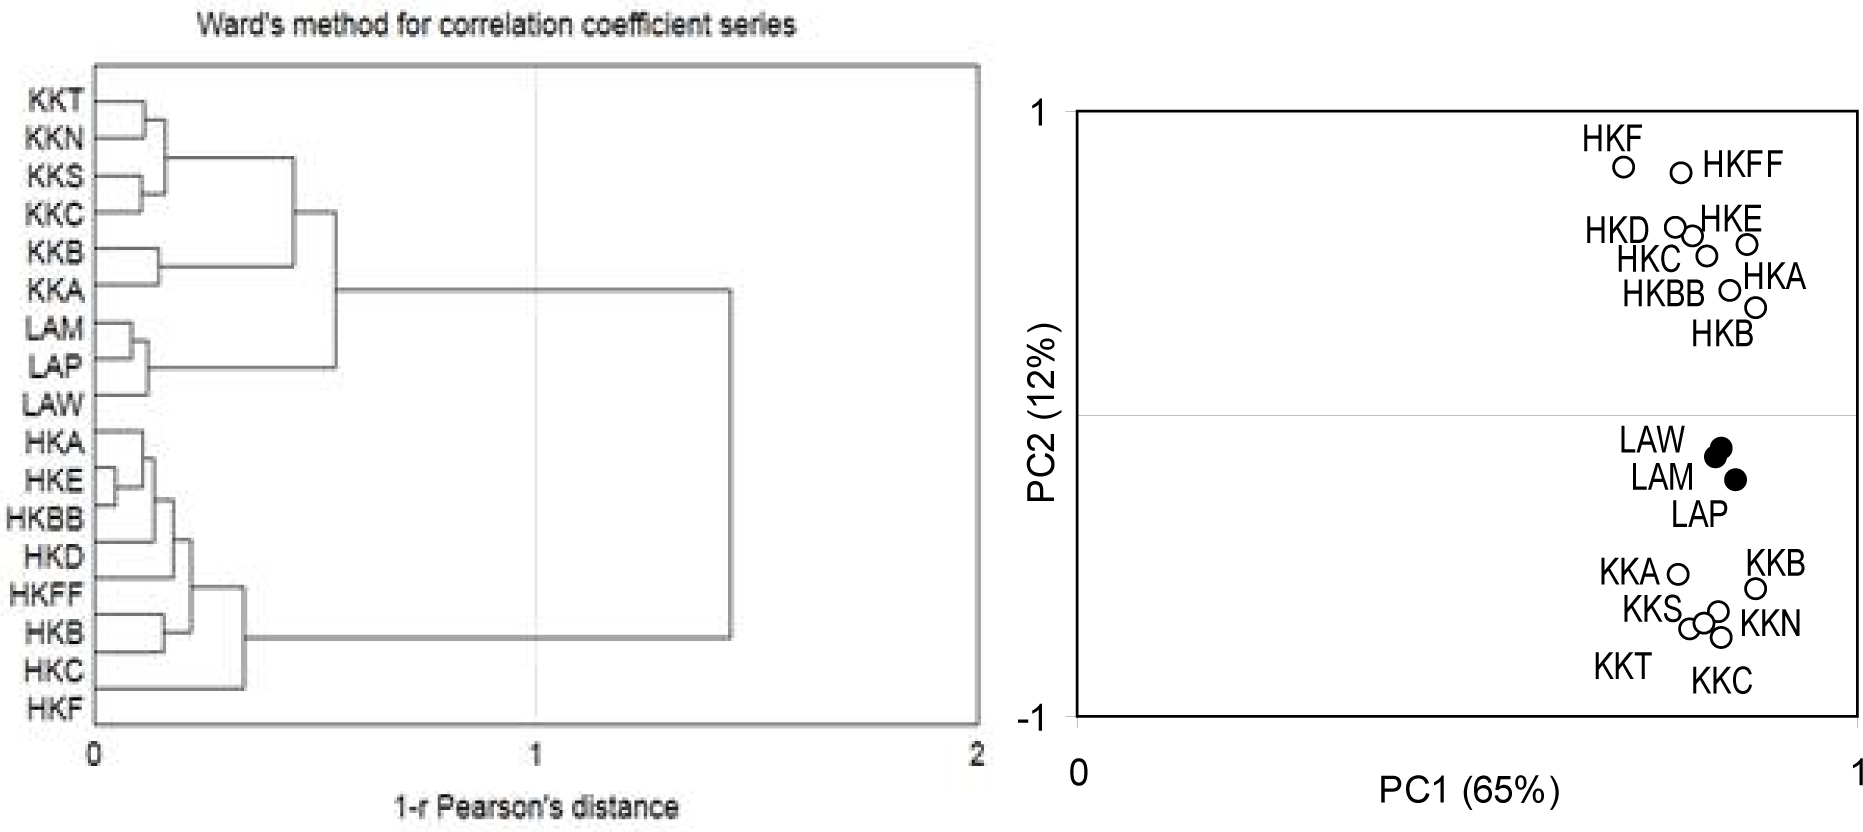
Fig. 5
The correlation coefficients calculated between the indexed site chronologies and site monthly values of temperature, precipitation, relative humidity, and sunshine duration (correlation-coefficient series) from the previous September (SEP) to current September (Sep).
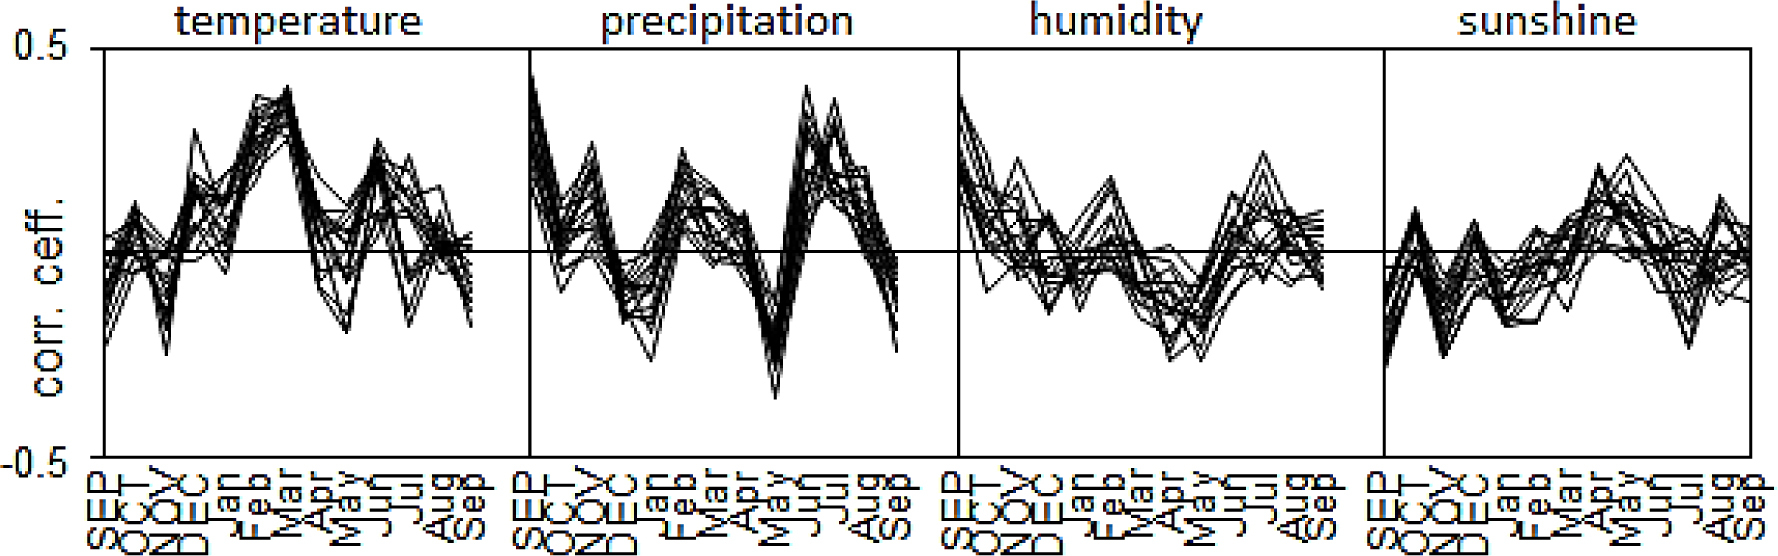
We assumed that any characteristic incremental rhythm of pines in each region would be shaped by climatic factors. To test this, we correlated the indexed site chronologies with the climatic parameters. Thus, we obtained a series of correlation coefficients for each pine population (Fig. 5). The cluster analysis divided the correlation coefficient series into three identical groups, the same as in the case of the analysis of the indexed site chronologies (Fig. 4). The first cluster included the pine populations from the KK region, the second had pines from LA, and the third consisted of populations from HK (Fig. 4). Therefore, the incremental rhythm of pines differentiated the climatic factors and the question remains as to which elements of the climate determined this differentiation. Therefore, a PCA of the indexed site chronologies was conducted.
The variability of climate conditions from year to year mainly determined the short-term variance of the radial increment of the trees. The first two components described the climate elements which had a significant impact (77%) on the radial-growth variability of the pines. The climate factors described by PC1 and PC2 were identified by a correlation-function analysis (Fig. 6). PC1 integrated the pine chronologies and correlated (p < 0.05) with the monthly relative humidity, precipitation, and sunshine duration of the previous September.
Fig. 6
Significant correlation coefficients (at the 95% level) calculated between PC1, and PC2 and monthly values of temperature, precipitation, relative humidity, and sunshine duration from the previous September (SEP) to the current September (Sep).
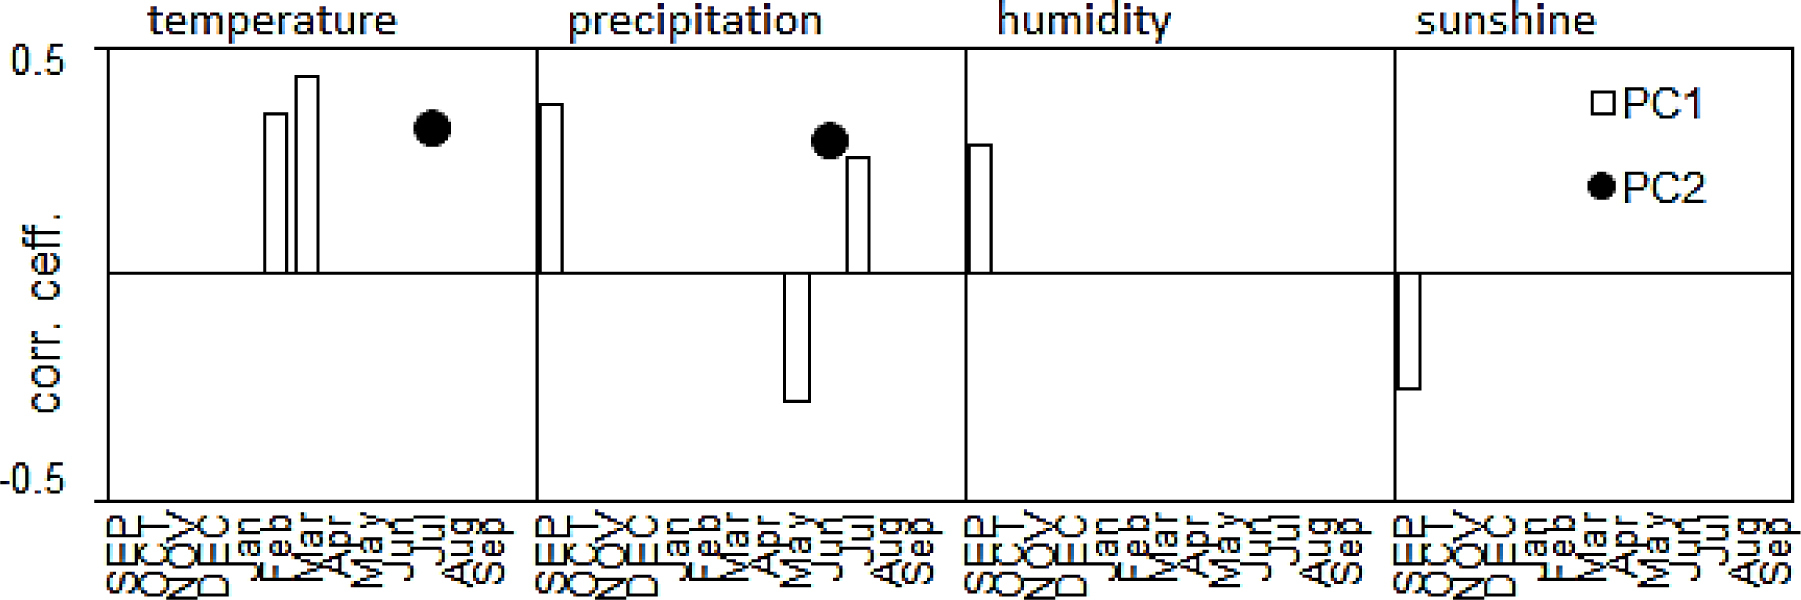
The first component also correlated with the February and March temperatures and the May and July precipitation values of the year of the ring formation. The climatic factors described by PC1 had a similar and significant impact on the radial growth of all Scots-pine populations. PC2 differentiated the indexed site chronologies and correlated significantly with the monthly precipitation of June and the July temperatures (Fig. 6). The pines in each region reacted differently to these two factors. Scots pine from HK was more sensitive to low temperatures in July and low precipitation in June in the year of the ring formation.
General trends in δ13C and δ18O
The pattern of the spatial and temporal variability of δ13C and δ 18O in the samples extracted from the annual tree rings of pines growing in the three regions, namely LA, HK, and KK, is illustrated in Fig. 7.
Fig. 7
Trends of δ13C (measured value: HK, KK, LA and corrected values: HKc, KKc, LAc) and δ18O in α-cellulose samples extracted from pines growing in three forests in HK, KK, and LA.
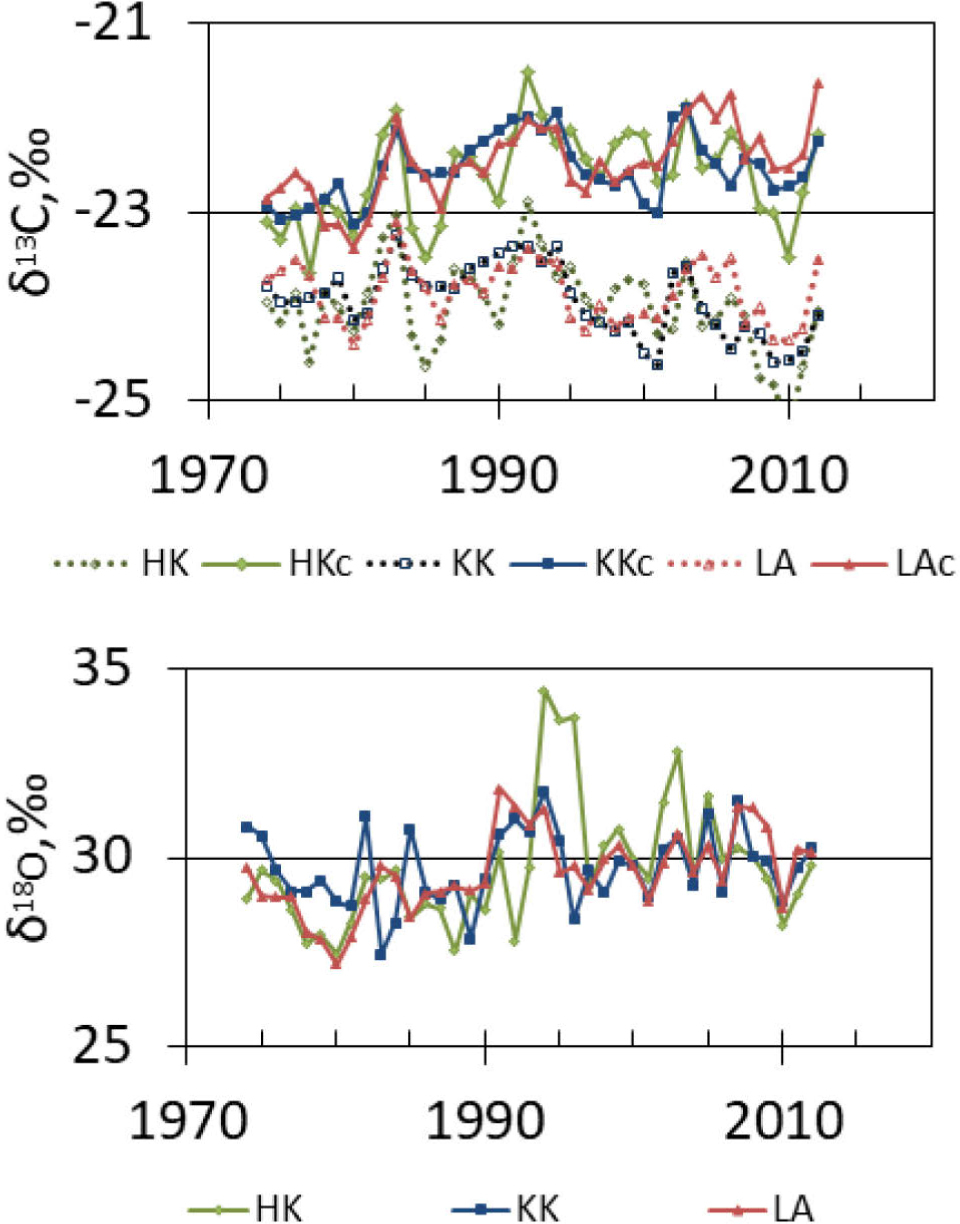
The average value of pine δ13C in each sampling site was approximately 23.9‰, whereas the average value of pine δ18O in each sampling site was approximately 29.7‰. However, different trends in δ13C and δ18O were observed in each sampling site. The typical decline in δ13C due to the global atmospheric trend could be observed after 1990. It is possible that the typical decline in δ13C prior 1990s might have been masked by another factor, or factors. In KK, the pine δ13C series data ranged from –24.6‰ to –23.2‰ (uncorrected) and from –23.1‰ to –21.9‰ (corrected); in LA, the pine δ13C series data ranged from –24.4‰ to –23.1‰ (uncorrected) and from –23.4‰ to –21.6‰ (corrected); and in HK, the pine δ13C series data ranged from –25.3‰ to –22.9‰ (uncorrected) and from –23.6‰ to –21.5‰ (corrected). The mathematical correction for the atmospheric δ13C trend to remove the effect of the changes in δ13C was carried out using a dataset of high-frequency measurements (McCarroll and Loader, 2004; McCarroll et at., 2009; NOAA). This correction considered the CO2 contribution by fossil fuels to the European air. This correction increased the range of δ13C and reduced the decline observed in the previous decades (Rinne et at., 2010). Further, the δ13C and δ18O values of the α-cellulose samples extracted from the pine trees growing in the three forests show a significant correlation between them (n = 39), which confirms the similarity in the trees’ response to the changes in the ecosystem (Table 3). However, in the case of the HK and KK series, the correlation between the δ18O values in the two chronologies was the lowest, but it was still at a significant level. Since the late 1990s, a close accordance between all the three oxygen-isotopic chronologies was observed (Fig. 7).
Table 3
The correlations between the values of δ13C for three forests and the correlations between the values of δ18O for three forests: Dąbrowa Górnicza near Huta Katowice (HK), Kędzierzyn-Kożle (KK), and Łaziska (LA) (all values are significant at p < 0.05).
| δ13C | site | HK | KK | LA |
| HK | - | 0.61 | 0.56 | |
| KK | 0.61 | - | 0.66 | |
| LA | 0.56 | 0.66 | - | |
| δ18O | site | HK | KK | LA |
| HK | - | 0.34 | 0.51 | |
| KK | 0.34 | - | 0.52 | |
| LA | 0.51 | 0.52 | - | |
The correlation of the δ13C and δ18O series
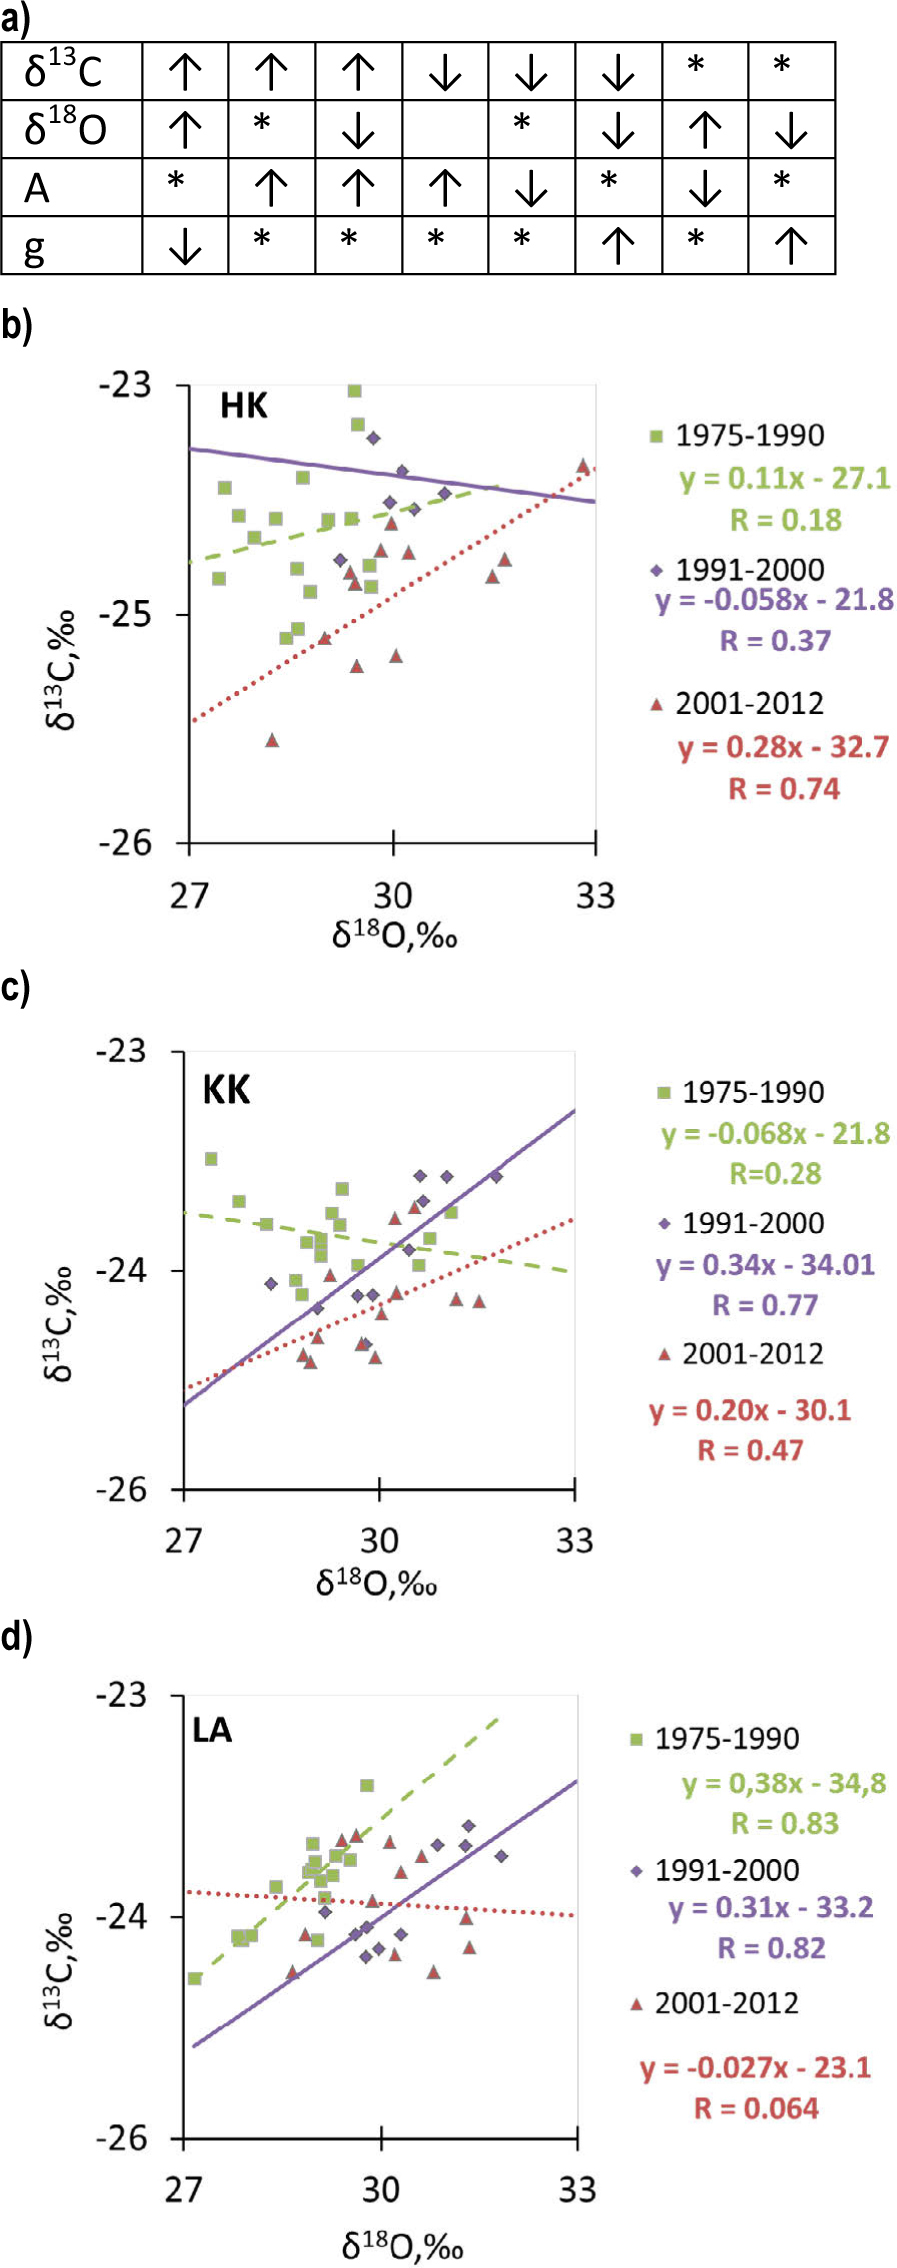
In certain periods, a significant positive correlation between δ13C and δ18O was found, whereas in other time periods, this correlation was not significant (Fig. 8b–8d). With the KK pine, the highest significant positive correlation (r = 0.77) was found for the period 1991–2000. In contrast, in LA, the highest significant positive correlation was found for two periods of time: 1975–1990 (r = 0.83) and 1991–2000 (r = 0.82). However, in the case of the HK series, a significant positive correlation (r = 0.74) was found for the period 2001–2012, whereas no significant correlation was found in KK for the period 1975–1990 (r = 0.28) and 2001–2012 (r = 0.47), in LA for the period 2001–2012 (r = 0.064), in HK for two periods of time: 1975–1990 (r = 0.18) and 1991–2000 (r = 0.37), respectively. According to Scheidegger et al. (2000), the combined analyses of carbon and oxygen isotopes in tree rings can suggest whether stomatal conductance or photosynthesis (Fig. 8a) contribute the most to the variation of iWUE in response to elevated CO2 levels (Saurer et al., 2004).
Fig. 8
(a) Theoretical scenarios (Scheidegger et al., 2000) for the interaction between the stomatal conductance (g) and photosynthesis (A) and isotope composition of plants; (up- or downward arrows represent increasing or decreasing values, *indicates insignificant changes) and (b) a comparison of the δ13C and δ18O series for the investigated sites: (b) HK, (c) KK, and (d) LA for three periods of time: since 1957–1990 prior to significant modernisation in the factories, since 1991–2000, when was a significant modernisation in the factories; since 2001 – the period when the pro-ecological strategy was implemented in each factory due to changes in the Polish law.
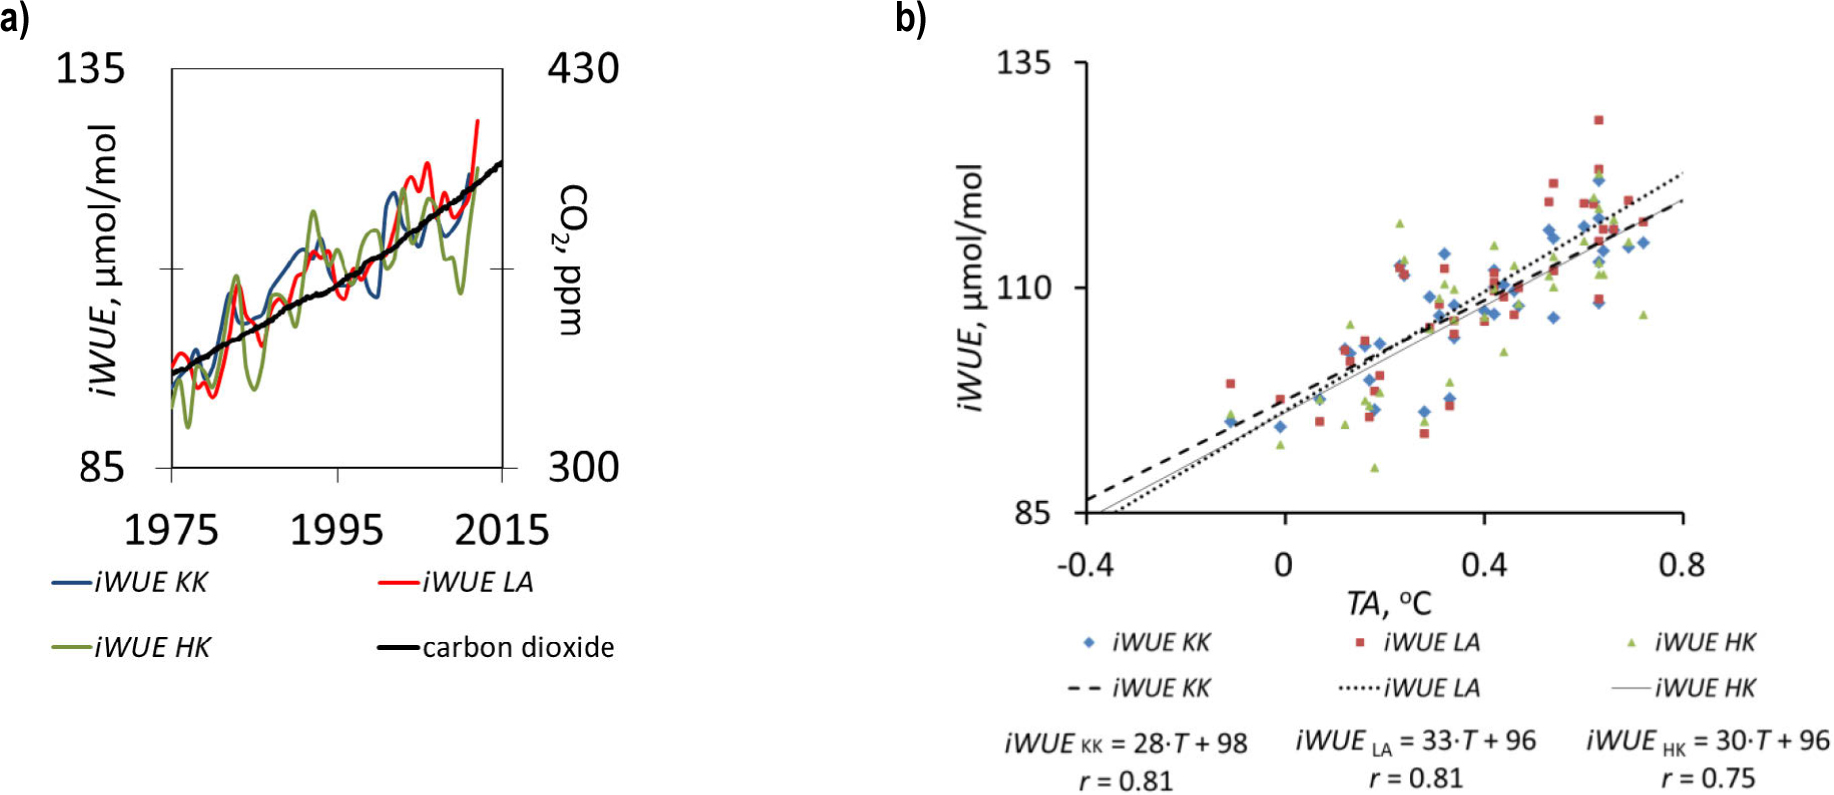
Across all the sites, elevated anthropogenic carbon-dioxide emission increased the 13C-derived water-use efficiency on average by 40% (Fig. 9). Further, a positive land-surface temperature anomaly-iWUE relationship was observed. The elevated CO2 increased the iWUE of the forests (Fig. 9).
Fig. 9
(a) Increased intrinsic water-use efficiency (iWUE) in pines during increases in CO2 emissions into the atmosphere (in the period from 1975 to 2012), (b) the correlations between intrinsic water-use efficiency (iWUE) and a land surface temperature anomaly (TA) (the deviation from the long-term average, NOAA).
The climate-carbon and oxygen-stable isotope composition relationships
The resulting isotopic chronologies were correlated against meteorological parameters from the nearest meteorological station in Opole (for KK) and in Katowice (for LA and HK) (Fig. 10). The presented analyses indicate the parameters (annual climatic factors) with which the isotopic composition of pine achieved the highest correlation (at the 95% significance level) (Fig. 10a). It describes how climate factors impact on the isotopic composition of trees. In times of relatively high annual temperature and increased insolation, δ13C increases, whereas a relatively high amount of precipitation and an increase in humidity decrease the δ13C in the trees.
Fig. 10
The correlation coefficients between δ13Cc (corrected values) and δ18O in α-cellulose samples from three forests in HK, KK, and LA, and (a) annual climatic factors: mean temperature (T), sum of precipitation (P), sunshine (S), and relative humidity (H) from previous year (p) and current year and (b) monthly climatic factors: mean temperature, sum of preciptation, sunshine, and relative humidity; significance level = 95%.
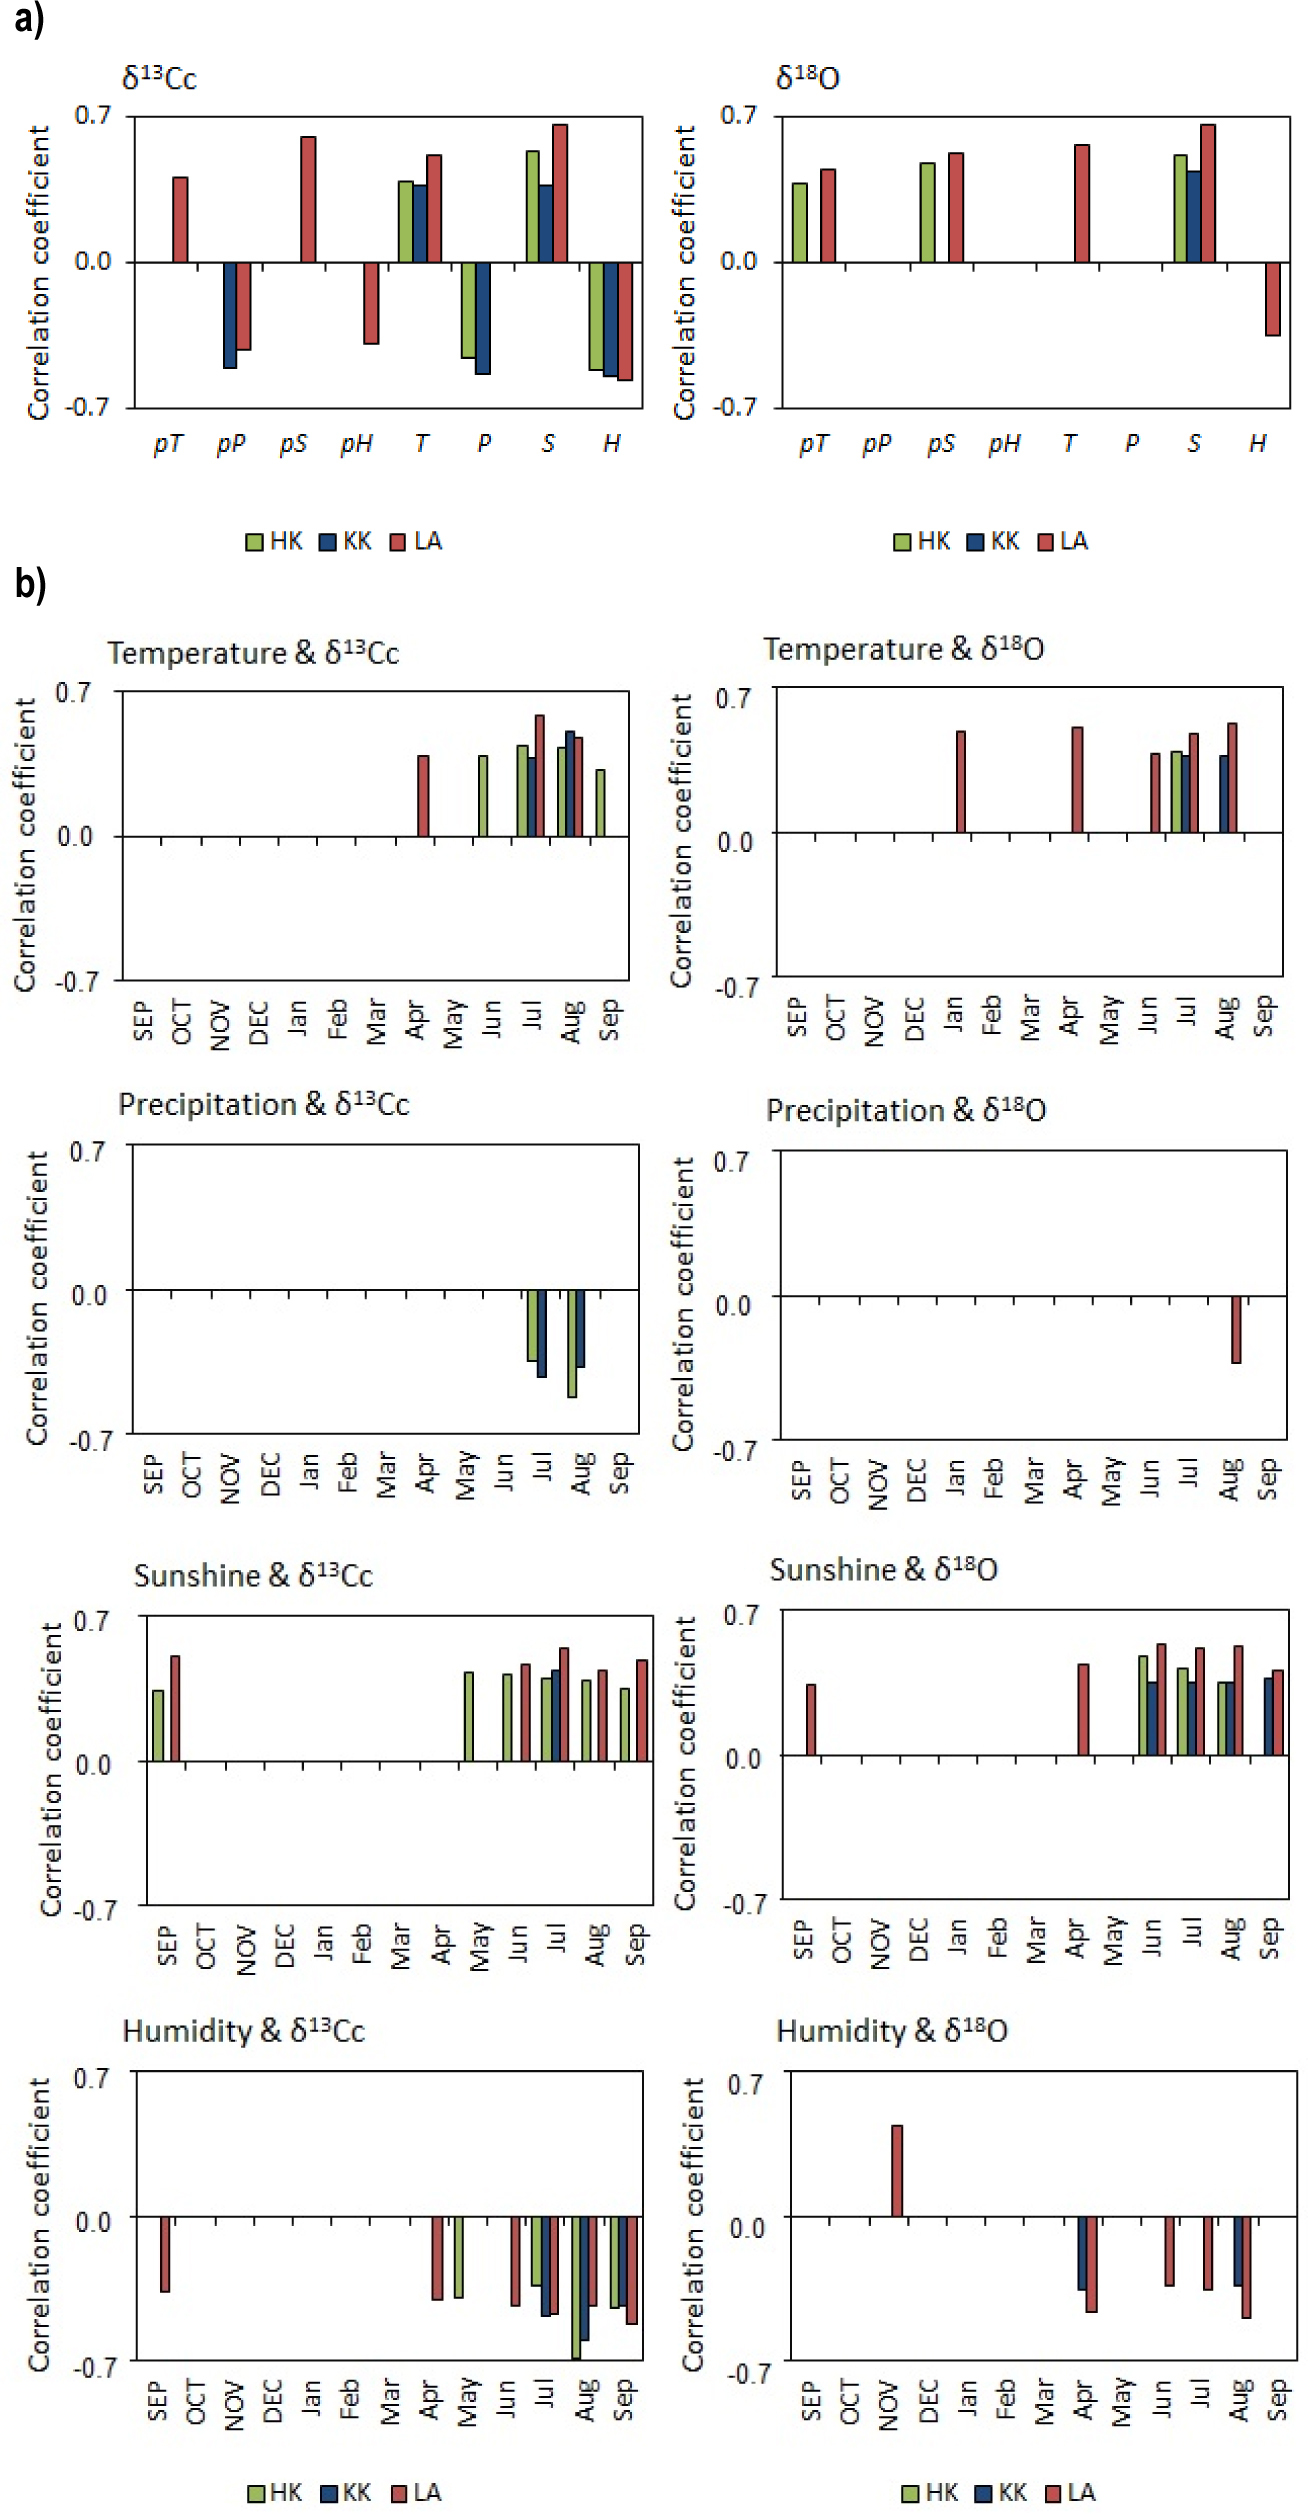
In the case of δ13C, the chronologies from each site (Fig. 10b) were positively correlated with the mean temperature and sunshine in summer, and negatively correlated with the humidity in spring and summer. An analysis revealed some significant similarities in the relationships between climatic factors (such as the temperatures in July and August; sunshine in July; and humidity in April, July, August, and September), and the carbon isotopic composition of the pines growing in each investigated area. These implied that the response of trees to changes in climatic parameters can only be recorded in some months in line with the variations in the isotopic composition of the pines growing, whereas the isotopic response to changes in weather conditions in other months can be varied.
On the other hand, the pines growing in the KK region differed in their isotopic response to humidity. A relationship between humidity and the carbon isotopic composition revealed a high correlation in spring and summer, and the influence of the humidity of the previous year could be noted. Further, the response of the pines to precipitation was different in different sites; however, some similarities were observed for the pines growing in the HK and KK regions, whereas a relatively high insolation increases δ18O. The pines growing in LA showed the highest correlations and the strongest climate-oxygen isotopic composition of pine.
In the case of δ18O, the values in the chronologies from each site (Fig. 10b) were positively correlated with the sunshine during the entire vegetation period and the temperature in July. A strong and significant negative correlation was observed between humidity and the oxygen isotopes only in the pines growing in KK and LA. Only the pines growing in LA showed a negative significant correlation with the precipitation in August.
The stability of the climate-isotope relationship
To test the stability of the climate-isotope relationship over the period 1975–2012, we performed correlation analyses, and Fig. 11 presents the significant correlation coefficients for the studied months (the previous September to the current September) as a function of the investigated evolutionary intervals – a progressively greater number of years is used for correlation-coefficient calculation (X axis). The start year in this method is fixed, and only the end year of the interval is presented on the X axis. For the δ13C and δ18O pines, the correlations with temperature were consistently positive for the current growing-season temperatures (mainly April, June, July, and August) (Fig. 11). Further, the temperature in January was important for determining the δ13C and δ18O signals, but these correlations were temporally unstable and weak.
Fig. 11
Forward evolutionary interval correlations (bootstrap correlation function) between monthly climate factors (temperature, precipitation, duration of sunshine, humidity) and carbon (a) and oxygen (b) the stable isotopic composition of tree-ring cellulose for the period 1975–2012, for the September of the previous year to the September of the current year, using a base length of 26 (plotted against the last year of the period); significance level = 95%.
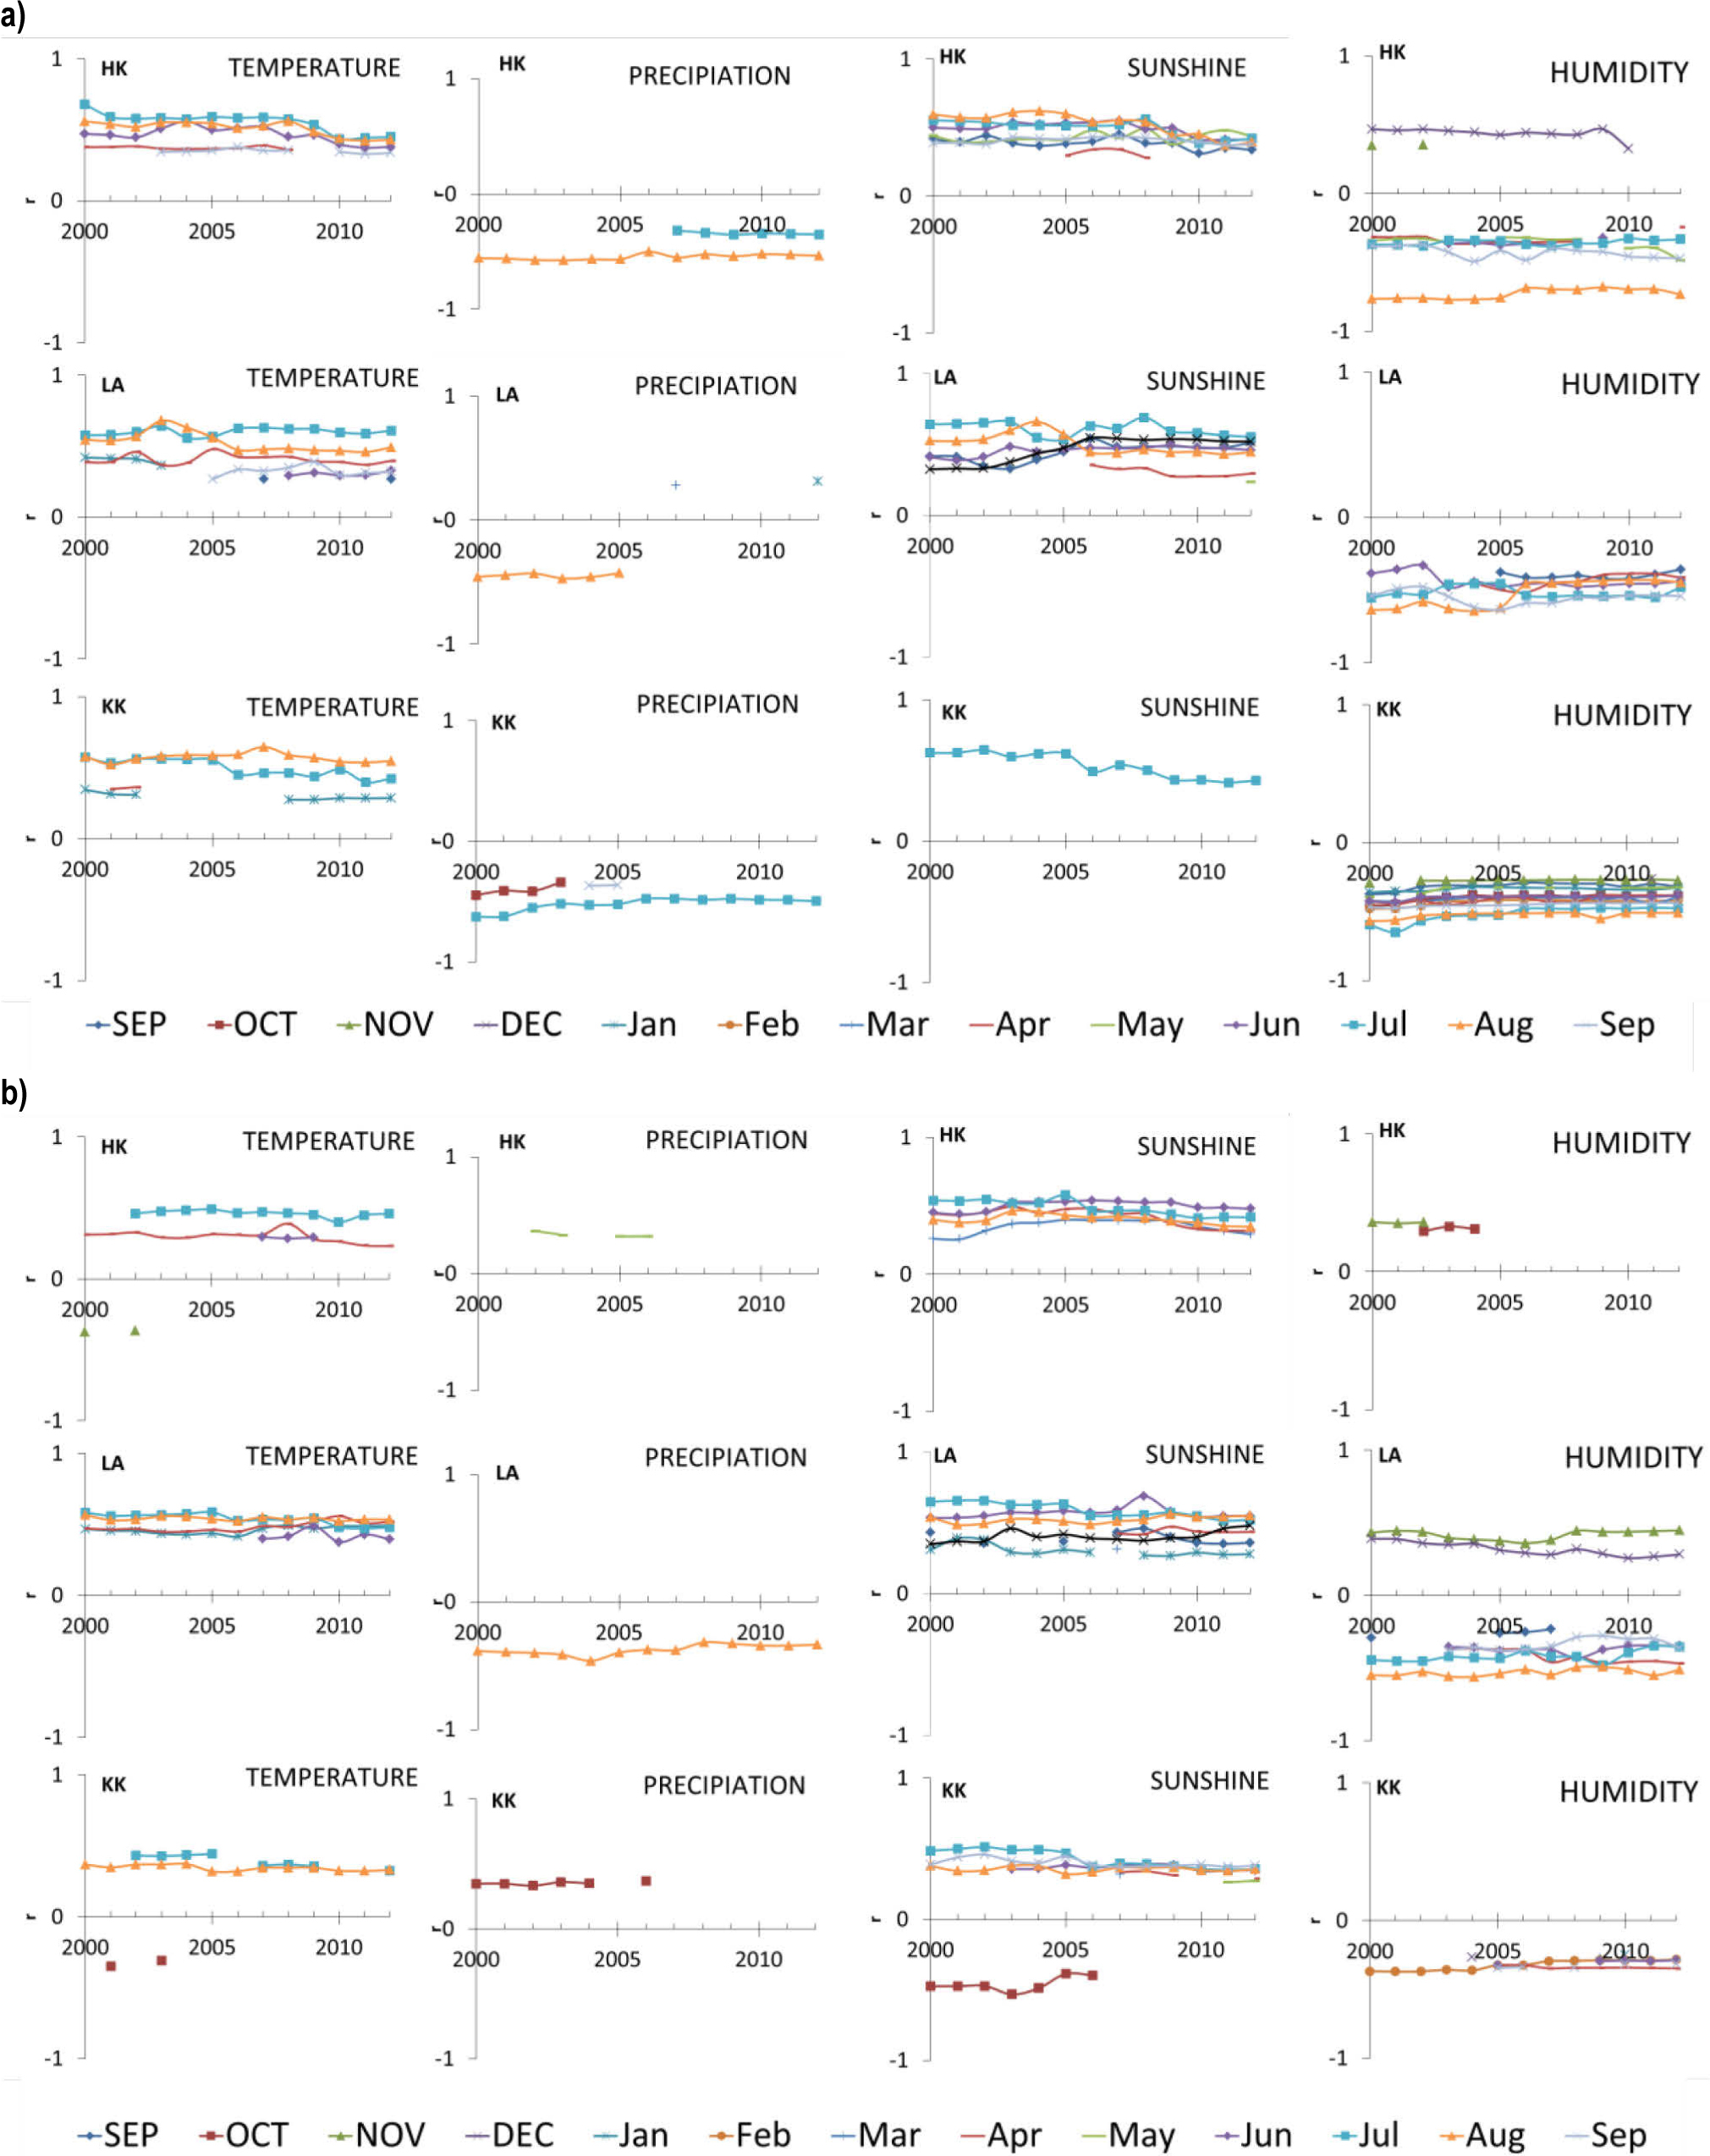
For the δ13C pines, correlations with the precipitation amount were negative for summer (July or August). For the pines growing in LA, the correlations with precipitation were temporally unstable. The δ18O correlations with precipitation were temporally unstable in KK and HK, whereas in LA the negative correlation with precipitation in August was strong and stable. Correlations between sunshine and both isotopes were mostly positive for the growing-season sunshine. In general, for δ13C, sunshine in July was significant for determining the δ13C signal for all the three relationships studied, and sunshine in summer (June-September) was important for determining the δ13C signal in LA and HK. For δ18O, sunshine in summer (June-September) was important for determining the δ18O signal in all the investigated sites. In contrast, for pines growing in LA and HK a strong significant correlation was observed with the sunshine spread over much of a given year. The significant correlations of δ13C with humidity were predominantly negative for the summer months (June-September) in all the investigated sites. The sign of the correlation in December changed from negative (in LA and KK) to positive (in HK). The most consistent significant correlations with humidity determined the δ13C signal in pines growing in LA and HK. For δ18O pines, the correlations with humidity were unstable in HK and KK, whereas in LA, the correlation was stronger and more stable. The significant correlations of δ18O with humidity were positive for the months of the previous year (November-December) and negative for the months of the current year (June-September). Relationships between climate and the isotopic composition exhibited spatiotemporal diversity. A combination of parameters can impact on the isotopic composition of pine (Leegood and Edwards, 1996; McCarroll and Loader 2004; Sensuła and Wilczyński, 2017).
. Discussion
The climate-tree-ring width relationship
The similarity of the incremental reactions (year-on-year) of pines from various sites was relatively high. Therefore, a supra-regional factor was determined. We assumed that this was a climate factor. The answer was provided to us by the PCA carried out later in this study.
The mean correlation coefficient, expressed population signal, signal-to-noise ratio, and variance in the first component calculated for each pine population, indicated a strong climatic signal in the indexed site chronologies. The mean sensitivity implied a strongly differentiated susceptibility to short-term environmental factors. One such factor that changed from year to year was climatic conditions. The variance explained by the first eigenvector indicated a high similarity of the radial growth reactions of the pines.
The greatest distance between the pine sites was 66 km. The conifer chronologies in North America correlated at the 99% level over a distance of 1000 km (Cropper and Fritts, 1982), and in Spain over a distance of 500 km (Richter et al., 1991). In Poland, sufficient cross-dating quality between Douglas fir chronologies could be expected within an average range of about 800 km (Feliksik and Wilczyński, 2004).
The variability of climate conditions from year to year determined the short-term variance of the radial increment of trees. The first two components described the climate elements which had a significant impact on the radial growth variability of pines. The climatic factors as described by PC1 had a similar and significant impact on the radial growth of all Scots-pine populations. PC2 differentiated pine sites. The pines in each region reacted differently to factors described by the second component.
Our results implied that high July precipitation and high winter temperatures were beneficial to the radial growth of the pines. Under drought stress in the vegetation season, the trees had relatively low cambial activity, thereby reducing the cambial division and cell-wall thickening (Irvine et al., 1998; Cinnirella et al., 2002; Piovesan et al., 2008).
However, low precipitation in May had a positive impact on the radial growth of the pines. Low precipitation indicates low cloudiness which does not limit solar radiation. Therefore, we concluded that solar radiation could stimulate cambium activity.
The temperature in winter was the main limiting factor for the activity of pines. In late winter and early spring, a relatively high air temperature initiated physiological and biochemical processes faster, and caused vascular cambium activation earlier (Gricar et al., 2006; Rossi et al., 2008; Balanzategui et al., 2017). In cold regions, the tree-ring growth of trees was mainly limited by the summer temperature (Lindholm et al., 2000; Helama et al., 2002, 2005; Macias et al., 2004; Wilczyński and Szymański, 2015).
We have observed that a wet and cloudy previous September had a positive impact on the radial increment of pines in all sites. Such weather conditions are favourable for the carbohydrate accumulation by trees used in the next year to build wood cells (Hoch et al., 2003; Vaganov et al., 2006).
Different effects on the growth of the pine trees from individual regions (KK, LA, and HK) were observed in the cases of the precipitation in June and the July temperature. Scots pine from HK was more sensitive to a low temperature in July and a low precipitation in June in the year of the ring formation. This could be attributed to the cooler and drier climate in this region.
The climate-isotope composition relationship
The correlation analysis yielded mostly expected results. Positive relationships with temperature and sunshine, and negative relationships with precipitation and humidity, were observed for δ13C. In contrast, a positive relationship with temperature and a negative relationship with humidity were observed for δ18O. However, it has been noted that the correlations showed certain temporal instability differently in each of the investigated sites. The current growing-season climate (from April to September) dominated the δ13C and δ18O signals, despite the significant relationships found for several months from the previous year. As far as δ18O is concerned, there might be a depth-dependent temporal offset resulting from an effective uptake of the soil water by the roots (Saurer et al., 1997b). The isotope-climate relationships can also be affected by a change in the relationship between the climate variables (Edwards et al., 2000).
The isotopic composition of pines growing in LA has been the most sensitive to climate changes, and the chronologies for both elements reflect the largest number of climatic parameters.
The differences in the relationship between climate and the carbon and oxygen stable isotope composition of the trees growing in different areas can be attributed to the effect of the masking of the climatic signal by pollution (Leonelli et al., 2012; Boettger et al., 2014).
The climate-isotope composition of tree-ring cellulose relationships is not stable over time. The previous analysis shows that from 1950 to 2000, the correlation coefficients between δ13C and the climate factors in the Niepolomice Forest (Poland) were not stable over the entire studied period (Sensuła et al., 2011). Several studies have also shown changes in the trees’ response to the climate forces in recent decades, such as reduced sensitivity to a certain climatic factor and increased sensitivity to another; for example Boettger et al., (2014) analysed the climate sensitivity of carbon isotope signatures in tree-ring cellulose in Germany, and reported a reduction in the climate sensitivity of δ13C. Several tree-ring studies have also concluded that the intrinsic WUE of trees can be also associated with anthropogenic effects, such as, industrial factories, vehicles, and low stack emission of CO2 (Waterhouse et al., 2004; Saurer et al., 2014). An elevated CO2 level significantly decreases the δ13C in the air (Keeling et al., 1996). Across all the sites, elevated CO2 levels increased the 13C-derived iWUE, and a positive land-surface temperature anomaly-iWUE relationship was observed. According to NASA, land surface temperature differs from air temperature because land heats and cools more quickly than air. The most recent literature on this topic (for example, Stips et al., 2016) confirms that the greenhouse gases are the main drivers of the changing global surface-air temperature (NASA). In our study, it has been observed that elevated CO2 levels increase the intrinsic WUE of forests, but the magnitude of this effect and its interaction with climate are still poorly understood. In the investigated forests, the pine trees in each population show different sensitivities to weather conditions. The detailed relationship between the isotope time series and the biosphere-contamination records will be the subject of a further publication.
. Conclusions
This study revealed that the Scots-pine populations did not show radial-growth differences within the same climatic microregion, and could be considered dendrochronologically homogeneous. The delineation of three dendrochronologically homogeneous regions was important for the dendroclimatological work. The similarity of the short-term signal in the tree-ring width decreased with the distance between regions, but was often high between sites from various regions. Therefore, the geographical criterion did not sufficiently explain the grouping of the pine populations.
The long and frosty winters had a negative impact on the radial growth of the pines in all the regions. Pine trees were also sensitive to a shortage of rainfall during July, the period of intense vascular-cambium division. However, Scots pine also demonstrated characteristic sensitivity to the climatic conditions of the region in which it grew. The specific impact on the radial growth of the pines depended on the pluvial condition in June, and the thermal condition in July, in each of the three regions.
The present investigation also showed differences in the relationship between climate and the stable isotopic composition of pine populations growing in the same climatic microregion. The importance of the current growing-season climate was revealed, and the impact of the other months was detected. The signals of climate changes recorded in the stable isotope composition of tree-ring cellulose was not stable over time. Relationships between δ13C and temperature were positive and between δ13C and sunshine positive, whereas relationships between δ13C and precipitation were negative and between δ13C and humidity negative. The relationship between δ18O and temperature was positive, and between δ18O and humidity negative. These relationships were expected in the light of the theoretical backgrounds. However, the correlations showed some variations between the investigated sites. The effect of the climatic isotope signals in the tree rings can be masked by the biosphere contamination.