
. Introduction
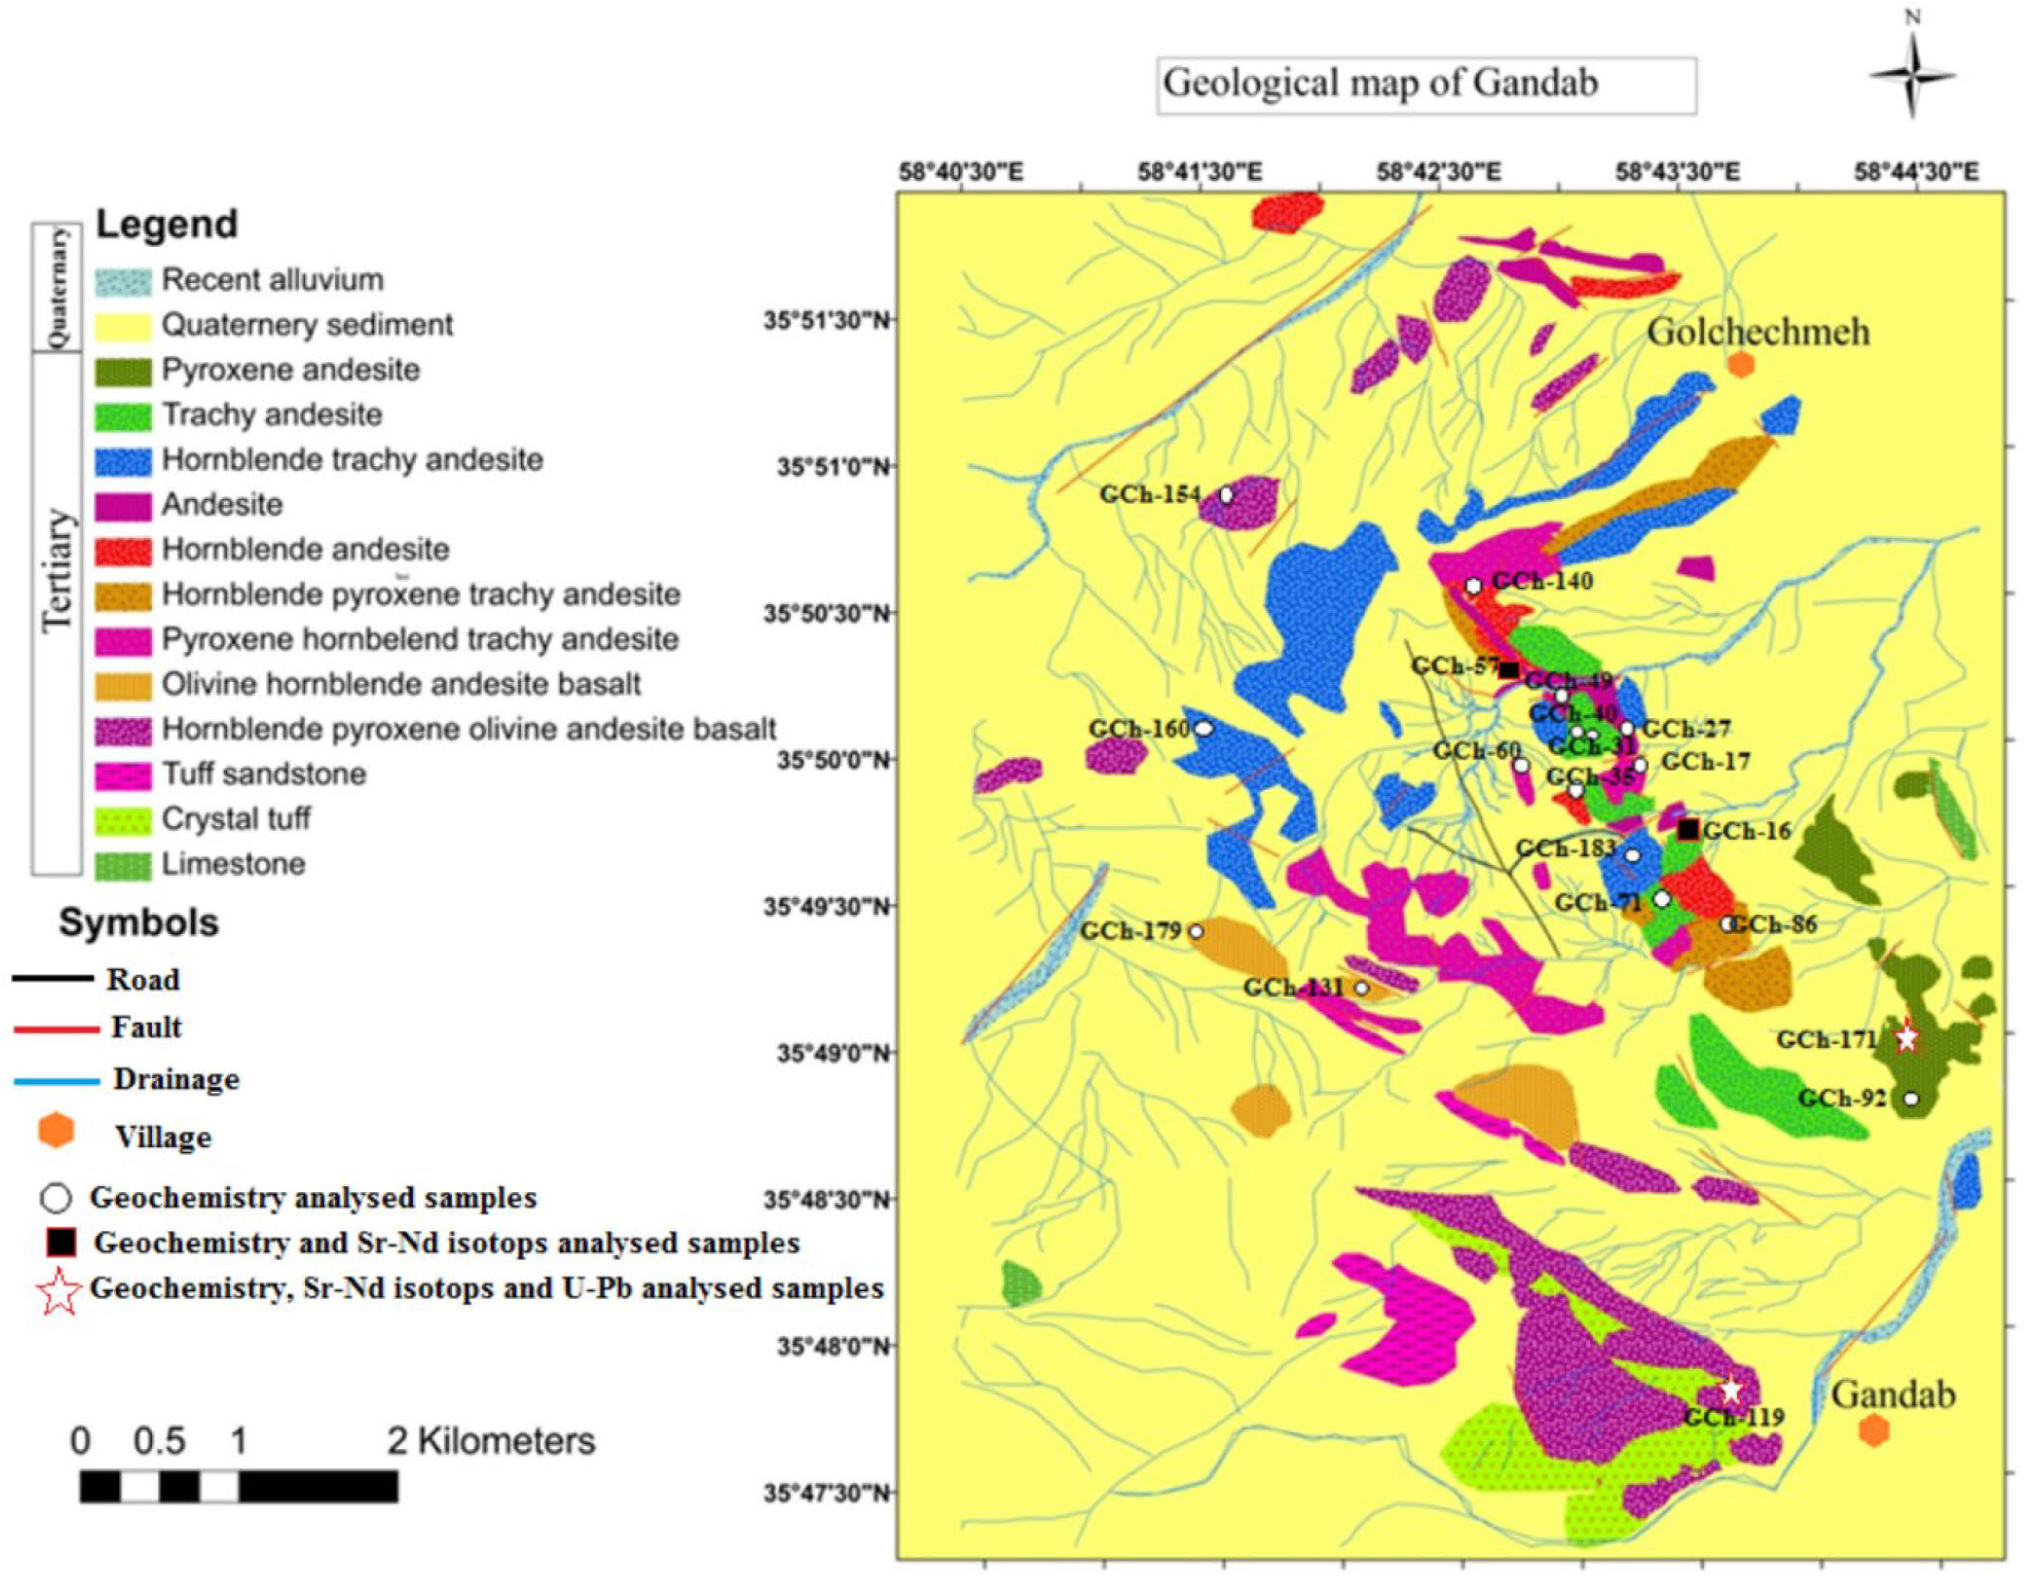
According to limited geochronology data, magmatic activity in the eastern Iran started in the late Jurassic (Esmaiely et al., 2005; Tarkian et al., 1983) and continued into the Quaternary, forming a variety of volcanic and volcanoclastic rocks, as well as subvolcanic stocks (Saadat and Stern, 2016). The volcanic rocks in Iran are mainly classified into three geographical categories as follows: a belt extended from Maku area to Bazman zone, the Alborz Mountains, and east territories of Iran (Pazirandeh, 1973). The volcanic rocks in Iran have average andesitic composite but other types of the volcanic rocks such as rhyolite, dacite, trachyte, basalt, are also seen (Pazirandeh, 1973). This paper presents a constructive set of new U-Pb geochronology data combined with Sr-Nd isotope and geochemical data for sample of volcanic rocks from the Gandab area in northeastern Iran, and an analysis of the tectonic factors involved in their petrogenesis. It is a contribution to the understanding of magmatic activity in this part of the Alpine-Himalayan collision belt. The study area is located at 220 km southwest of the Mashhad (capital of the Razavi Khorasan Province in northeast of Iran) and 80 km south of the Neyshabour (a city in the Razavi Khorasan Province). This district is positioned from 58° 42′ 15″ to 58° 43′ 40″ east longitude and 35° 47′ 30″ to 35° 52′ 00″ north latitudes, covering 48 km2 (Fig. 2).
. Geological setting
The Iranian plateau surrounded between the Arabian plate to the southwest, the Eurasia plate to the northeast, the Indian oceanic plate to the south, and the Helmand/Afghanistan block to the east (Saadat et al., 2010). The collision between Arabian plate and central Iran began sometime between the end of the Eocene and before the Miocene (e.g. Berberian and King, 1981; Hatzfeld and Molnar, 2010). An expanded regime between central Iran and southern margin of Eurasia was created in Early Cretaceous period and it formed Neo-Tethys Ocean (Shafii Moghadam et al., 2014) and narrow branch of this Neo-Tethys is known as Sabzevar Ocean (Sengor, 1990; Shafii Moghadam et al., 2014). In Late Cretaceous until Tertiary, the subduction of the oceanic crust beneath East Alborz belt caused the development of a magmatic arc (Spies et al., 1983; Shafii Moghadam et al., 2014). Tertiary intrusive and volcanic rocks of Sabzevar zone have the characteristics of the calc-alkaline magmas. Furthermore, there are alkaline rocks in this zone.
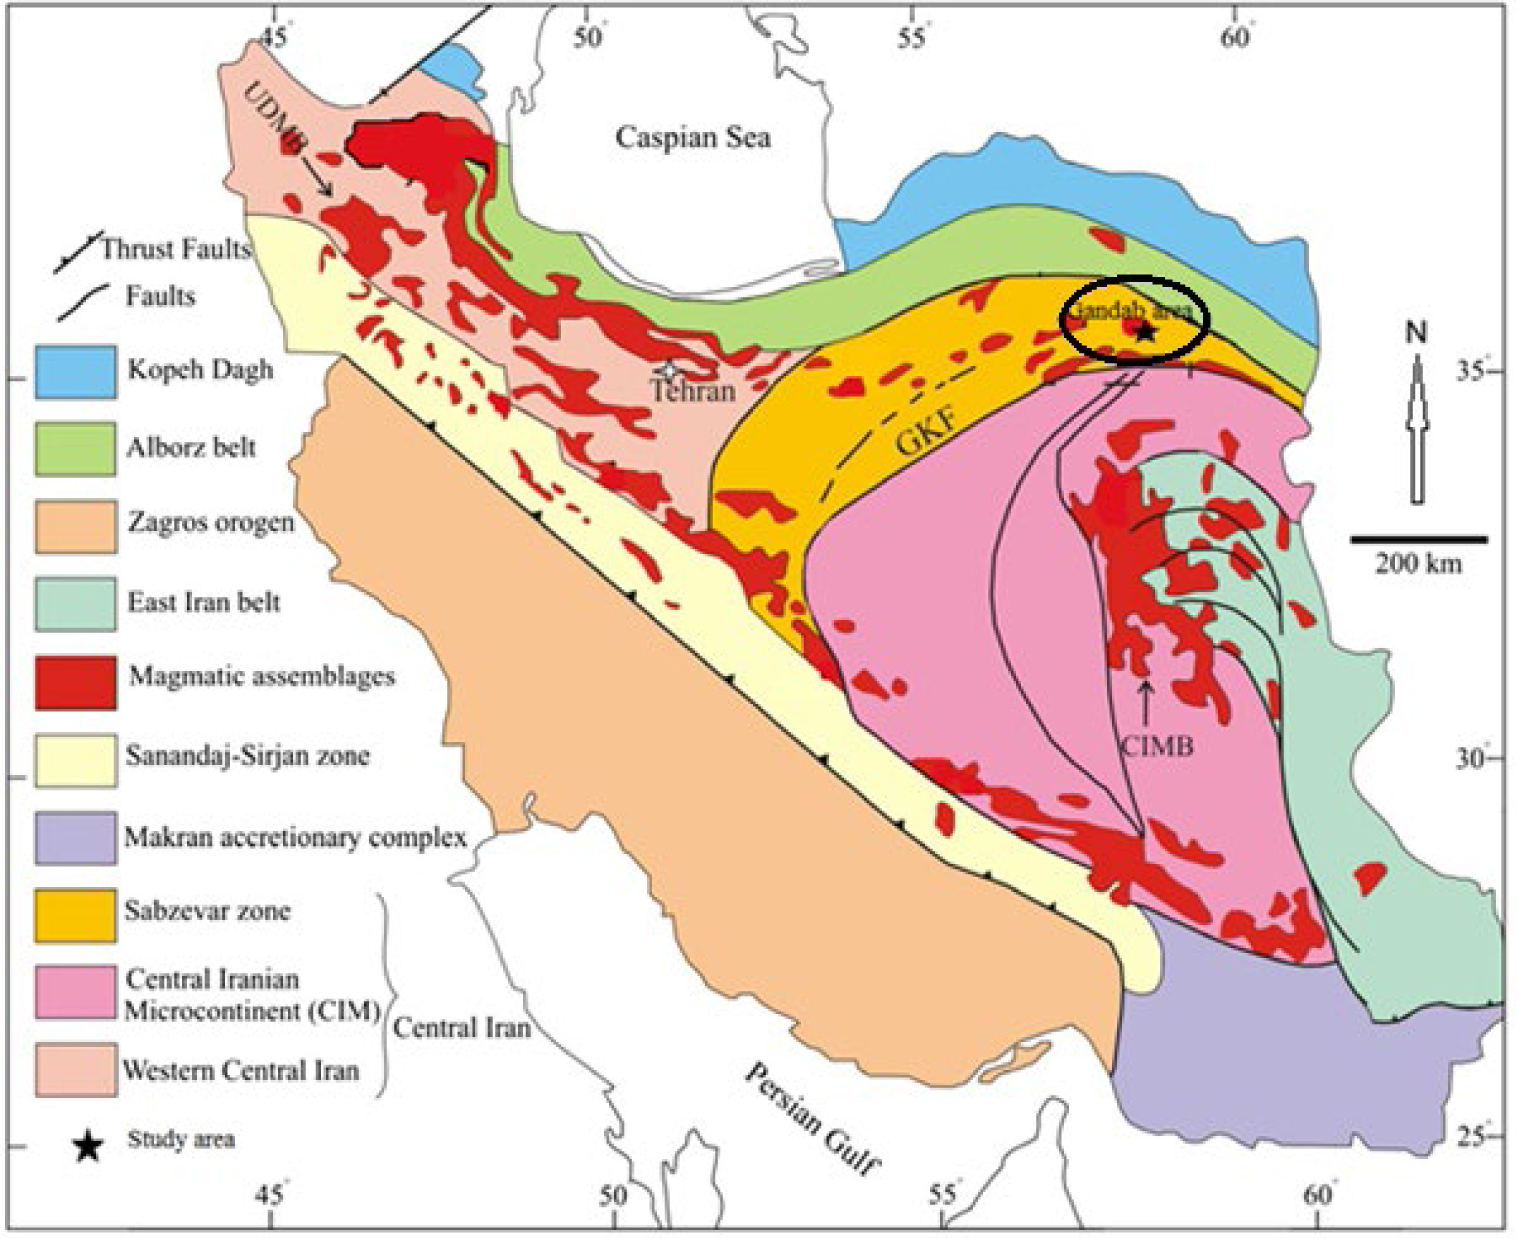
As shown in Fig. 1, Gandab area is situated in the Sabzevar structural zone, and Sabzevar Torbat Jam subzone at north of the Daruneh fault (e.g. Ruttner and Stöcklin, 1967; Berberian and King, 1981; Alavi, 1991) located in the central part of the 1:100000 geological map of Kadkan sheet in northeast of Iran (Naderi Mighan, 2000).
Fig. 1
Simplified structural map of Iran (compiled from Ruttner and Stöcklin, 1967, Berberian and King, 1981, Alavi, 1991) and location of the Gandab prospecting area in the Northeast of Iran.
. Method
Petrographic Study
163 samples were collected from the study area. Standard petrographic thin sections were prepared from these samples. The samples were examined in the laboratory of the Ferdowsi University of Mashhad, using standard techniques of optical mineralogy to determine their textures, mineral contents and rock type.
Major and trace element geochemistry
After excluding weathered and altered samples, twenty Samples with no or minimum signs of alteration were selected for chemical analysis from various types of rock units. The selected samples were crushed and powdered by mild steel, and sent to kansaran Binaloud Company (Tehran, Iran) to analyze major oxides by XRF spectrometry. As well, these samples were sent to Acme laboratories (Vancouver, Canada) for trace element analysis by ICP mass spectrometry (Acme labs code 4B03 Research ICP/MS) that is carried out with lithium metaborate-tetraborate fusion and nitric acid digestion. Table 1 indicates the geographic locations, names, and the symbols of the samples which were analyzed by XRF and ICP-MS methods.
Table 1
Geographic location, name, and symbol of the analyzed samples in the Gandab volcanic rocks.


U-Pb geochronology
According to the field study and relative age determination, two samples as the oldest (GCh-119, 6 Kg in weight) and the youngest (GCh-171, 10 Kg in weight) volcanic rocks were selected for U-Pb geochronology (Table 3). These samples were broken into small fragments by crusher and pulverized into fine grain and passed from 40 mesh sieve. Each sample was washed using water and acetone to get rid of clay-sized particles, and other probable undesired contaminants. After washing, samples were completely dried by suction through a vacuum line for 24-hours. The samples were then transferred into a Frantz magnetic barrier separator and each sample was divided into two non-magnetic and magnetic portions. This process was done to separate the magnetic heavy and altered ferromagnesian minerals from the samples for reducing time during the later zircon grain-picking stage. Non-magnetic heavy minerals extraction was performed by Bromoform (CHBr3). Zircon grains were separated under a binocular by hand-picking. The zircon grains were sent to university of Tasmania (Australia). This analyses were performed on an Agilent 7900 quadrupole ICP-MS with a 193 nm Coherent Ar-F excimer laser and the Resonetics S155 ablation cell at the University of Tasmania in Hobart. The down hole fractionation, instrument drift and mass bias correction factors for Pb/U ratios on zircons were calculated using 2 analyses on the primary (91500 standard of Wiendenbeck et al., 1995) and checked on 1 analysis on each of the secondary standard zircons (Temora standard of Black et al., 2003 and JG1 of Jackson et al., 2004) analysed at the beginning of the session and every 15 unknown zircons (roughly every 1/2 hour) using the same spot size and conditions as used on the samples. Additional secondary standards (The Mud Tank Zircon of Black and Gulson, 1978, Penglai zircons of Li et al., 2010, and the Plesovice zircon of Slama et al., 2008) were also analysed. The correction factor for the 207Pb/206Pb ratio was calculated using large spots of NIST610 analysed every 30 unknowns and corrected using the values recommended by Baker et al. (2004). Each analysis on the zircons began with a 30 second blank gas measurement followed by a further 30 seconds of analysis time when the laser was switched on. Zircons were sampled on 32 micron spots using the laser at 5 Hz and a density of approximately 2 J/cm2. A flow of carrier gas at a rate of 0.35 litres/minute carried particles ablated by the laser out of the chamber to be mixed with Ar gas and carried to the plasma torch. Isotopes measured were 49Ti, 56Fe, 90Zr, 178Hf, 202Hg, 204Pb, 206Pb, 207Pb, 208Pb, 232Th, 235U and 238U with each element being measured every 0.17 s with longer counting time on the Pb isotopes compared to the other elements. The data reduction used was based on the method outlined in detail in Halpin et al. (2014) and is similar to that outlined in Black et al. (2004) and Paton et al. (2010). Uncertainties were calculated using methods similar to that outlined Halpin et al. (2014) and Paton et al. (2010). Element abundances on zircons were calculated using the method outlined by Kosler (2001) using Zr as the internal standard element, assuming stoichiometric proportions and using the NIST610 to standard correct for mass bias and drift.
Table 2
Major element (in wt% by XRF) and trace element (in ppm by ICP-MS) compositions of samples from Gandab volcanic rocks (Entezari et al., 2016).
Table 3
Zircon U–Pb isotopic data for the Gandab volcanic rocks.
Sr-Nd isotopic analyses
Based on the petrographic and elemental geochemical information, four samples of the volcanic rocks of Gandab area were selected and sent to the Laboratory of Isotope Geology of the Aveiro University (Portugal) for Sr and Nd isotopic analysis (Table 4). The selected powdered samples were dissolved by HF/HNO3 solution in PTFE-lined Parr acid digestion bombs at a temperature of 180°C for 3 days. After evaporation of the final solution, the samples were dissolved in HCl (6.2 N) and also in acid digestion bombs, and dried again. The elements to analyze were purified using conventional ion chromatography technique in two stages: separation of Sr and REE in ion exchange columns containing AG8 50 W Bio-Rad cation exchange resin, followed by separation of Nd from other lanthanides in columns containing cation exchange resin Eichrom Ln resin. All reagents used in the preparation of the samples were sub-boiling distilled, and the water produced by a Milli-Q Element (Millipore) apparatus. Strontium was loaded with H3PO4 on a single Ta filament, whereas Nd was loaded with HCl on a Ta outer side filament in a triple filament arrangement. Both Sr and Nd isotopic ratios were determined by a multicollector Thermal Ionization Mass Spectrometer (TIMS) VG Sector 54. Data were acquired in dynamic mode with peak measurements at 1–2 V for 88Sr and 0.5–1.0 V for 144Nd. Typical runs consisted of acquisition of 60 isotopic ratios. Strontium and neodymium isotopic ratios were corrected for mass fractionation relative to 88Sr/86Sr = 0.1194 and 146Nd/144Nd = 0.7219. During this study, the SRM-987 standard gave an average value of 87Sr/86Sr = 0.710263(17) (N = 13; confidence limit = 95 %) and the JNdi-1 standard gave an average value of 143Nd/144Nd = 0.5121031(66) (N = 13; confidence limit = 95%).
Table 4
Rb–Sr and Sm–Nd isotopic data of the Gandab volcanic rocks (Entezari et al., 2016). 2σ shows the precision of measurement and calculations (standard error).
. Petrography
Andesitic rocks are dominant in the study area and middle Eocene coarse bedded limestone rocks folded and trusted above these volcanic rocks (Fig. 2). Based on the mineral assemblage and their percentage, andesitic volcanic rocks of the Gandab area can be classified into 9 sub-groups as follows. These groups are sorted by age from old to new respectively.
Hornblende pyroxene olivine basaltic andesite
Outcrops of these volcanic rocks are observed in the south, north, and northeast (Fig. 2) and display a porphyritic texture with microlitic groundmass. Plagioclase (25–30 vol. %), olivine (15–20 vol. %), clinopyroxene (10–15 vol. %), opacity hornblende (8–10 vol. %), and magnetite (5–7 vol. %) are the dominant phenocryst phases. Phenocryts occurs as large euhedral crystals, and plagioclases mostly display polysynthetic twins and some of them show slight oscillatory zoning. As well, some clinopyroxens show augite twins (Fig. 3a). Furthermore, Olivine grains are replaced by iddingsite and serpentine; opacity hornblendes are replaced by chlorite.
Fig. 3
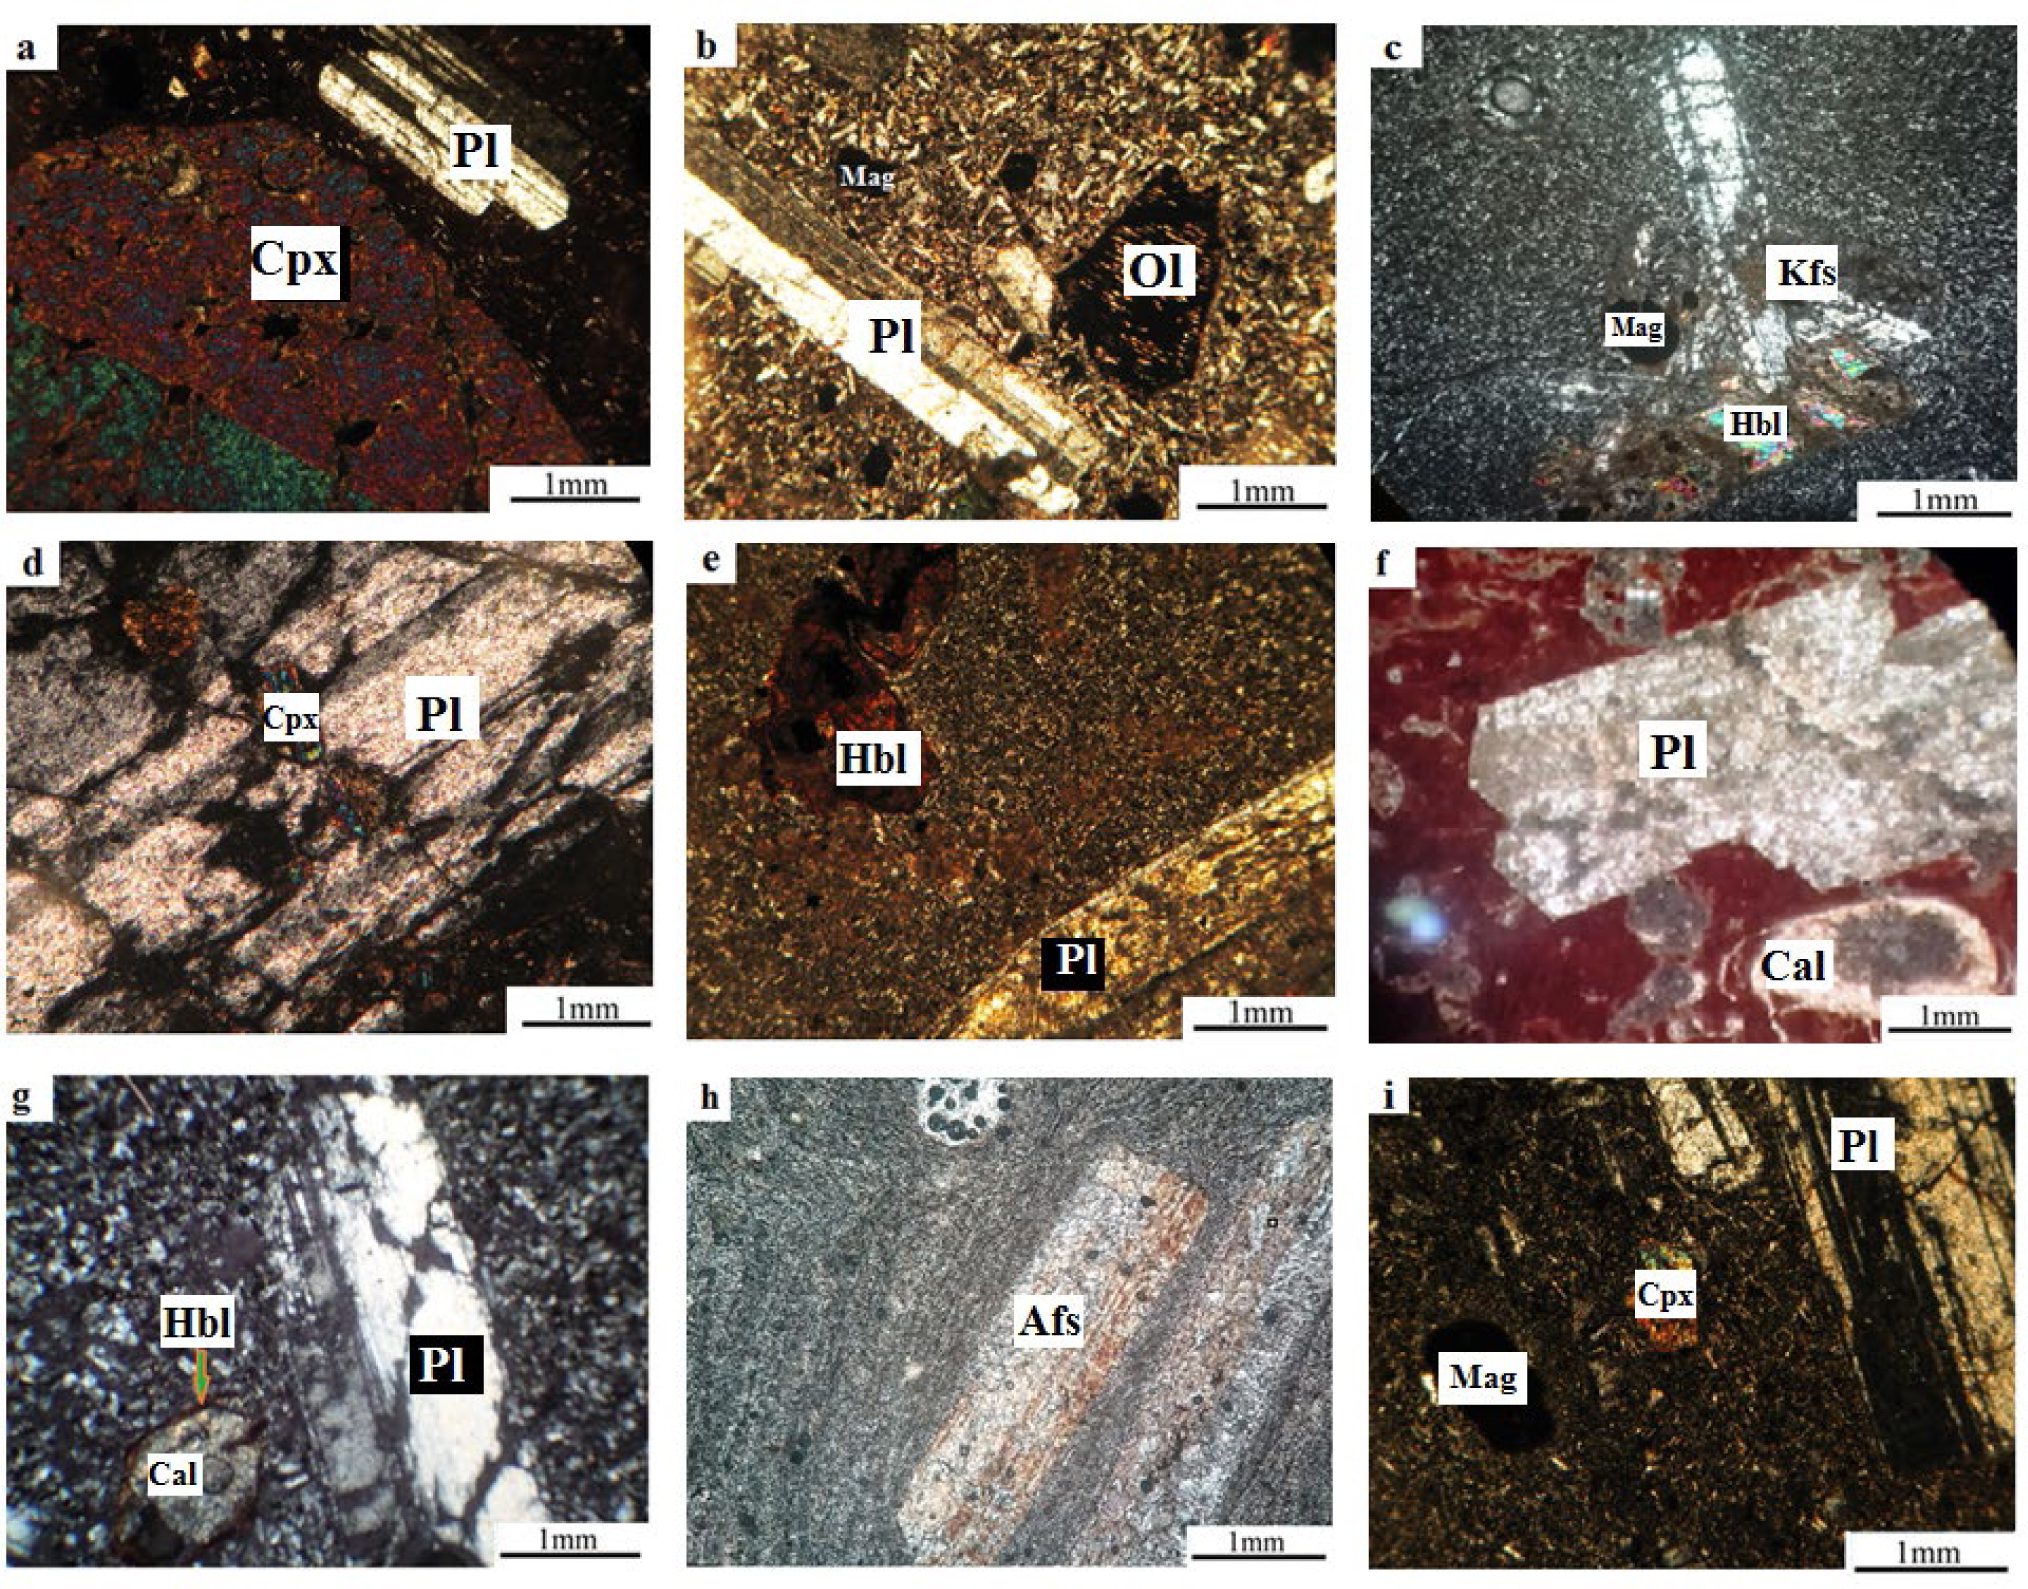
Microscopic images of thin sections of volcanic rocks in the studied area (Entezari et al., 2016): (a) Plagioclase and pyroxene phenocrysts in microlitic groundmass in the Hornblende pyroxene olivine basaltic andesite, XPL; (b) Plagioclase and olivine phenocrysts in medium grained groundmass and converting olivine to chlorite and iddingsite in the Olivine hornblende basaltic andesite; (c) K-feldspar, hornblendel, magnetite phenocrysts, and glomeroporphyritic texture in the Pyroxene hornbelend trachy andesite; (d) Poikilitic texture in the Hornbelend pyroxene trachy andesite; (e) Plagioclase and opacity hornblende phenocrysts in the Hornblende andesite; (f) Phenocryst of plagioclase in a matrix of fine grain to intersertal and amygdals of carbonate in the Andesite; (g) Plagioclase and hornblende phenocrysts and alteration of hornblende to carbonate in the Hornblende trachy andesite; (h) K-feldspar phenocryst and trachytic texture in the Trachy andesite; (i) Plagioclase, clinopyroxene, and magnetite phenocrysts in the Pyroxene andesite.
Olivine hornblende basaltic andesite
According to the field mapping (Fig. 2), these rocks are seen in the south and southwest. Olivine hornblende basaltic andesites have porphyritic textures with medium grained groundmass and in some parts they have current microlitic matrix. The mineralogy of this unit contains large euhedral phenocryst of plagioclase (20–25 vol. %), opacity hornblende and normal hornblende (7–10 vol. %), olivine (5–8 vol. %), magnetite (4–5 vol. %), and a small amount of clinopyroxen (0–5 vol. %). Olivine grains have been widely iddingsited (Fig. 3b).
Pyroxene hornblende trachy andesite
Pyroxene hornblende trachy andesite is mainly observed in the center of the area (Fig. 2) with porphyritic texture and fine grained groundmass. Microlitic, glomeroporphyritic and amygdaloidal textures are seen as well. Some of these rock’s vesicles have been filled by carbonate and jarosite. The euhedral phenocrysts of these rocks are plagioclase (7–14 vol. %), K-feldspar (5–10 vol. %), subhedral phenocrysts of normal and opacity hornblendes (5–7 vol. %), magnetite (4–5 vol. %) (Fig. 3c), and clinopyroxenes (2–5 vol. %). Plagioclases, hornblendes, and groundmass are hardly carbonatic and epidotic.
Hornblende pyroxene trachy andesite
Hornblende pyroxene trachy andesites are seen in the center, northeast, and east of the Gandab area (Fig. 2). The dominant texture of these rocks are porphyritic with microlitic medium grained groundmass. Moreover, glomeroporphyritic and poikilitic texture (Fig. 3d) are seen. These rocks contain euhedral phenocrysts of plagioclase (5–10 vol. %), K-feldspar (5–8 vol. %), opacity hornblende (5–7 vol. %), and subhedral clinopyroxene (3–6 vol. %).
Hornblende andesite
Field observations show that hornblende andesites are located in the east and north of the area (Fig. 2). Majority of the rocks have texture of porphyritic with fine grained groundmass and in some sections microlitic as well as amygdaloidal texture with vesicles filled by carbonate, epidote and secondary iron oxide. In this lithology, phenocryst phases are dominated by euohedral plagioclase with slightly polysynthetic twins (7–15 vol. %), euhedral to subhedral opacity hornblende (3–8 vol. %), and magnetite (3–5 vol. %) (Fig. 3e). In some places, the secondary iron oxide veinlet is observed with 0.01 mm diameter. In addition, phenocrysts and groundmass have been moderately altered to carbonate, epidote, chlorite, and clay minerals.
Andesite
Andesits are found at the north and center of the area (Fig. 2). These rocks have porphyritic texture, with subhedral or euhedral phenocrysts of plagioclase (5–7 vol. %), and minor hornblende (< 2 vol. %). Furthermore, in some parts they contain amygdals of carbonate and chlorite (Fig. 3f). Metasomatic alteration of the andesite rocks is evident in the groundmass and phenocrysts. In most instances, these are replaced by carbonate, epidot and mineral clay.
Hornblende trachy andesite
Hornblende trachy andesite is the most plentiful rock in this area. It is seen in the west, east, center, northeast, and southeast (Fig. 2). This lithology is described as rocks in which plagioclase (5–10 vol. %), opacity hornblende (4–8 vol. %), magnetite (3–7 vol. %), and K-feldspar (3–5 vol. %) are the major phenocrysts phases into fine to coarse grained groundmass or microlitic. The plagioclases are euhedral, tabular and commonly polysynthetic twins, the k-feldspar crystals are slightly smaller than the plagioclases, euhedral and commonly karlsbad twins, and the opacity hornblendes and magnetite grains are subhedral to euhedral. The phenocrysts and groundmass are locally and moderately altering to carbonate (Fig. 3g).
Trachy andesite
Trachy andesites are seen in the central and southeast parts of the area (Fig. 2). They have porphyritic texture with fine to medium grained groundmass as well as trachytic texture (Fig. 3h), and amygdaloidal filled with carbonate and chlorite are rarely seen. The main phenocrysts are euhedral plagioclase with polysynthetic twins (7–10 vol. %), K-feldspar with karlsbad twins (5–7 vol. %). Moreover, minor opacity hornblende (<1vol. %) is seen in these rocks. In some parts, these rocks show moderate alteration to carbonate and clay minerals.
Pyroxene andesite
The Pyroxene andesite is the youngest andesite volcanic rocks placed in the west Gandab area (Fig. 2). This lithology contains phenocrysts of euhedral plagioclase (15–30 vol. %), subherdal clinopyroxene (7–15 vol. %), and magnetite (4–5 vol. %) in a porphyritic and glomerophorphyry texture with fine to medium grains groundmass (Fig. 3i). Some of the vesicles have been filled by carbonate, chlorite, and secondary iron oxide. In thin sections, the carbonate, epidote, and secondary iron oxide veinlet are observed with 0.04 to 0.1 mm diameter as well as the plagioclase phenocryst and matrix is converted to the carbonate and epidote.
. Results and discussions
Major and trace elements
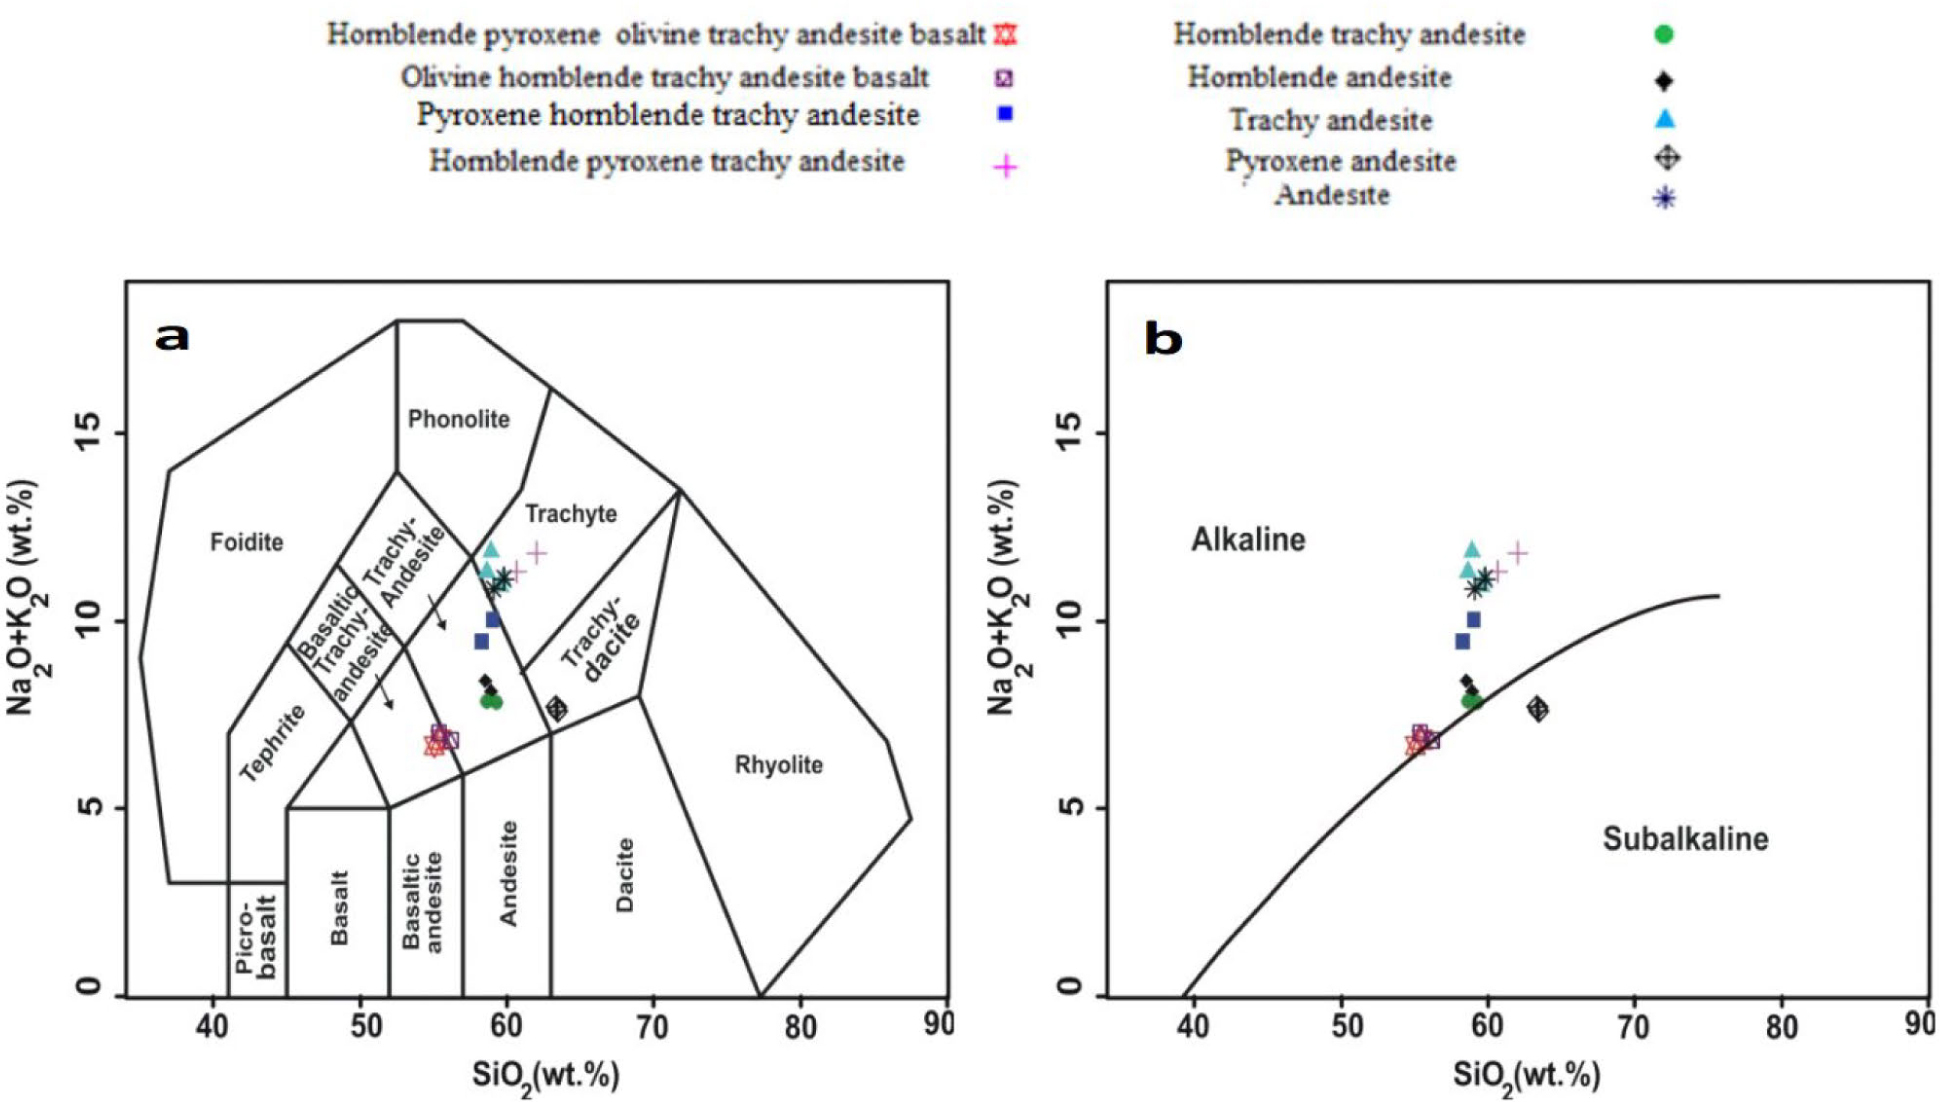
The results of the major and trace elements for 20 samples of free to weakly altered volcanic rocks are shown in Table 2. The total alkali-silica (TAS) classification diagram of Middlemost (1994) is used to categorize the volcanic rocks. The volcanic collection is wholly plotted within the basaltic trachy andesite, trachy andesite, trachyte, and trachy dacite fields (Fig. 4a). Most samples are located in the alkaline section and boundary between alkaline and sualkaline of diagram of Irvine and Baragar (1971) (Fig. 4b).
Fig. 4
(a) Na2O + K2O vs. SiO2 diagram (Middlemost, 1994); (b) diagram for discriminate between subalkaline and alkaline fields (Irvine and Baragar,1971).
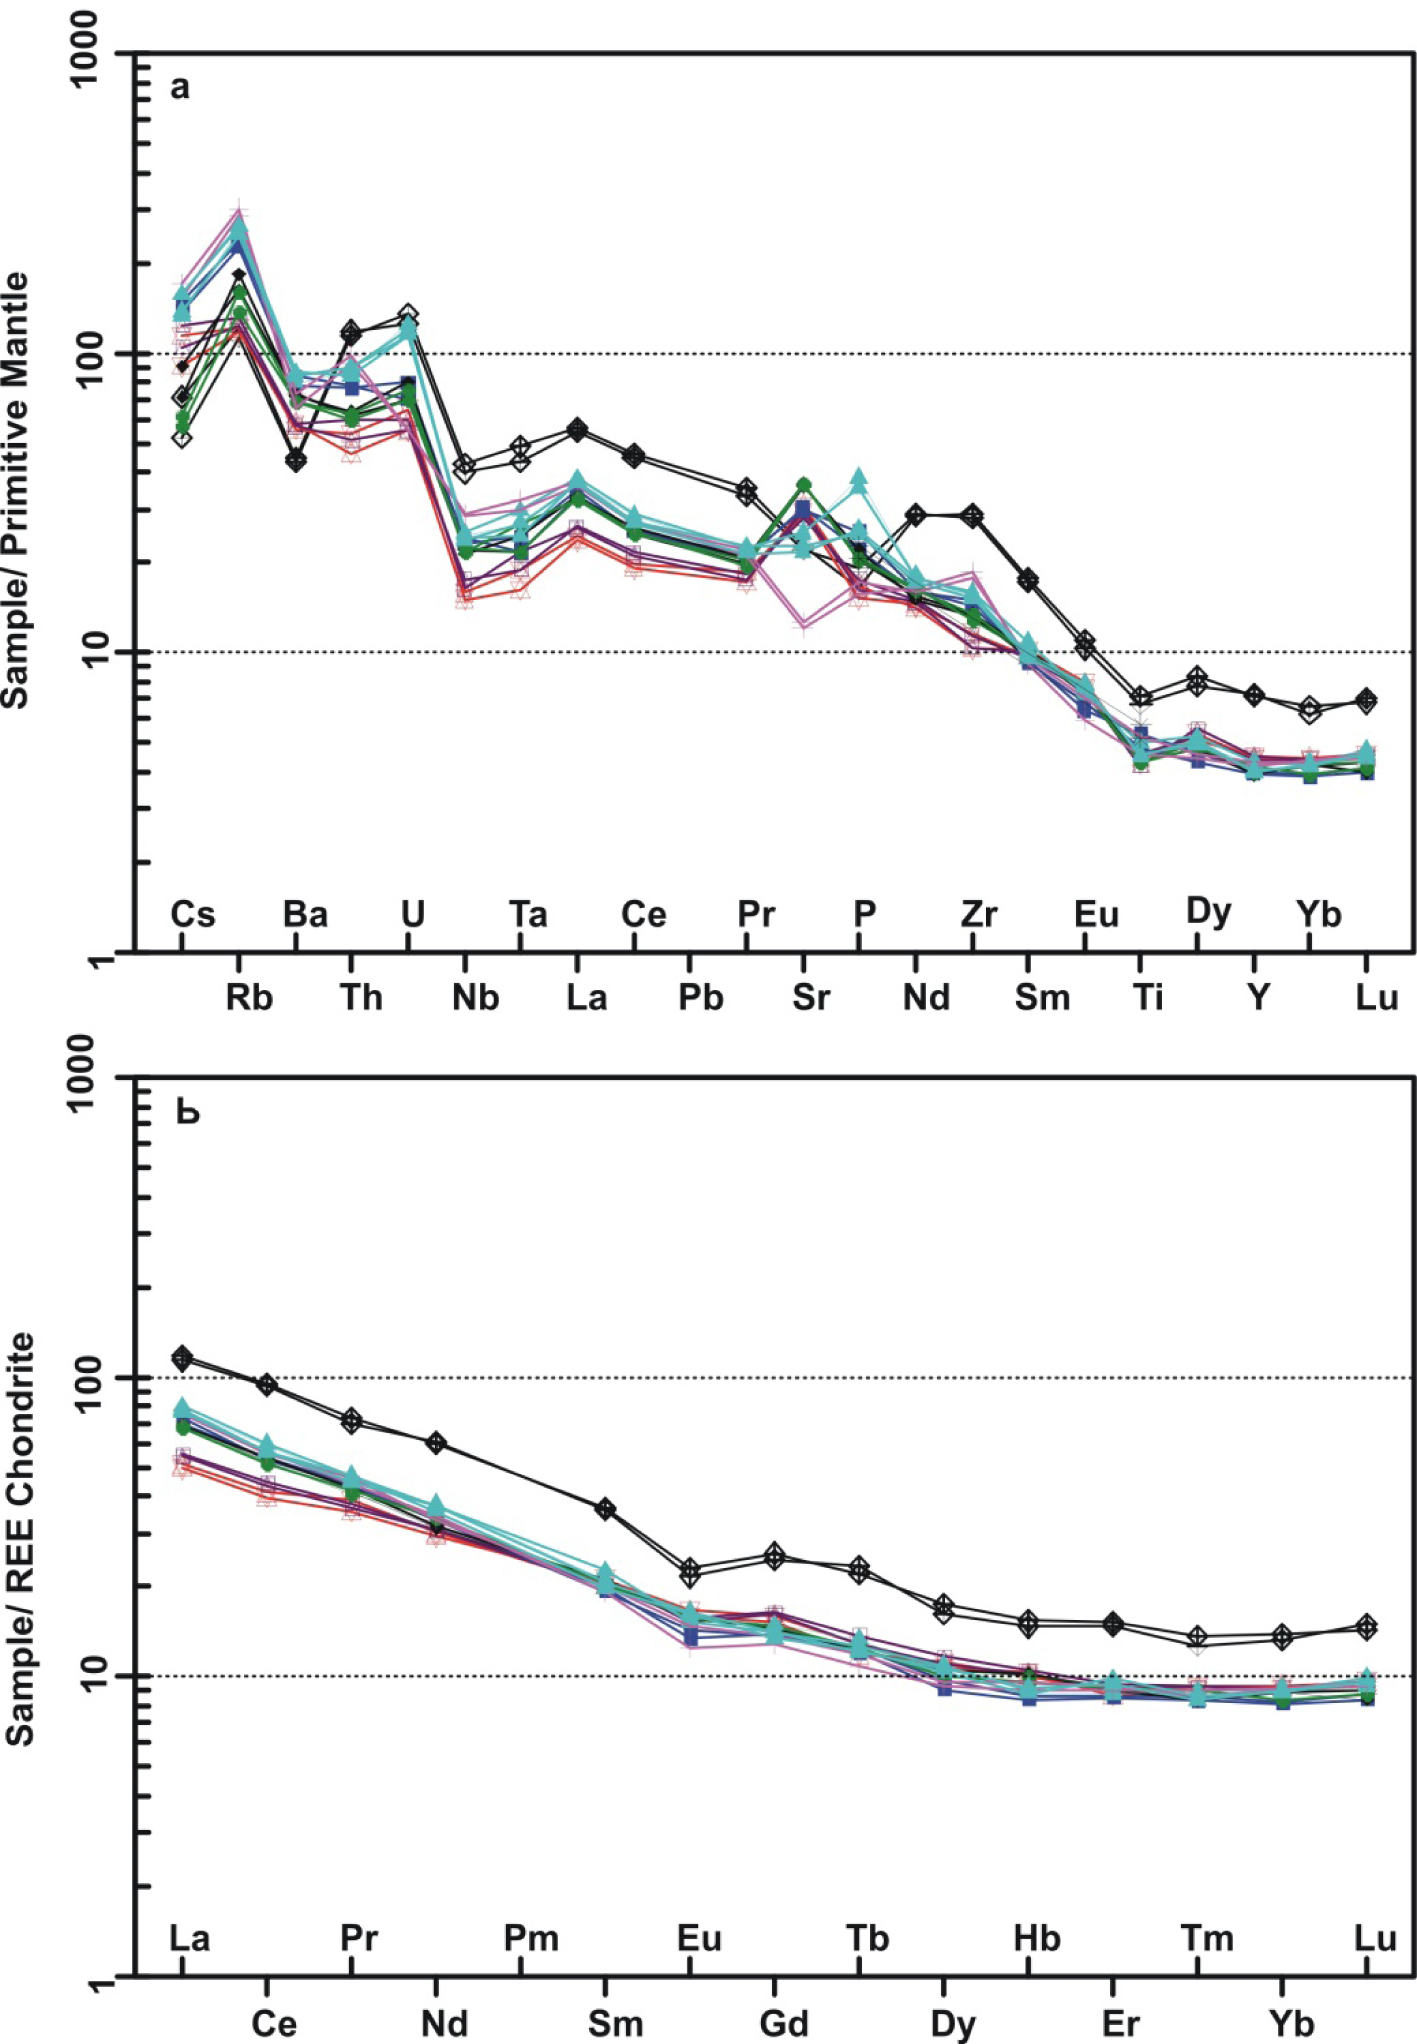
All of the Gandab volcanic rocks exhibit metaluminous on the diagram of Shand (1943) (Fig. 5) and their geochemical character with alumina saturation index [ASI = molar Al2O3 / (CaO + K2O + Na2O)] is ranging from 0.71 to 1.02. By using SiO2 as a fractionation index, MgO, FeO, and CaO contents display minus correlation with SiO2 content, while Al2O3, K2O, and Na2O contents represent positive correlation with SiO2 content, as well, TiO2 and P2O5 are dispersed and they show no correlation with SiO2 content (Fig. 6a-6h). The linear trend among SiO2 and several major oxides demonstrates a genetic relationship in these volcanic rocks. Na2O, Al2O3, and K2O vs. SiO2 diagrams display an increasing and thin trend. This issue points out that K-feldespar and sodic plagioclases were crystallized in the late stage of crystallization and pending fractionation of a silicate melt at down pressures. Along with increasing percentage of silica, CaO, MgO, and FeO are decreased in these rocks. Probably such trends are compatible with fractionation of the seen phenocryst phases which have been created from a basaltic andesite as a parental magma. In fact, this type of variation displays that Mg and Fe-rich rock-forming minerals contain amphibole, pyroxene, and olivine and they have had a great role during the crystallization of volcanic rocks like plagioclases which represents the effect of fractional crystallization on a pending magmatic evolution. La, Nb, Zr, Rb, Th, Ta, and Hf contents are positively correlated SiO2 concentrations (Fig. 6i-6o). The trace element variations in these igneous rocks are compatible with plagioclase, amphibole, and Fe-Ti oxide fractionation (Mazhari et al., 2011). Multi-element spider diagrams were normalized with primitive-mantle (McDonough and Sun, 1995) (Fig. 7a) and indicate that the volcanic rocks are depleted in high field strength elements (HFSE) which may be owing to fractionation of a titanium-rich phase in the magma source (Ghalamghash et al., 2009). Additionally, all samples present enrichment in the components of large ion lithophile elements (LILE) compared to field strength elements (HFSE) in normalized primitive-mantle diagram (Fig. 7a). The above mentioned characteristics point out that the volcanic rocks would belong to the subduction zones. Fig. 7b shows a range of chondrite-normalized distribution REE patterns (Boynton, 1984) for 20 analyzed samples of Gandab volcanic rocks. The LaN/SmN ratios vary between 2.35 to 4.09 (average 3.37), which display moderate enrichment of light rare earth elements (LREE). Eu anomaly is calculated by Eu/Eu*=EuN/(SmN×GdN)1/2 (Taylor and McLennan, 1985). Eu anomaly values range from 0.72 to 0.97 (average 0.87), which represent weakly negative Eu anomaly (Ketchum et al., 2013), and GdN/YbN values range from 1.41 to 1.86 (average 1.65). These ratios reflect nearly flat heavy rare earth element (HREE) on the normalized REE patterns compared to chondrite values (Li et al., 2013).
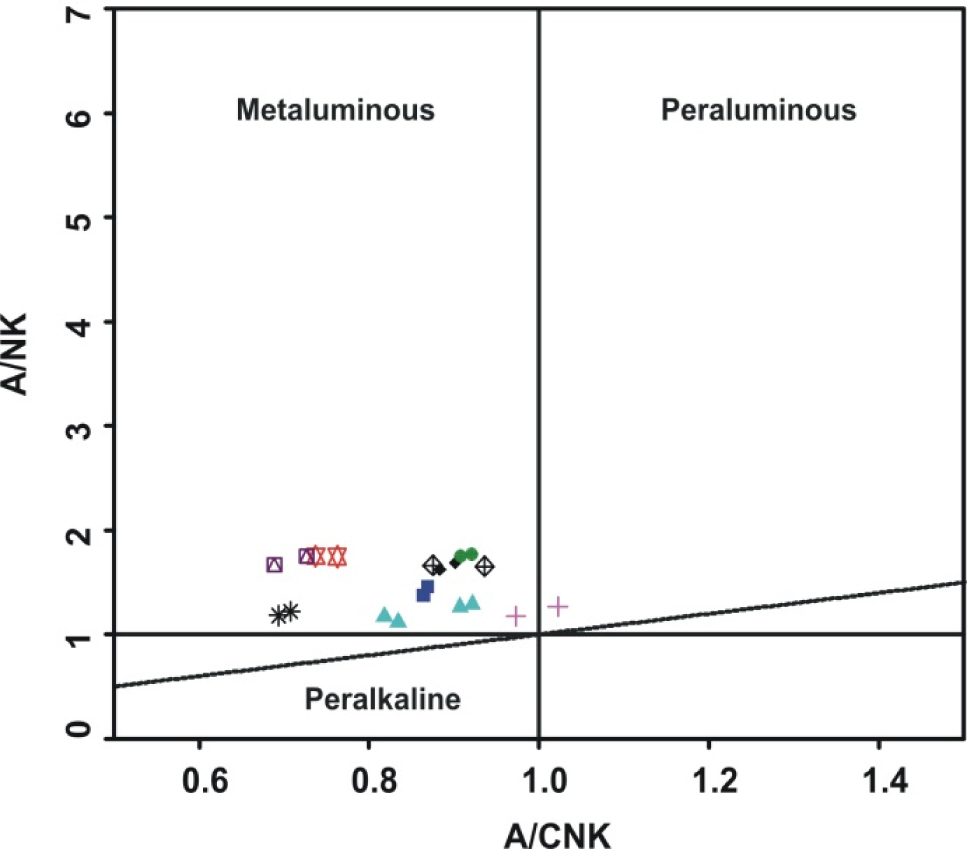

Fig. 7
(a) primitive-mantle normalized diagrams (McDonough and Sun, 1995); (b) REE chondrite normalized diagrams (Boynton, 1984). The symbols are the same as in Fig. 6.
Zircon U-Pb dating
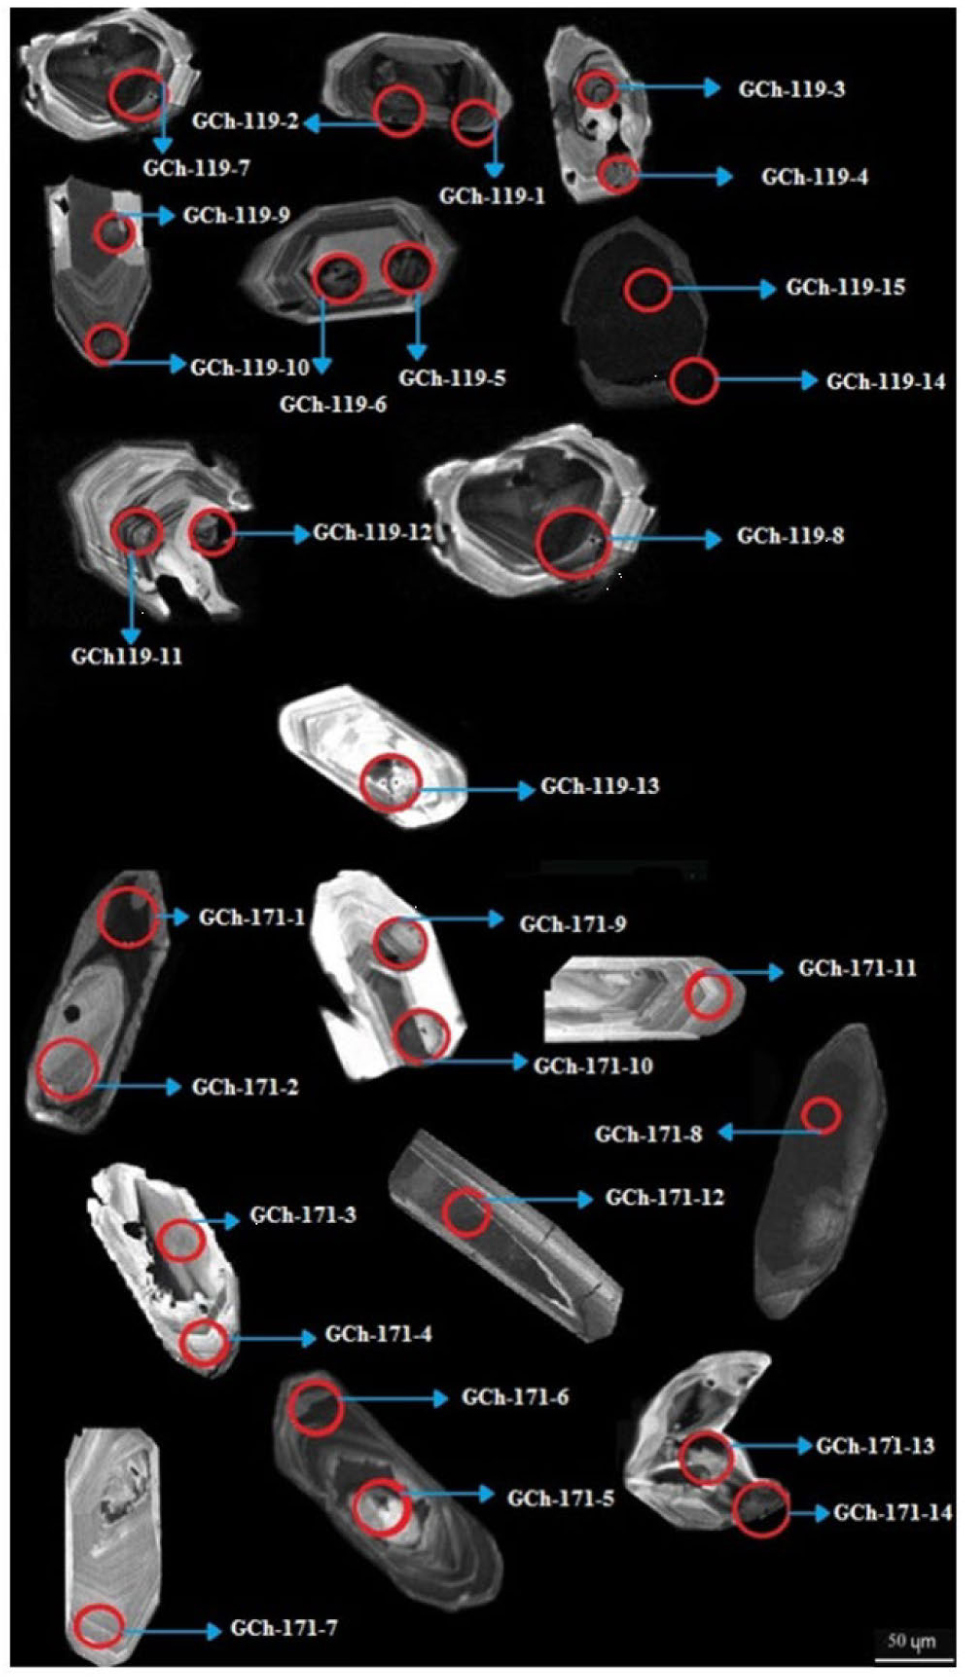
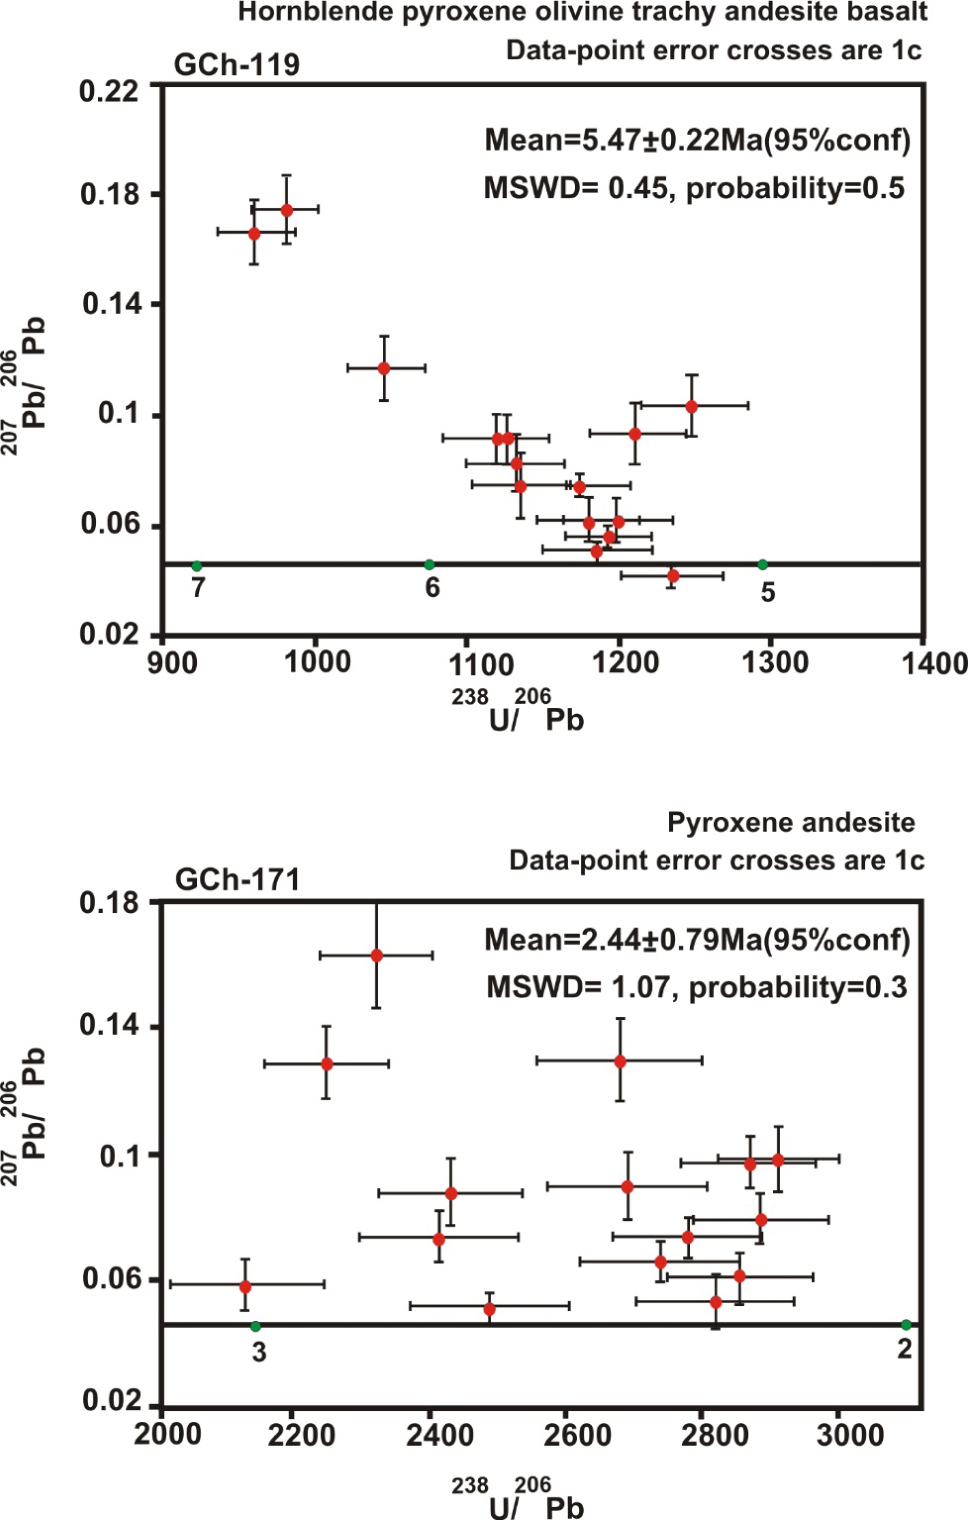
The outcomes of U-Pb zircon analysis on the two oldest and youngest samples based on the relative age are presented in Table 3 (No. GCh-119-Hornblende pyroxene olivine basaltic andesite (oldest unit) and No. GCh-171-Pyroxene andesite (youngest unit). Cathodoluminescence (CL) images mostly show oscillatory or growth zoning on zircons (Fig. 8), consistent with igneous origin and their growth by magmatic processes (Hoskin and Schaltegger, 2003). The studied zircons have a subhedral to euhedral shape but zircons in the Hornblende pyroxene olivine basaltic andesite rock have a light pink color and in the Pyroxene andesite rock are white to colorless. The Zircons are 100–250 μm in length and 50–100 μm width and have high contents of Th (201–535 ppm) and U (332–1005 ppm) with Th/U varying from 0.572 to 1.45. The results of computing isotopic age of the Hornblende pyroxene olivine basaltic andesite are shown as concordia (Fig. 9a). With regard to 15 analyzed points, the average age (Weighted mean) is 5.47 ± 0.22 Ma (errors shown are 1σ). The results of the calculating isotopic age of the Pyroxene andesite are displayed as concordia in Fig. 9b. Based on 14 analyzed points, the average age (weighted mean) is 2.44 ± 0.79 Ma (errors shown are 1σ). Therefore, U-Pb zircon age data indicates that Gandab volcanic rocks have been formed in Pliocene time.
Sr-Nd isotopes
Sr and Nd isotopic data obtained in four selected samples are presented in Table 4. These samples have 143Nd/144Nd and 87Sr/86Sr ratios ranging from 0.512807 to 0.512893 and from 0.704082 to 0.705931, respectively. If the Nd isotopic ratio composition is expressed using εNd notation, the range goes from +3.3 to +5.0. Sr and Nd isotopic ratios and εNd values show insignificant differences between present-day values and calculated initial values for young geological ages, like those obtained in this work (less than 6 Ma), since both 87Rb and 147Sm have very low decay constants (Steiger and Jager, 1977; Villa et al., 2015). Therefore, the measured isotopic ratios, in this case may be considered as the representing initial compositions.
Tectonic setting
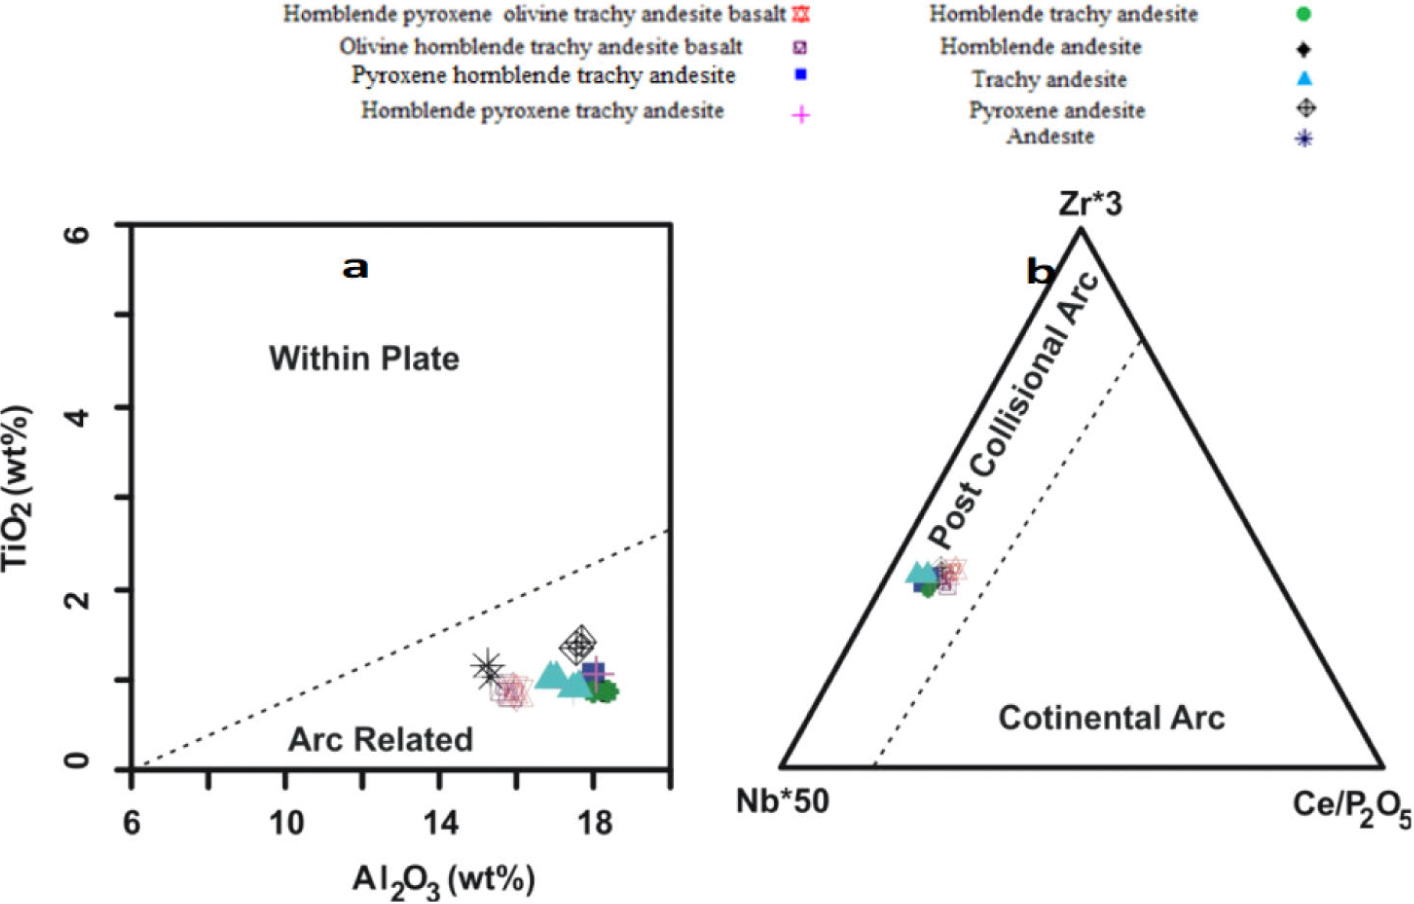
Application of TiO2 vs. Al2O3 (Muller et al., 1992) indicate that all of the samples are located at the arc environment (Fig. 10a). Plotting samples on the Nb*50-Zr*/3-Ce/P2O5 ternary diagram (Muller et al., 1992) shows that Gandab volcanic rocks are situated at post-collisional arc (Fig. 10b).
Fig. 10
(a) TiO2 us. Al2O3 diagram, (Muller et al., 1992); (b) Nb*50-Zr*/3-Ce/P2O5 ternary diagram (Muller et al., 1992).
Researchers (e.g. Fang and Niu, 2003) have used Nb/Th ratio to survey the impact of subduction zone processes on the formation of volcanic rocks. This ratio is lower than ‘4’ in the rocks related to the subduction zone (Sun and Mcdonough, 1989). Nb/Th ratio of the proposed samples varies from 2.19 to 3.06. As a result, Nb/Th ratio in the proposed samples is less than ‘4’ and it verifies that the studied rocks were affected by the processes related to the subduction zone. As it was mentioned earlier, the study area is located at Sabzevar zone (NE Iran). During the Late Cretaceous, the Sabzevar oceanic basin (branch of the Neo-Tethys Ocean between central Iranian microcontinent and Eurasian margin) was formed, which was later closed during Palaeocene-Eocene (Rossetti et al., 2010). With regard to the ages (5.47 to 2.44 Ma) and geochemical properties of the Gandab volcanic rocks, we believe that they have been created in post-collision environment after Neo-Tethys subduction. Enrichment in LILE and LREE relative to HFSE and HREE respectively, and negative anomalies of Nb–Ti elements are the specifications of subduction-related magmas. These characteristics are generally related to a mantle source, which has already been enriched in LILE and LREE over HFSE and HREE by metasomatic activity of solutions released from the subducted sediments or slab (Pearce, 1983; Cameron et al., 2003). Many different types of models have been suggested to illustrate this signature in the post-collisional setting such as considering amphibolites, peridotite, and metapelite as a hybrid source in the crust–mantle boundary (López-Moro and López-Plaza, 2004), or presenting a theory regarding mixing of magmas in the asthenosphere and enriched lithospheric mantle (Li et al., 2000). Considering all evidences, the best suggestion can be an enrichment of lithospheric mantle by earlier subduction events in a post-collision stage (Turner et al., 1996; Janous’ek et al., 2000; Liu et al., 2002; Aydin et al., 2008).
Petrogenetic properties
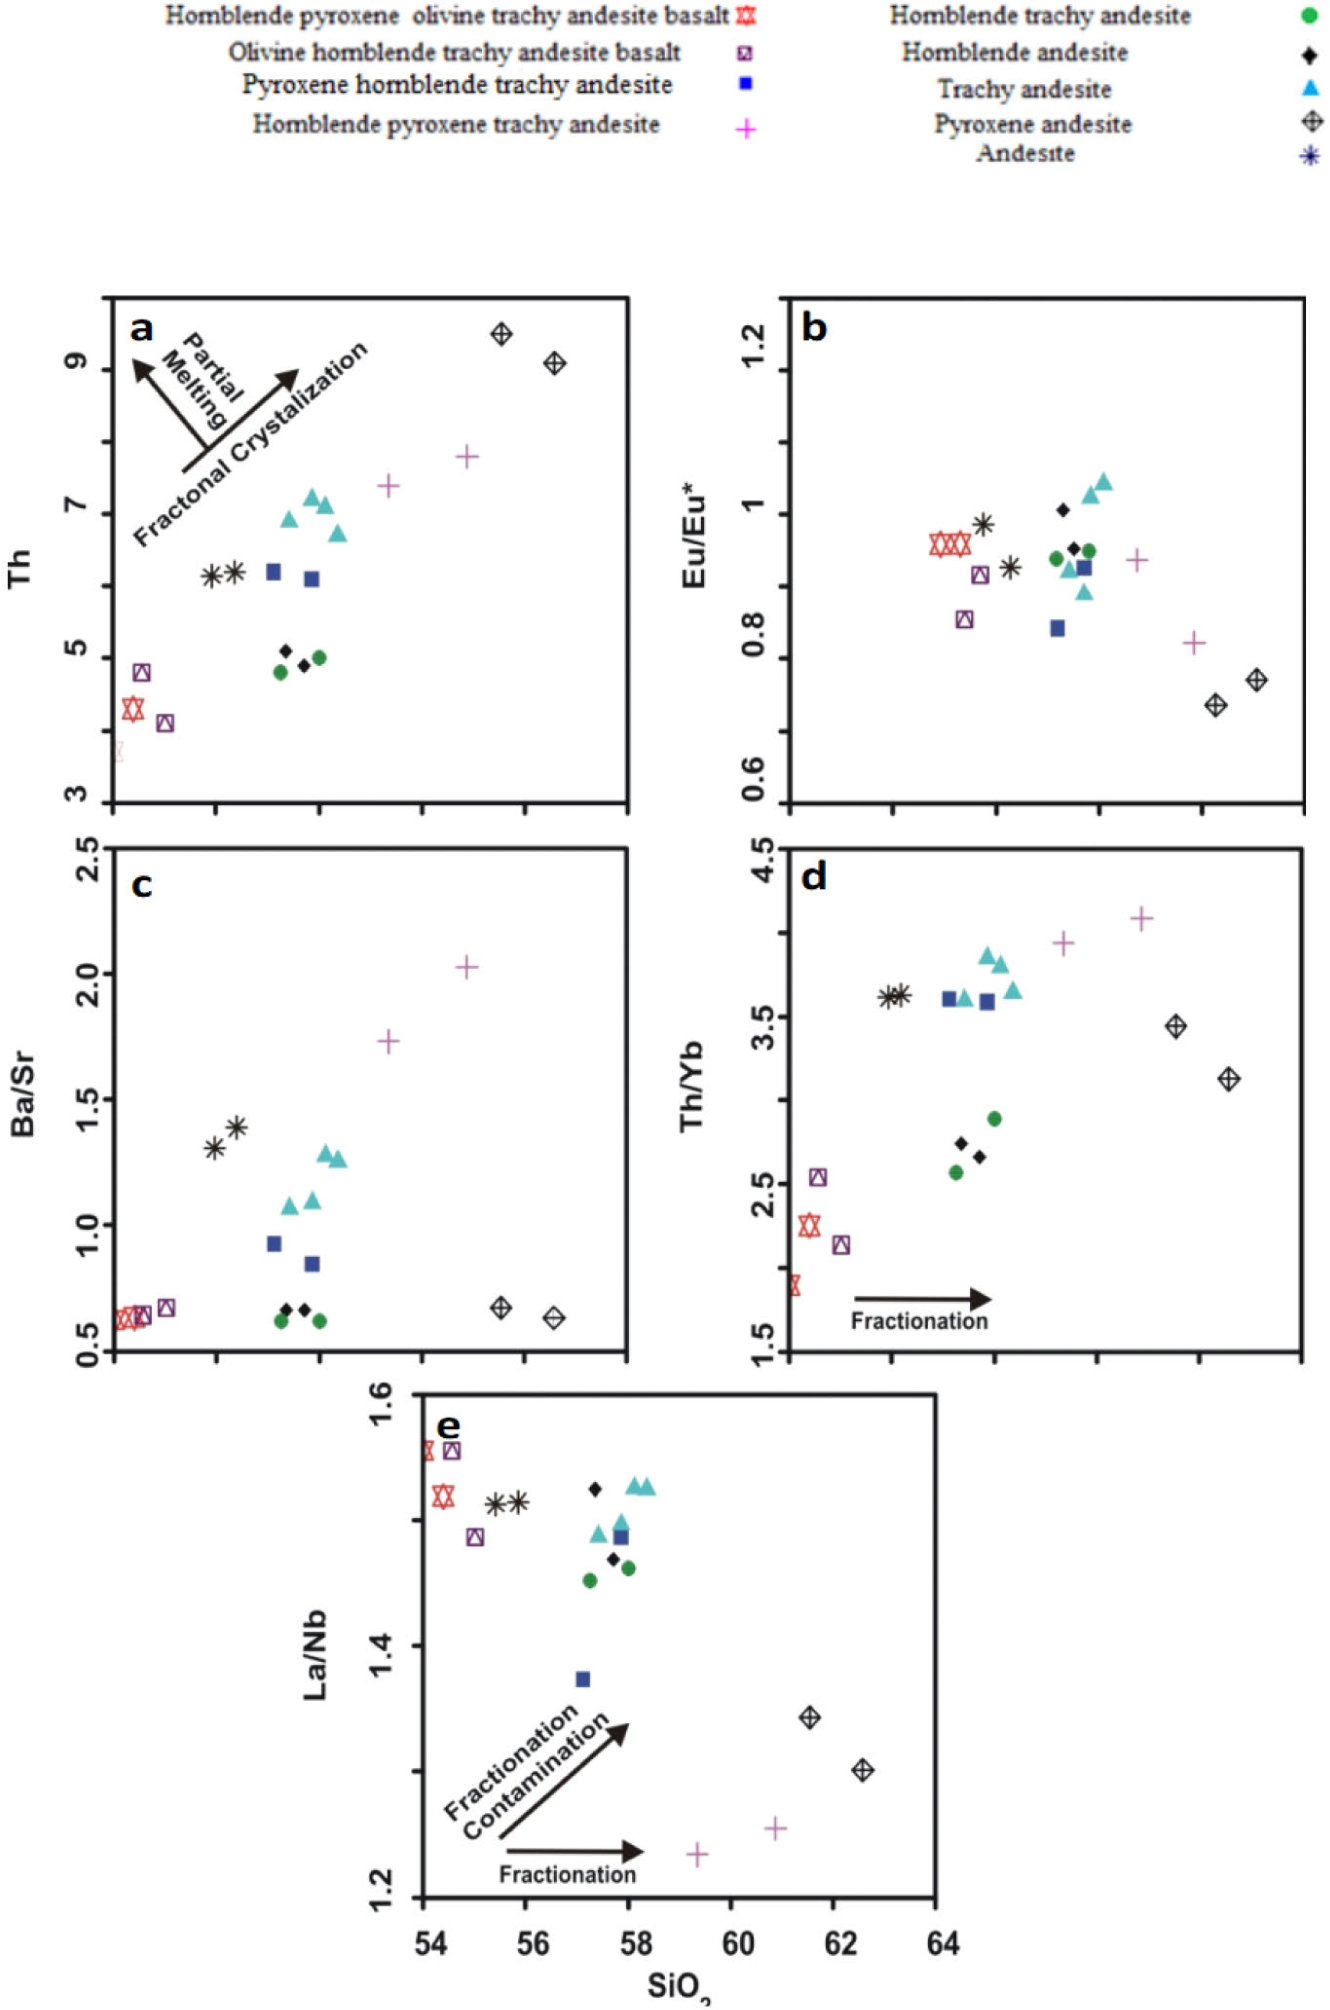
Calculated ages based on U-Pb zircon and geochemical characteristics indicate that all volcanic rocks of the Gandab area probably have a similar petrogenesis and magma source. Changing major and trace elements normally display linear trends vs. SiO2 (Fig. 6a-6o) indicating that the volcanic rocks were resulted from same parent magma. The inverse correlation can be seen between SiO2 and CaO, FeO and MgO in the volcanic rocks. As well, SiO2 has a direct coloration with Na2O, K2O, Al2O3, La, Nb, Zr, Rb, Th, Ta and Hf As a result, crystal fractionation proccess is specified from the parental magma. Furthermore, Fig. 9 depicts REE chondrite-normalized diagrams, and it is clear that HREE includes the limited variations, while LREE comprises higher variations. The above mentioned patterns demonstrate a crystal fractionation or a partial melting process including mineral phases that powerfully fractionate or partial melting LREE relative to HREE (Lopez-Moro and Lopez-Plaza, 2004; Lopez-Moro et al., 2012). It should be remarked that it s very difficult to distinguish the difference between fractional crystallization and partial melting based on the primary magma compositions. But, this difference can be distinguished based on the incompatible element plots such as the plot of Th versus SiO2 shown in Fig. 11, that is a representing fractional crystallization process (Whalen et al., 1987). The relationship between Eu/Eu* and SiO2 (Irber, 1999) in the Gandab volcanic rocks is depicted in Fig. 11b and this inverse correlation between Eu/Eu* and SiO2 indicates a fractionation sequence in the rocks of area. Fig. 11c also shows a direct correlation between Ba/Sr ratio and SiO2 (Lopez-Moro et al., 2012), which indicates the process of crystal fractionation in volcanic rocks surrounding Gandab. In the mantle-derived rocks, the ratio of Th/Yb and La/Nb is sensitive to the crustal contamination (Taylor and McLennan, 1985). The ratios of Th/Yb and La/Nb vs. SiO2 in the Gandab samples are depicted in Fig. 11d, 11e and it is clear that Th/Yb and La/Nb ratios show a little variation to the SiO2. This issue is an indication of crystal fractionation. Furthermore, lack of mafic microgranular enclaves and disequilibrium textures such as sieve texture and antirapakivi indicate that magma mixing has not occurred in the volcanic rocks of area.
Fig. 11
Diagrams showing fractional crystallization (FC) for Gandab volcanic rocks. (a) Th vs. SiO2 (Whalen et al, 1987); (b) Eu/Eu* vs. SiO2 (Irber, 1999); (c) Ba/Sr vs. SiO2 (Lopez-Moro et al., 2012); (d) Th/Yb vs. SiO2 (Taylor and McLennan, 1985); (e) La/Nb vs. SiO2 (Taylor and McLennan, 1985).
Source properties
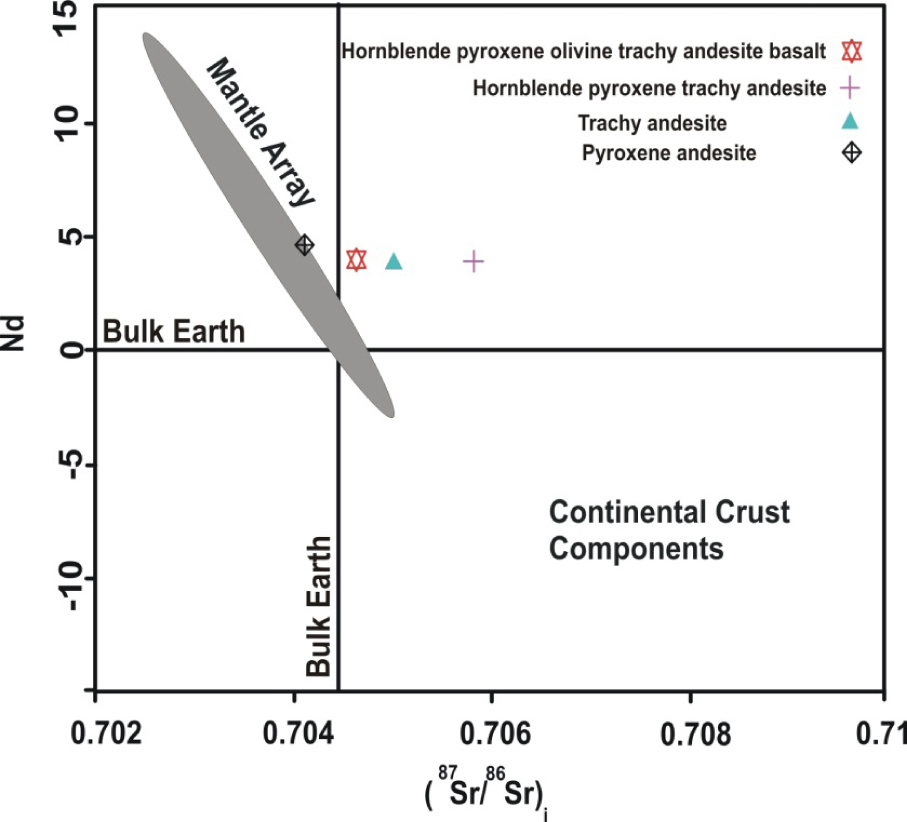
Negative and positive εNd (t) isotopic ratios demonstrate the features of the crustal melt, and mantle array, respectively (Kemp et al., 2007; Yang et al., 2007; Li et al., 2009). With respect to the εNdi – (87Sr/86Sr)i isotopic plot depicted in Fig. 12, the Gandab Volcanic rocks show a trend toward the mantel (Kemp et al., 2007; Li et al., 2009).
The Gandab samples are mainly characterized with high concentrations of incompatible trace elements (e.g., LILE and LREE). Moreover, Fig. 7 shows that these samples are marked by considerable negative Nb, Ta, and Ti anomalies specifying that the samples have not been driven from normal MORB or OIB mantle sources which usually demonstrate positive Nb–Ti anomalies in primitive-mantle normalized trace element diagrams (Hofmann, 1997). As well, the Nb/La ratios of the Gandab samples are changed from 0.64 to 0.79 representing a lithospheric mantle source (Bradshaw and Smith, 1994; Smith et al., 1999). Hydrous phase formed in the lithospheric mantle source can be shown based on the difference between element compatibility of phlogopite and amphibole (Furman and Graham, 1999; Yang et al., 2004). Since the Rb/Sr ratios of volcanic rocks reflect the Rb/Sr ratios of their source rocks (Kemp and Hawkesworth, 2003), the Gandab volcanic rocks have high Rb/Sr ratios, but a low initial 87Sr/86Sr ratio is also seen which probably shows a mica-bearing source with a short residence time within the mantle. In the study area, the Ba/Rb (2.51–5.51) and Nb/Th (2.19–3.06) ratios are relatively low (Table 2), while the Rb/Sr ratios (0.11–0.76) are relatively high. As a result, the source region includes phlogopite instead of amphibole. Spinel is depleted from HREE and Y, while garnet and amphibole are enriched in HREE, Y, and Middle REE (MREE), respectively. Values of LaN / YbN ratio in the Gandab samples are changed from 5.32 to 9.31. As well, this ratio is less than the La N /Yb N ratio in the igneous rocks in which have been derived from the magma with garnet as the major phase in their source (Martin, 1987), representing the garnet as the major residual phase. Therefore, spinel and/or amphibole may be existent in the residua. Nevertheless, the trivial enrichment in MREE of the samples (Fig. 7) indicates that amphibole may not stay stable in the residual following fractional melting. Geochemical and isotopic characteristics of the samples in the study area demonstrate that the phlogopite-bearing spinel peridotite is the source of magma which formed the volcanic rocks of the area.
. Conclusions
LA–ICP–MS U-Pb zircon age data indicate that the volcanic rocks have been formed between 5.47 ± 0.22 Ma and 2.44 ± 0.79 Ma. Major oxides geochemistry reveal that all the studied rocks are typically metaluminous. In primitive mantle and chondrite-normalized trace element spider diagrams, the analyzed samples demonstrate slight to moderate enrichment in LILE (2.35 ≤La N /SmN≤ 4.09) compared to HFSE (1.41≤ GdN /YbN≤ 1.86) while being accompanied by negative anomalies of Nb and Ti. These geochemical properties and isotope geochemistry (Sri and εNdi) illustrate that the studied rocks are derived from enriched lithospheric mantle source as well as they are co-genetic which fractional crystallization process has produced different magmas in their composition. The analyzed samples also show a post-collisional arc environment. We propose that volcanic activity in Gandab area during Pliocene period has been created by the enriched lithospheric mantle source which is metasomatized by previously subducted sediments after Neo-Tethys subduction.