
. INTRODUCTION
The post-IR pulsed blue light stimulated luminescence signal (post-IR PBLSL, Bailiff and Mikhailik, 2003; Denby et al., 2006), which involves pulsing the optical stimulation, was proposed to isolate the luminescence signal dominated by quartz grains in their mixture with feldspars. The post-IR PBLSL procedure for determining equivalent dose (De) has been continuously optimised (Thomsen et al., 2008; Ankjærgaard et al., 2010) and applied to samples of a variety of origins (Tsukamoto and Rades, 2016). However, the post-IR PBLSL signal of a quartz-feldspar mixture may still suffer from the contribution from the feldspars and often suffers from the low signal to noise ratio (Ankjærgaard et al., 2009, 2010; Tsukamoto and Rades, 2016).
As an alternative to the blue light stimulation, the green light has long been employed to stimulate the quartz luminescence signals (Bailey et al., 2011), especially for early studies on pulsed stimulation (Chithambo and Galloway, 2000; Chithambo, 2003). The response of feldspars to green light stimulation is different from that to blue light stimulation. The trapped electrons are excited into the conduction band and sub-conduction band by the blue light and green light, respectively (Jain and Ankjærgaard, 2011). The recombination of the sub-conduction band electrons with the holes is significantly modulated by the stimulation temperature, while the recombination of the conduction band electrons is rather less affected by temperature (Poolton et al., 2009). Similarly with the green light stimulation, the IR stimulation also excites the trapped electrons into the sub-conduction band (Jain and Ankjærgaard, 2011). Therefore, it is expected that the electron-hole pairs of feldspars would potentially recombine under the green light stimulation, could be consumed by a prior IR stimulation at elevated temperature (Jain and Singhvi, 2001), and the contribution from feldspars to the post-IR pulsed green light stimulated luminescence (post-IR PGLSL) will be reduced. Such a reduction in the feldspar contribution for the post-IR PGLSL signal may also allow employing long integration periods to improve the signal to noise ratio.
In this study, we tested the idea of using the green light for pulsed stimulation to suppress the feldspar contribution by investigating the characteristics of the post-IR PBLSL and post-IR PGLSL signals of both quartz and feldspars. Firstly, we investigated the effect of the signal integration period, pulsed stimulation temperature and prior IR stimulation temperature on the post-IR PBLSL and post-IR PGLSL intensities of quartz and feldspars, and the potential feldspar interference on these two signals for the hypothetical quartz-feldspar mixture. Then, we compared the De values determined by applying these two signals to the artificial quartz-feldspar mixture.
. SAMPLES, INSTRUMENTS AND METHODS
Samples
Samples from a wide geographical coverage are employed in this study (Table 1). Quartz grains with diverse luminescence sensitivities were extracted from four samples, including dune sands from the Qaidam basin (Q-QB, dim quartz) in western China and the Otindag desert (Q-HD, bright quartz) in eastern China, fluvial sands from the northern Tian Shan piedmont (Q-NTS, dim quartz), and the calibration quartz from the DTU Risø laboratory (Q-CAL, super-bright quartz). Feldspars were extracted from the same fluvial sands mentioned above from the northern Tian Shan piedmont (F-NTS) and the crushed perthite from Shantou of southern China (F-PST). These samples are used to investigate the characteristics of the post-IR PBLSL and post-IR PGLSL signals. Two extra samples from the dune in the Qaidam basin (17YDE2C) and Junggar basin (15MNS01, modern sample) are employed for evaluating the performance of post-IR PBLSL and post-IR PGLSL signals on De determination for a quartz-feldspars mixture.
Table 1
List of samples investigated in this study.
| Origin | Mineral | Grain size (μm) |
|---|---|---|
| Qaidam Basin, dune sands | Quartz, Q-QB | 125–180 |
| Otindag Desert, dune sands | Quartz, Q-HD | 125–180 |
| Northern Tian Shan, fluvial sands | Quartz, Q-NTS; K-feldspar, F-NTS | 125–180 |
| DTU Risø laboratory | Quartz, Q-CAL | 90–180 |
| Shantou | Perthite, F-PST | 90–125 |
| Qaidam Basin, dune sands* | Quartz, 17YDE2C | 125–180 |
| Junggar Basin, dune sands* | K-feldspar, 15MNS01 | 125–180 |
The 125–180 μm quartz grains were extracted from the samples Q-QB, Q-HD, Q-NTS and 17YDE2C following the conventional chemical treatments (Aitken, 1998), while the 125–180 μm potassium feldspar (K-feldspar) grains were extracted from the samples F-NTS and 15MNS01, following the conventional chemical and density separation (ρ<2.58 g/cm3) procedures, e.g., Buylaert et al. (2009). The perthite (F-PST) was crushed and sieved to extract the 90–125 μm fraction, but without further chemical treatment.
Instruments
The DTU Risø TL/OSL DASH M 20 C/D reader, which is equipped with a 2.96 GBq β source, a built-in pulsing unit and photon timer TimeHarp 260, is employed for all luminescence measurements. The full power of the green (λ=525 nm), blue (λ=470 nm), and IR LEDs (λ=870 nm) are 42 mW/cm2, 86 mW/cm2 and 162 mW/cm2, respectively. The luminescence signals are stimulated at 90% of full power and detected by a photo-multiplier tube (PMT, module EMD-9107) for all three types of stimulation. For IR stimulation, the blue filter pack (BG3 and BG39) is employed. For the pulsed green light stimulation, only the 5 mm U-340 filter is used, while both the 5 mm and 2.5 mm U-340 filters are employed for the pulsed blue light stimulation. The steel stainless disc is used for mounting on the quartz and feldspar grains.
Methods
Firstly, we inspected the build-up and decay characteristics of the time-resolved post-IR PBLSL (TR-post-IR PBLSL) and time-resolved post-IR PGLSL (TR-post-IR PGLSL) signals of quartz and feldspars. Subsequently, the decay characteristic and the variation of intensity and counting error with the integration period were compared for the post-IR PBLSL and post-IR PGLSL signals of both quartz and feldspars. Then, the feldspars interference on the post-IR PBLSL and post-IR PGLSL signals of the hypothetically synthesised quartz-feldspar mixture was evaluated under different IR and pulsed blue or green light stimulation temperature. At last, the De values determined by using these two signals were compared by employing an artificially mixed sample with known-dose quartz and feldspar grains.
Two large aliquots (Φ=8 mm) were prepared for each sample to investigate the post-IR PBLSL and post-IR PGLSL characteristics (Q-QD, Q-HD, Q-CAL, Q-NTS, F-NTS and F-PST), with their natural signals being bleached by the SOL2 solar simulator for 8 hours. Twenty-four large aliquots (Φ=8 mm) were prepared for De determination for the quartz-feldspar mixture, which were made of the samples 17YDE2C and 15MNS01.
. RESULTS AND DISCUSSION
TR-post-IR PBLSL and TR-post-IR PGLSL signals
The time-resolved luminescence measurements were performed to investigate the build-up and decay characteristics of the post-IR PBLSL and post-IR PGLSL signals of all quartz and feldspars aliquots following steps 1–8 in Table 2. Since it is expected that the pulsed green light stimulation at a lower temperature would result in lower contribution from the feldspars, the time-resolved measurements were performed at 25°C. The detailed experimental parameters are as following: DR = 100 Gy, TIR = 125°C and TBL = TGL = 25°C. The on and off period of the pulsing are both 500 μs.
Table 2
Procedures for investigating the characteristics of post-IR PBLSL and post-IR PGLSL signals.
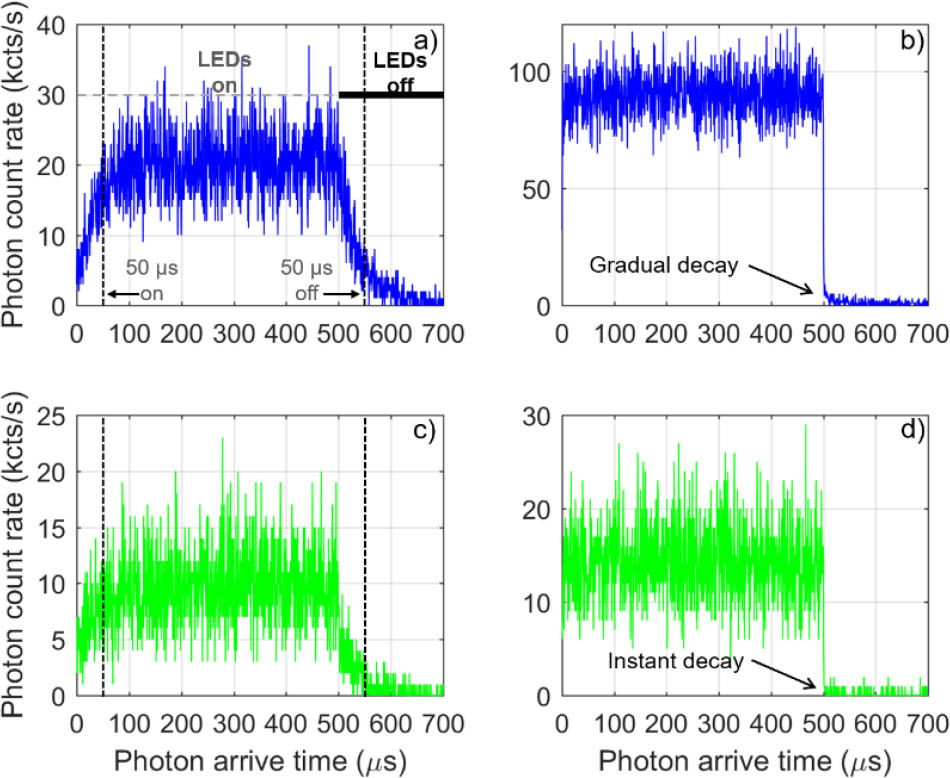
The build-up and decay characteristics are similar for the TR-post-IR PBLSL and TR-post-IR PGLSL curves of all samples, respectively. Typical curves of a quartz aliquot of Q-HD and a K-feldspar aliquot of F-NTS are shown in Fig. 1. The blue light stimulation results in two times and six times higher luminescence intensity than the green light stimulation for quartz of Q-HD and K-feldspars of F-NTS, respectively. It means that the luminescence intensity decreases more for the K-feldspar than for the quartz when the blue light stimulation is replaced by the green light stimulation, which helps suppress the feldspar contribution. During the off period, a gradual decaying component is observed for the TR-post-IR PBLSL signal of the K-feldspar (Fig. 1b), while an instant decay is observed for the TR-post-IR PGLSL signal (Fig. 1d). It coincides with the observation of Ankjærgaard et al. (2009) that the lifetime of the TR-post-IR PBLSL signal is longer than that of the TR-post-IR PGLSL signal for feldspars. Therefore, the delay between the switching off the light source and the onset of signal recording is shortened from 2.5 μs, which is commonly employed for the post-IR pulsed blue light stimulation, to 0.5 μs for the post-IR pulsed green light in this study to improve the signal to noise ratio of the post-IR PGLSL signal. Fig. 1 also shows that the build-up of post-IR PBLSL and post-IR PGLSL signals both finish in 50 μs, therefore, the on and off periods are both taken as 50 μs for the pulsed stimulation.
Fig. 1
Time resolved post-IR PBLSL and post-IR PGLSL curves of the quartz and K-feldspars. TR-post-IR PBLSL curves for a) bright quartz of Q-HD and b) K-feldspar of F-NTS, and TR-post-IR PGLSL curves for c) bright quartz of Q-HD and d) K-feldspar of F-NTS. The channel width is 512 ns and the photon count rate is the integration of signal during the initial 2.4 s stimulation. The curves are truncated at 700 μs for clarity. The vertical dashed lines in a) and c) indicate the timing of the end of on-period and off-period for the subsequent post-IR PBLSL and post-IR PGLSL measurements.
Post-IR PBLSL and post-IR PGLSL decay characteristics
Steps 1–8 of Table 2 were performed to investigate the post-IR PBLSL and post-IR PGLSL decay characteristics for all quartz and feldspar aliquots. For this experiment, the experimental parameters are taken as follows: DR = 60 Gy, TIR = 125°C and TBL = TGL = 25°C.
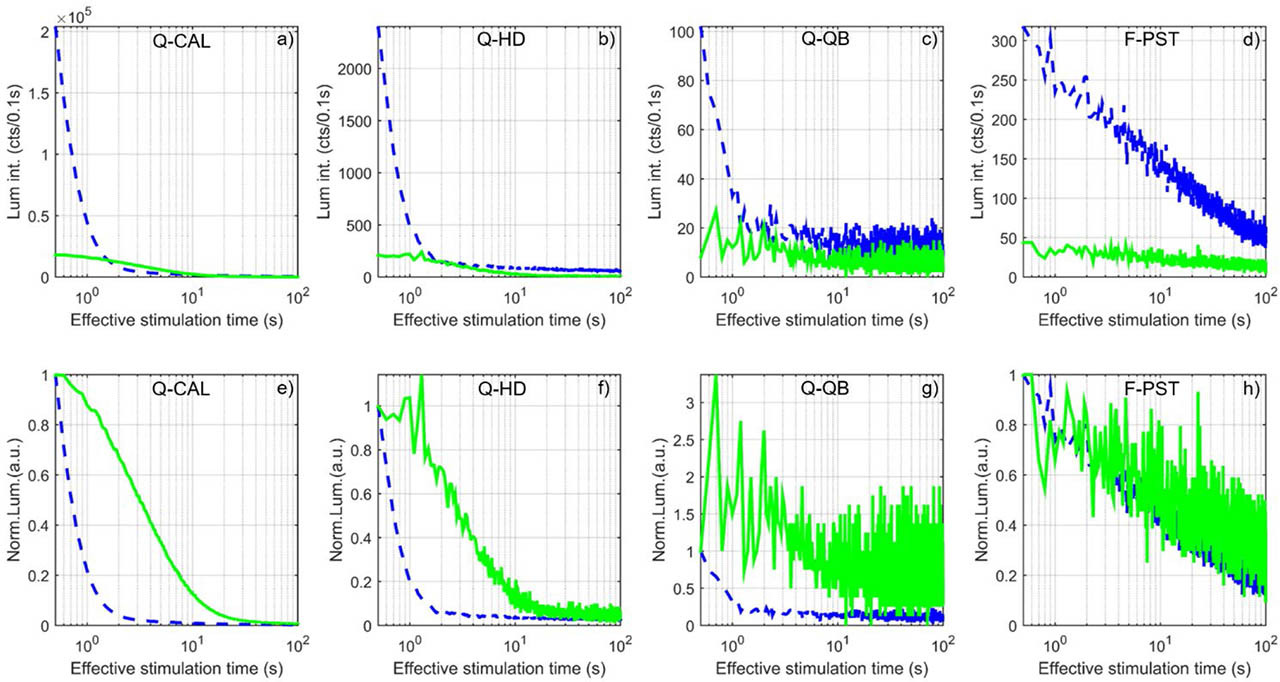
The initial intensity of the post-IR PBLSL signal is ~ four to ten times higher than that of the post-IR PGLSL signal for quartz aliquots of super-bright Q-CAL (Fig. 2a), bright Q-HD (Fig. 2b) and dim Q-QB (Fig. 2c), while the former is ~ seven times higher than the latter for the feldspars of the F-PST (Fig. 2d). The normalised post-IR PBLSL and post-IR PGLSL decay curves show that the post-IR PGLSL signal decays much slower than the post-IR PBLSL signal for quartz aliquots, irrespective of their luminescence sensitivity (Fig. 2e–2g). Fig. 2h shows that the two signals decay at a similar rate for feldspars. It implies that the signal to noise ratio of the post-IR PGLSL signal could be improved by increasing the integration period. Therefore, we investigated the effect of increasing the integration period on the signal to noise ratio.
Fig. 2
The raw and normalized post-IR PBLSL (dashed line) and post-IR PGLSL (solid line) decay curves for quartz and feldspars. a) and e) quartz of Q-CAL; b) and f) quartz of Q-HD; c) and g) quartz of Q-QB; d) and h) feldspar of F-PST. The effective stimulation time is calculated by multiplying the ratio of the on period to the sum of on and off period with the total stimulation time.
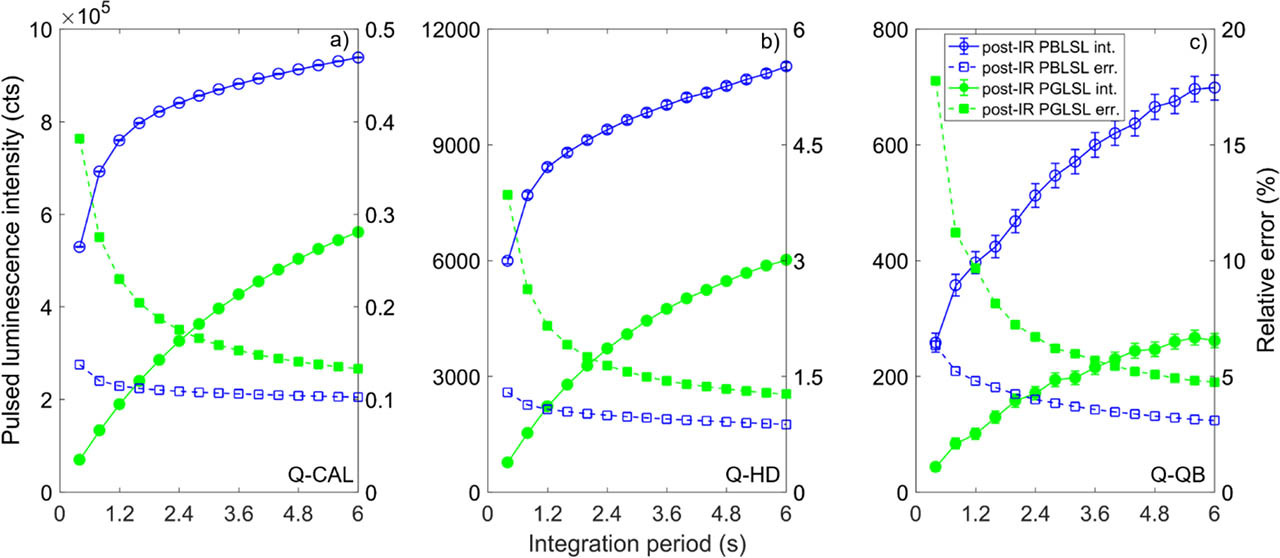
We adopted different periods to integrate the decay curves shown in Fig. 2a–2c to obtain the signal intensity, with a subtraction of the background intensity integrated within a period of 2.5 times that for the signal. The counting error of the integrated luminescence intensity is calculated following the method of Galbraith (2014), and is used as an index for the signal to noise ratio of the integrated post-IR PBLSL and post-IR PGLSL intensity. The post-IR PGLSL intensity (solid circle) increases significantly with the integration period, while the post-IR PBLSL intensity (open circle) shows a rapid increase within the 1.2 s integration period followed by a slower increase thereafter for the quartz aliquots of Q-CAL and Q-HD (Fig. 3a and 3b). Although a smaller increase is observed for the post-IR PGLSL signal of the dim quartz of Q-QB (Fig. 3c), these data suggest that with the elongated integration period, the post-IR PGLSL intensity is comparable with the post-IR PBLSL intensity. The relative counting error of the integrated post-IR PGLSL intensity (solid square) decreases from 0.4% to 0.15%, 4% to 1.4% and 18% to 5% with the integration period increasing from 0.4 s to 6 s for quartz of super-bright Q-CAL, bright Q-HD and dim Q-QB, respectively. These reduced counting errors are comparable with those of the post-IR PBLSL intensity (open square), for which the counting error only slightly varies with the integration period (Fig. 3). These results demonstrate that the signal to noise ratio of the quartz post-IR PGLSL signal could be substantially improved by increasing the integration period.
Variation of post-IR PBLSL and post-IR PGLSL intensity with stimulation temperature
The effect of stimulation temperature on the luminescence intensity of quartz and feldspars are quite different. With the increase of stimulation temperature, the luminescence intensity generally decreases for the BLSL signal of quartz (Spooner, 1994; Duller et al., 1995; Murray and Wintle, 1998; Bøtter-Jensen et al., 2003), but increases for the PGLSL signal of feldspars (Jain and Ankjærgaard, 2011).
Steps 1–9 of Table 2 were cycled to investigate the effect of stimulation temperature on the post-IR PBLSL and post-IR PGLSL intensity for both quartz and feldspars. The experimental parameters are taken as follows: DR = 60 Gy, TIR = 50°C, and TBL and TGL increase from 25°C to 200°C in an interval of 25°C. The initial 0.4 s (effective stimulation time) of the post-IR PBLSL and post-IR PGLSL decay curve is integrated as the signal intensity with a subtraction of the background intensity integrated from the last 1 s of the decay curve.
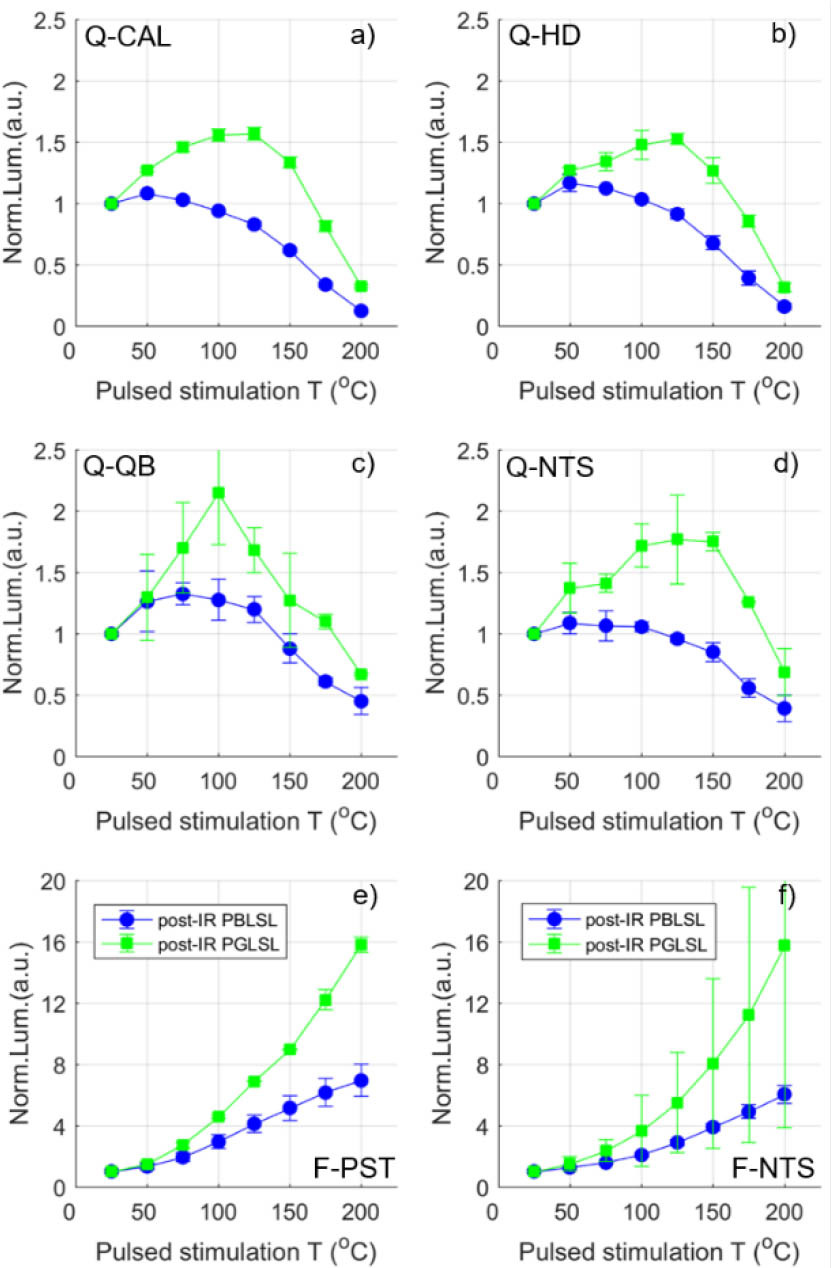
The variation of the normalised luminescence intensity with the stimulation temperature is shown in Fig. 4 (each data point is the average of two aliquots measured for each sample). For quartz, the post-IR PBLSL intensity slightly increases with the stimulation temperature increasing from 25°C to 75°C, followed by a decrease up to 80% with the stimulation temperature further elevated. The post-IR PGLSL intensity increases by about 1.5 to 2 times, with the stimulation temperature increasing up to 125°C ~ 150°C, followed by a decrease of up to 70% (Fig. 4a–4d). However, for K-feldspar of F-NTS and perthite of F-PST, the post-IR PGLSL and post-IR PBLSL intensities increase monotonically and more significantly with the increase of stimulation temperature (Fig. 4e–4f). These results suggest that increasing the stimulation temperature help increase quartz post-IR PGLSL intensity, but at the expense of more contribution from the feldspars if the post-IR PGLSL signal of the quartz-feldspar mixture were measured.
Fig. 4
Variation of the normalized post-IR PBLSL (circle) and post-IR PGLSL (square) intensity on the pulsed stimulation temperature for quartz and feldspars. a) Q-CAL; b) Q-HD; c) Q-QB; d) Q-NTS; e) F-PST and f) F-NTS. The signal intensity was integrated using the initial 0.4 s effective stimulation time with subtraction of the integration of the last 1 s effective stimulation time.
To quantify the relative contribution of the feldspars to the total luminescence signal of the quartz-feldspar mixture, the post-IR PBLSL and post-IR PGLSL decay curves of a quartz aliquot and a feldspar aliquot were summed as the post-IR PBLSL and post-IR PGLSL decay curves of a hypothetical aliquot of the quartz-feldspar mixture, respectively. Subsequently, the luminescence intensities were calculated for the post-IR PBLSL (PGLSL) signal of the feldspars (Lf) and the mixture (Lq + f), respectively, by employing different integration periods. The ratio of Lf to Lq + f (Lf/Lq + f) is taken as the relative contribution of feldspars.
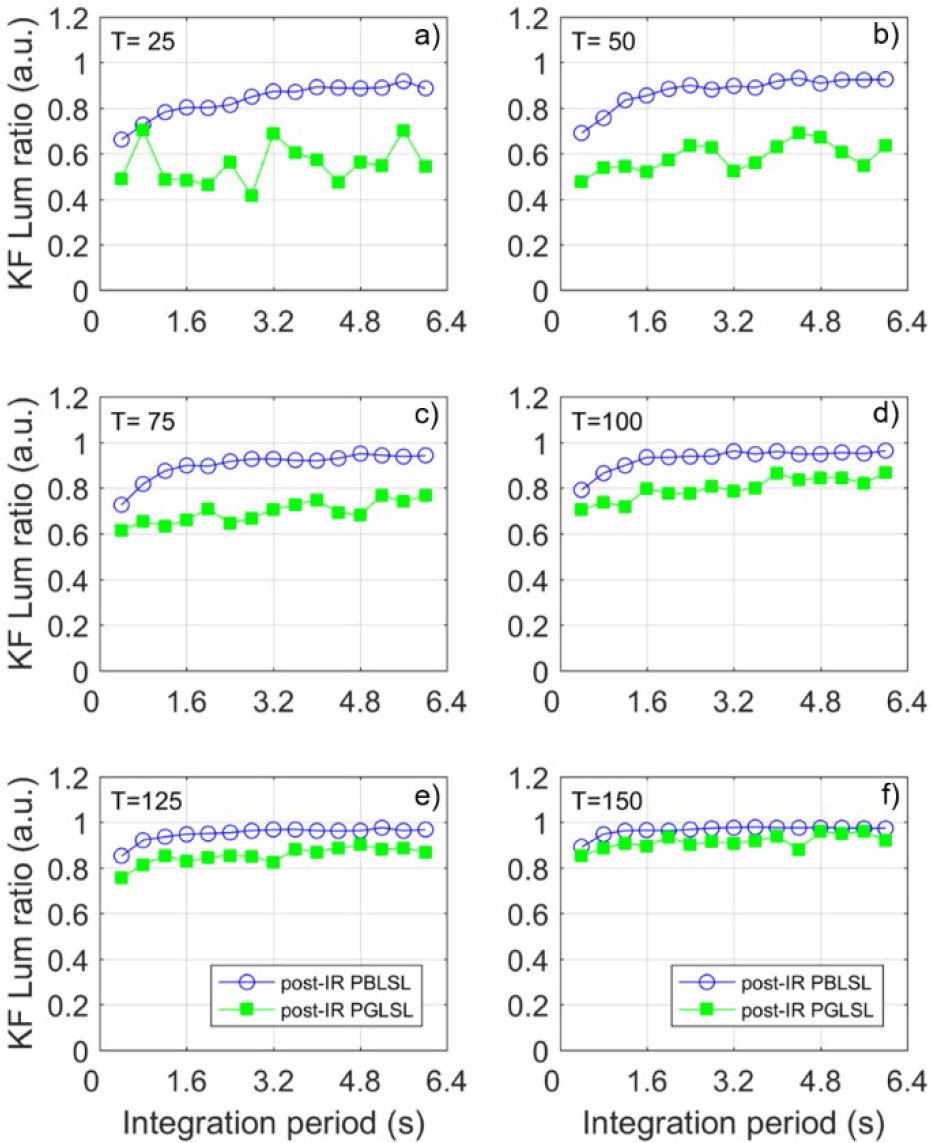
Fig. 5 and Fig. 6 show the dependence of Lf/Lq + f on the integration period under various stimulation temperature for the hypothetic mixture of the feldspar with bright quartz Q-HD and dim quartz Q-NTS, respectively. For the hypothetic mixture with bright quartz of Q-HD, the feldspar contribution to the post-IR PGLSL signal shows a negligible increase with the integration period at low stimulation temperature, while a sharp increase is observed for the post-IR PBLSL signal (Fig. 5). With elevating the stimulation temperature, the feldspar contribution increases significantly with the integration period for the post-IR PGLSL signal. With the same integration period, the feldspar contribution increases with the stimulation temperature for the post-IR PGLSL signal. Fig. 5 unambiguously shows that the feldspar contribution to the post-IR PGLSL signal is lower than that to the post-IR PBLSL signal at any stimulation temperature, especially at low temperature. For the hypothetic mixture with dim quartz of Q-NTS, the feldspar contribution to the post-IR PGLSL signal is also the lowest and shows little dependence on the integration period at 25°C (Fig. 6), but the absolute feldspar contribution is much higher than that the mixture with Q-HD. Therefore, the low stimulation temperature, e.g., 25°C, is preferred for pulsed green light stimulation to suppress the feldspar contribution.
Fig. 5
Variation of the relative feldspar contribution to the post-IR PBLSL (open circle) and post-IR PGLSL (solid square) signals with the integration period for the hypothetical quartz (Q-HD) and feldspar (F-NTS) mixture under various pulsed stimulation temperatures. a) 25°C; b) 50°C; c) 75°C; d) 100°C; e) 125°C and f) 150°C.
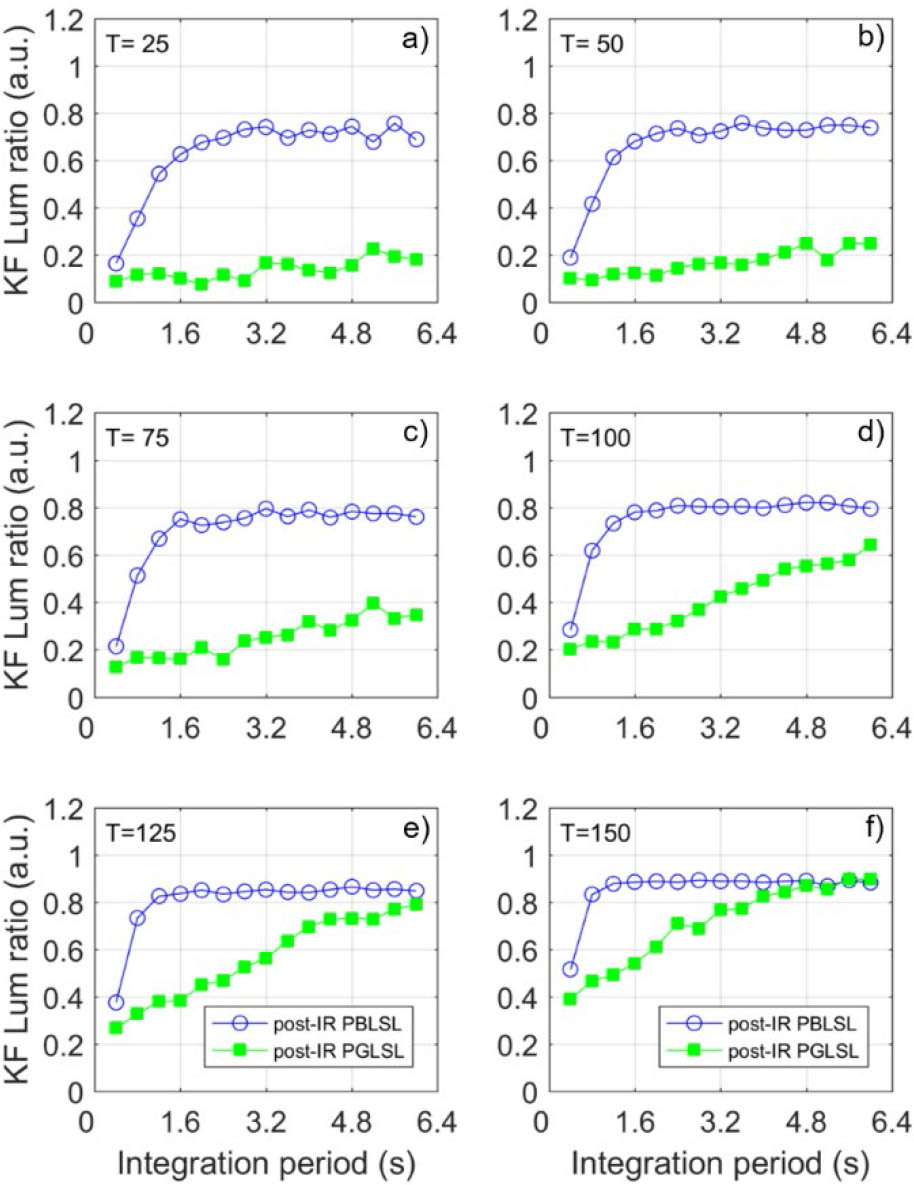
Fig. 6
Variation of the relative feldspar contribution to the post-IR PBLSL (open circle) and post-IR PGLSL (solid square) signals with the integration period for the hypothetical quartz (Q-NTS) and feldspar (F-NTS) mixture under various pulsed stimulation temperatures. a) 25°C; b) 50°C; c) 75°C; d) 100°C; e) 125°C and f) 150°C.
Effect of IR stimulation temperature on feldspar contribution
Increasing the IR stimulation temperature has dual effects on the feldspars contribution to the post-IR PGLSL signals. On the one hand, it would help remove more trapped electrons sensitive to the green light stimulation for the feldspars, since more electron-hole pairs contributing to post-IR PGLSL signal would be consumed by the prior IR stimulation; one the other hand, the high-temperature IR stimulation, e.g., higher than 120°C, may deplete the fast component BLSL signal of quartz (Jain et al., 2003). Therefore, the effect of IR stimulation temperature on the contribution of feldspar to the post-IR PGLSL signal needs to be investigated.
Steps 1–9 of Table 2 were applied to all quartz and feldspar aliquots for this experiment, with DR = 60 Gy, TBL = TGL = 25°C. These steps were repeated with the IR stimulation temperature TIR increasing from 50°C to 225°C in an interval of 25°C. The initial 0.4 s (effective stimulation time) of the post-IR PBLSL and post-IR PGLSL decay curves were integrated as the signal intensity with a subtraction of the last 1 s (effective stimulation time) integration as background. The averaged intensity of two aliquots of one sample was taken for analysis.
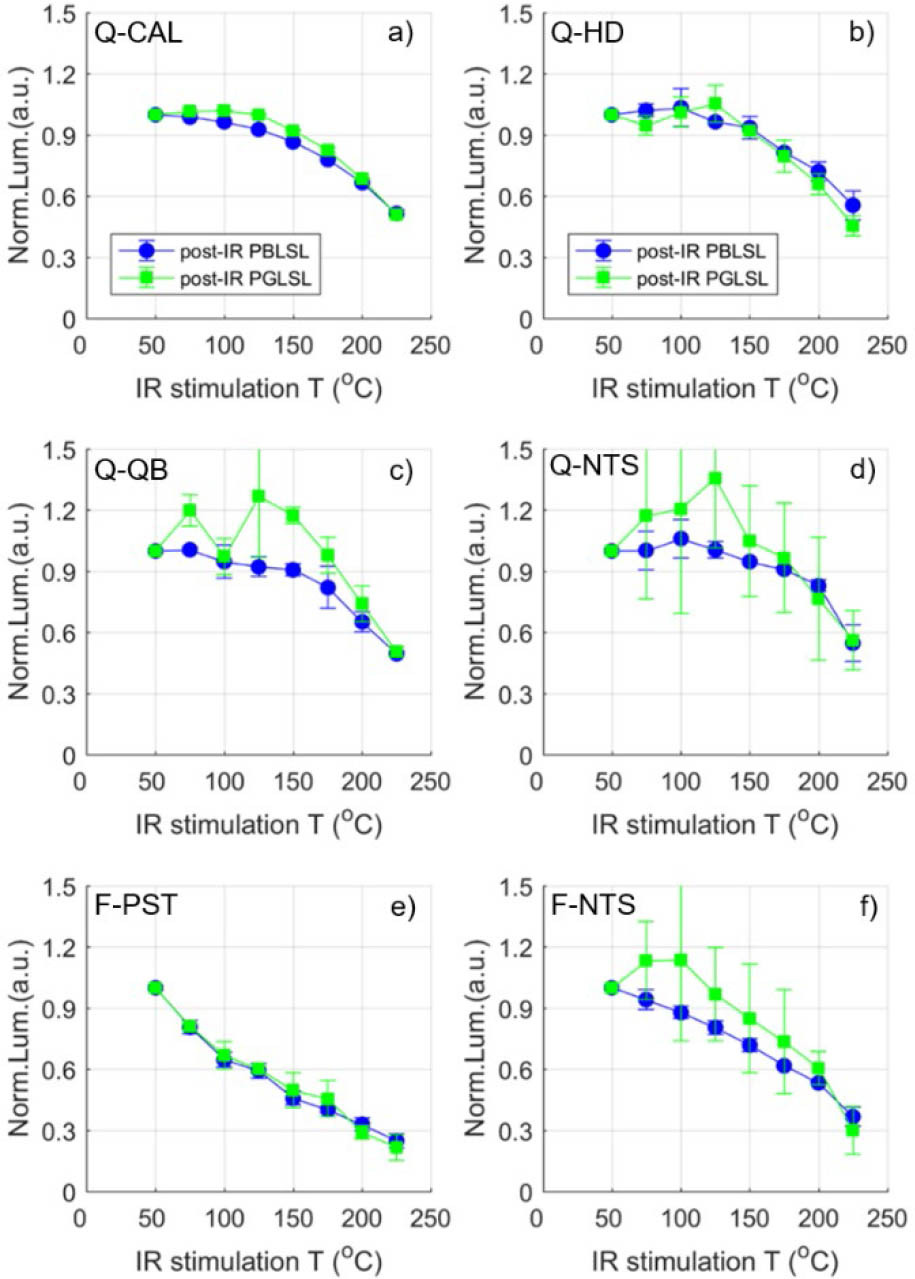
The post-IR PBLSL and post-IR PGLSL intensities of quartz do not change much with the prior IR stimulation temperature increasing from 50°C to 125°C, but decreases by 50% with the temperature further increased to 225°C (Fig. 7a–7d). For the feldspars, the post-IR PBLSL and post-IR PGLSL intensity monotonically decrease by up to 60% with the prior IR stimulation temperature increasing from 50°C to 125°C, followed by a further decrease by 30% (Fig. 7e and 7f). To balance the reduction of post-IR PGLSL intensity for both quartz and feldspars, the IR stimulation temperature of 125°C is preferred for the dim quartz, while it might be increased for the bright quartz as long as the signal to noise ratio is acceptable.
Fig. 7
Variation of the normalized post-IR PBLSL (circle) and post-IR PGLSL (square) intensity with the temperature of IR stimulation prior to the pulsed stimulation for quartz and feldspars. a) Q-CAL; b) Q-HD; c) Q-QB; d) Q-NTS; e) F-PST and f) F-NTS. The signal intensity was integrated using the initial 0.4 s effective stimulation time with subtraction of the integration of the last 1 s effective stimulation time.
Equivalent dose measurements
The above results demonstrate that the post-IR pulsed green light stimulation performs better on isolating quartz dominated luminescence signal than the post-IR pulsed blue light stimulation. In this session, their performances on suppressing the feldspar interferences were evaluated by employing both two signals to determine the De value of the artificial quartz-feldspar mixture.
For this experiment, the quartz grains extracted from the dune sands of 17YDE2C were mixed with the K-feldspar grains extracted from the modern dune sands of 15MNS01, in a mass ratio of 2:1. The De value obtained by using the conventional BLSL signal is ~ 120 Gy for the quartz of 17YDE2C, while the De value of the modern K-feldspar grains is ~ 0 Gy. The single aliquot regenerative dose (SAR) based pulsed stimulation procedure (Tsukamoto and Rades, 2016) was employed to determine the De value of the mixture. The preheat and cut-heat are 260°C – 10 s and 220°C – 5 s, respectively. The pulsed (50 μs on period and 50 μs off period) blue or green light stimulation for 200 s, at either 25°C (suggested by this study) or 125°C (conventionally employed), was performed following a prior IR stimulation at 125°C for 100 s. Twelve aliquots were measured for each procedure.
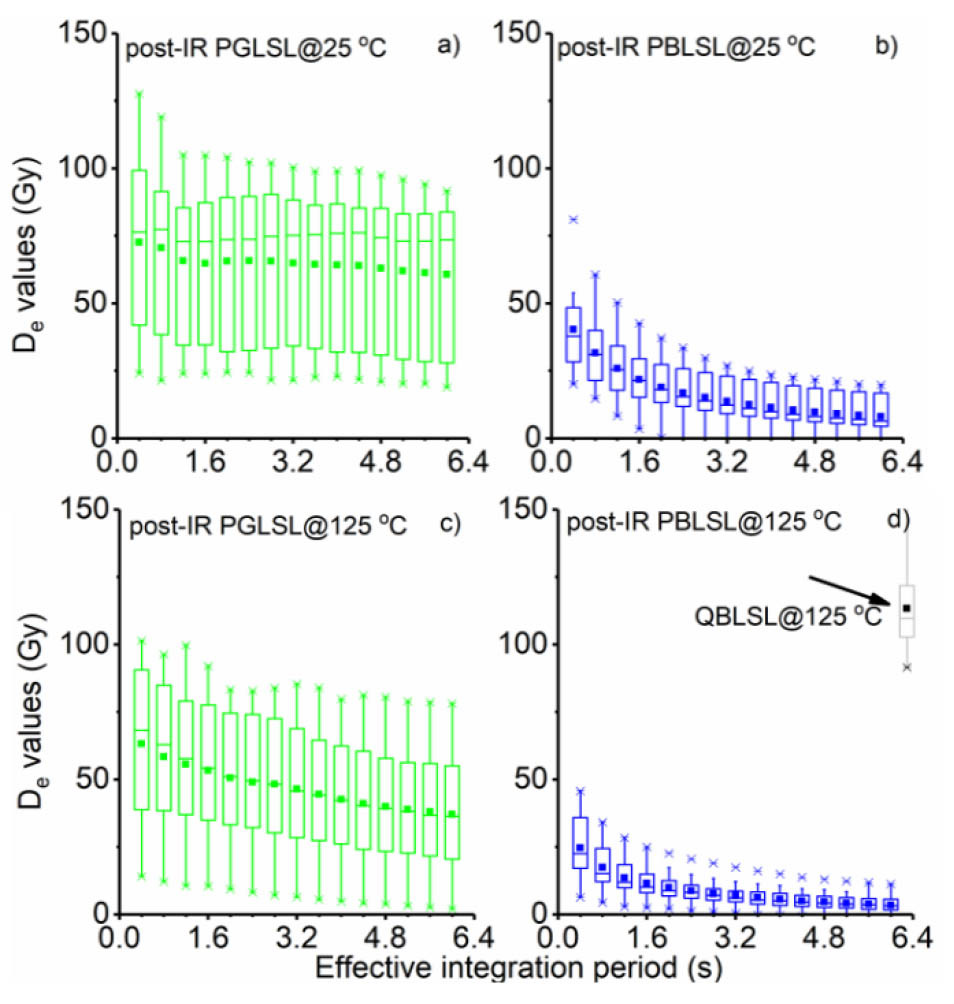
The median of post-IR PGLSL De measured at 25°C is ~ 80 Gy and almost independent of the integration period (Fig. 8a), while the median of post-IR PBLSL De decreases significantly from ~ 40 Gy to ~ 10 Gy with the increase of integration period (Fig. 8b). With the stimulation temperature increased to 125°C, the median of post-IR PGLSL De is ~ 80 Gy with the effective integration period of 0.4 s but decreases gradually to 40 Gy with the effective integration period increased to 6 s (Fig. 8c). The post-IR PBLSL De values measured at 125°C are much lower than those measured at 25°C, and tend to be zero with the elongated integration period (Fig. 8d). The ratio of the post-IR PGLSL De values to the post-IR PBLSL De values are almost two with the short integration period, while such ratio further increases with the more elongated integration period. These results show unambiguously that the post-IR PGLSL signal performs much better than the post-IR PBLSL signal on determining De values of feldspars contaminated quartz grains.
Fig. 8
Box plots of De values measured by various measurement procedures. a) post-IR PGLSL and b) post-IR PBLSL stimulated at 25°C; c) post-IR PGLSL and d) post-IR PBLSL stimulated at 125°C. The De value determined by the conventional BLSL signal of quartz of 17YDE2C is shown in d).
However, the post-IR PGLSL De is still one third lower than the De value determined by pure quartz grains. The feldspar contribution is much more exaggerated for this artificially mixed sample than for the natural sample, with respect to the feldspar mass ratio and the De difference between quartz and feldspar of the natural samples. The impact of the medium and slow component on De determination needs to be investigated in future if the elongated integration period is employed. The effect of shallow trap re-trapping on De determination at low stimulation temperature also needs to be considered with respect to the signal stability, dose recovery ratio as well as the De dispersion (Murray and Wintle, 2000). If the stimulation temperature has to be as high as 125°C, the prior IR stimulation temperature might be further elevated correspondingly to eliminate the electron-hole pairs contributing to the post-IR PGLSL signal. It is also worthwhile to investigate the feasibility of increasing the power of the green light source of the luminescence reader or even using the post-IR continuous green light stimulation to measure De values of feldspar contaminated quartz sample.
. CONCLUSION
We investigated the post-IR PBLSL and post-IR PGLSL characteristics of quartz and feldspar grains of a variety of origins in this study. Our results demonstrate that the feldspar contribution is, in general, lower for the post-IR PGLSL signal than for the post-IR PBLSL signal of the quartz-feldspar mixture. At low stimulation temperature, e.g., 25°C, the relative feldspars contribution is independent of the integration period for the post-IR PGLSL signal, which enables a long integration period to be adopted to improve the signal to noise ratio. The De values measured for the artificial quartz-feldspar mixture by using the post-IR PGLSL signal are almost twice of those determined using the post-IR PBLSL signal and closer to the expected De values, under both low (25°C) and high (125°C) stimulation temperature. Therefore, we propose to employ the post-IR PGLSL signal for De determination for the feldspar contaminated quartz samples, although further investigation on the effect of re-trapping at low stimulation temperature is still needed.