
. INTRODUCTION
Optically stimulated luminescence (OSL) dating is used to measure the period from the present to a mineral's last exposure to sunlight (Aitken, 1998). In order to obtain an OSL age, the equivalent dose (De) that minerals received after burial, together with the dose rate, need to be measured. The two minerals most commonly used for OSL dating are quartz and K-feldspar. Compared with quartz, the infra-red stimulated luminescence (IRSL) signal of K-feldspar has several advantages, such as high signal intensity, high internal dose rate, late saturation and uniform behaviour (e.g. Duller, 1997; Huntley and Lamothe, 2001; Li et al., 2007). However, OSL dating with K-feldspar has been hampered by the anomalous fading behaviour of the IRSL signal (e.g. Wintle, 1973; Spooner, 1992; 1994).
Notably, it was reported that the IRSL signal stimulated at a high-temperature following a preceding low-temperature IR stimulation was much more stable (Thomsen et al., 2008; 2011; Li and Li, 2011a). A two-step post-IR IRSL (pIRIR) dating protocol was proposed with the first stimulation at 50°C and the second stimulation at 225°C or 290°C (e.g. Buylaert et al., 2009; Thiel et al., 2011). However, subsequent studies indicated that the pIR50IR290 signal would still underestimate the age when De exceeded 500 Gy, since a small degree of fading still exists for this signal (Li and Li, 2012a; Li et al., 2014; Stevens et al., 2018). Consequently, the first stimulation temperature was increased to 200°C for the dating of relatively old samples (e.g. Li and Li, 2012a; Buylaert et al., 2015; Stevens et al., 2018).
A multiple-elevated-temperature post-IR IRSL (MET-pIRIR) dating protocol has been established with five or six steps of IR stimulation from 50°C to 250°C or 300°C, with an interval of 50°C (Li and Li, 2011b; 2012b). The anomalous fading test indicated that the fading rates of the MET-pIRIR signals at 250°C or 300°C were negligible (Li and Li, 2011b; 2012b). In order to extend the maximum dating limit, a protocol was proposed based on the dose-dependent sensitivity of MET-pIRIR signals using the multiple-aliquot regenerative-dose (MAR) protocol (Li et al., 2013; Chen et al., 2015). In this protocol, two repeated test doses were added after the regenerative dose, with a ‘cut-heat to 500°C’ treatment administered before the second test dose. With this protocol, the maximum dating limit of De was increased to ∼1500 Gy (Li et al., 2013; Chen et al., 2015). Here, we use the term ‘MAR with heat’ to represent this protocol.
In the present study, K-feldspar samples from the Jingbian site on the northern margin of the Chinese Loess Plateau were dated using five pIRIR protocols: four SAR (pIR50IR290, pIR200IR290, MET-pIRIR250, MET-pIRIR300) protocols, and the ‘MAR with heat’ protocol. Subsequently, the De values obtained with the five protocols were compared.
. SAMPLES AND MEASUREMENTS
Sample description
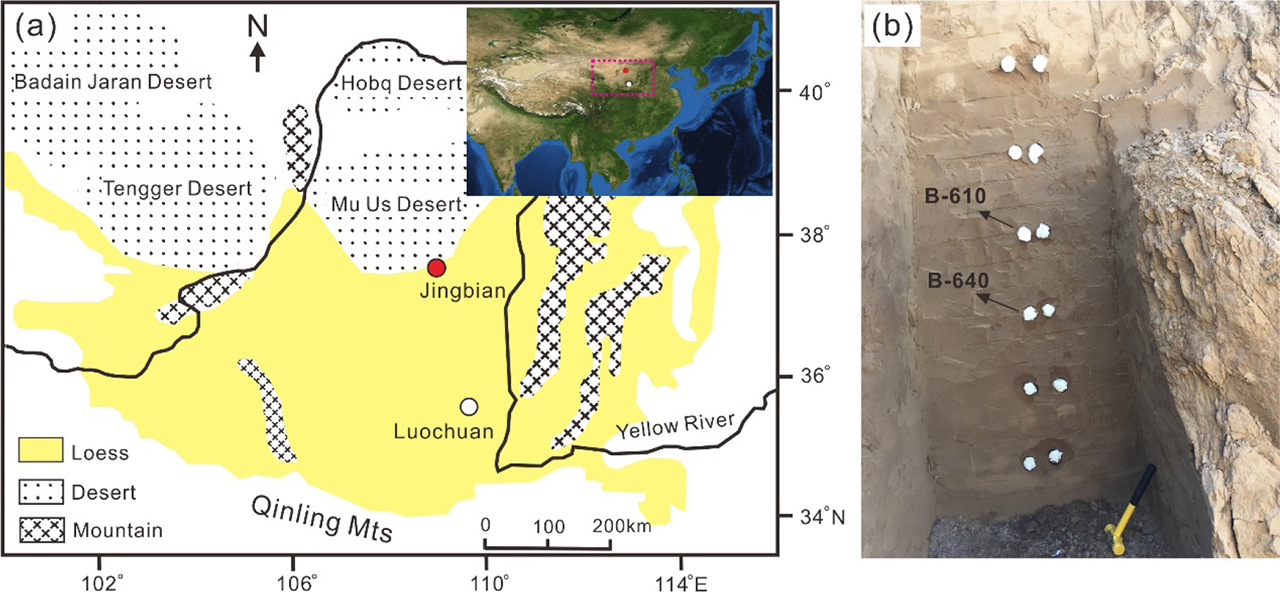
Samples were collected from two loess sections (A and B) at the Jingbian loess site, which is located on the northern margin of the Chinese Loess Plateau, adjacent to the Mu Us Desert (Fig. 1a). Paleoclimatic reconstructions and OSL dating have previously been conducted at the site (e.g. Ding et al., 2005; Buylaert et al., 2015; Stevens et al., 2018). Fine sand grains in this section are relatively abundant, ensuring sufficient coarse K-feldspar grains for the measurements. The well-bleached nature of loess samples makes them well suited for testing dating protocols. The samples were collected using stainless steel tubes to avoid light exposure (Fig. 1b). In section A, two samples were collected from the S1 and S2 paleosol layers, respectively; and in section B, four samples were collected from the layer which was assumed to be S2 based on field observation (e.g. colour, moisture).
Sample preparation and measurements
Sample pretreatment was performed in a dark room under subdued red light. Sample material from the two ends of the tubes was removed, and then the inner part was wet sieved to separate the >63 μm fraction, which was then successively treated with 10% HCl and 30% H2O2 solutions to remove carbonates and organic matter, respectively. The samples were then rinsed several times with water, oven-dried at 50°C overnight, and then dry sieved. The 90–125 μm fraction was used to separate K-feldspar grains, using a sodium poly-tungstate solution (ρ <2.58 g/cm3). K-feldspar grains were immersed in 10% HF solution, with magnetic stirring, for ∼15min, in order to remove the outer layer exposed to alpha irradiation. According to Duval et al. (2018), this treatment is sufficient to remove the outer 10 μm of K-feldspar grains. Etched K-feldspar grains were then mounted on steel discs with silicone oil. The IRSL measurements were performed using a Risø-TL/OSL-20 reader, with a filter package comprising a Schott BG-39 and Corning 7–59. The attached 90Sr/90Y beta source had a dose rate of 0.14 Gy/s on the steel discs. The first 10 s of the decay curve was integrated as the signal, with the final 10 s integrated as background. Details of the protocols are listed in Table 1.
Table 1
The five post-IR IRSL dating protocols used in this study. The first four are the SAR protocols with pIR50IR290, pIR200IR290, MET-pIRIR250 and MET-pIRIR300 signals, respectively. The fifth is the MAR protocol with the MET-pIRIR300 signal and a ‘cutheat to 500°C’ treatment added before the test dose, simplified as ‘MAR with heat’ (modified from Li et al. (2013)).
In addition, the low-frequency magnetic susceptibility (MS) of dried samples was measured using a Bartington Instruments MS2 meter. Measurements were repeated three times, and the mean values were normalised by the sample weights to obtain the mass-specific MS (10−8 m3/kg).
De and dose rate estimations
Standard growth curves (SGCs) were constructed to save measurement time. SGC constructions for the SAR protocols applied the least-squares normalisation (LS-normalization) method implemented with the R package ‘numOSL’ (Li et al., 2016; 2017a; 2018; Peng and Li, 2017). In order to obtain De with the SAR SGC, aliquots were measured using two cycles, with the first cycle measuring the sensitivity-corrected natural signal (Ln/Tn), and the second cycle measuring the sensitivity-corrected signal (Lx/Tx) of a regenerative dose. Details of the calculation of De have been presented previously (Li et al., 2015a, 2015b; 2017a; Zhang and Li, 2019). As the size of the test dose affects the shapes of growth curves, test doses were fixed at 300 Gy for SGC construction and De measurements.
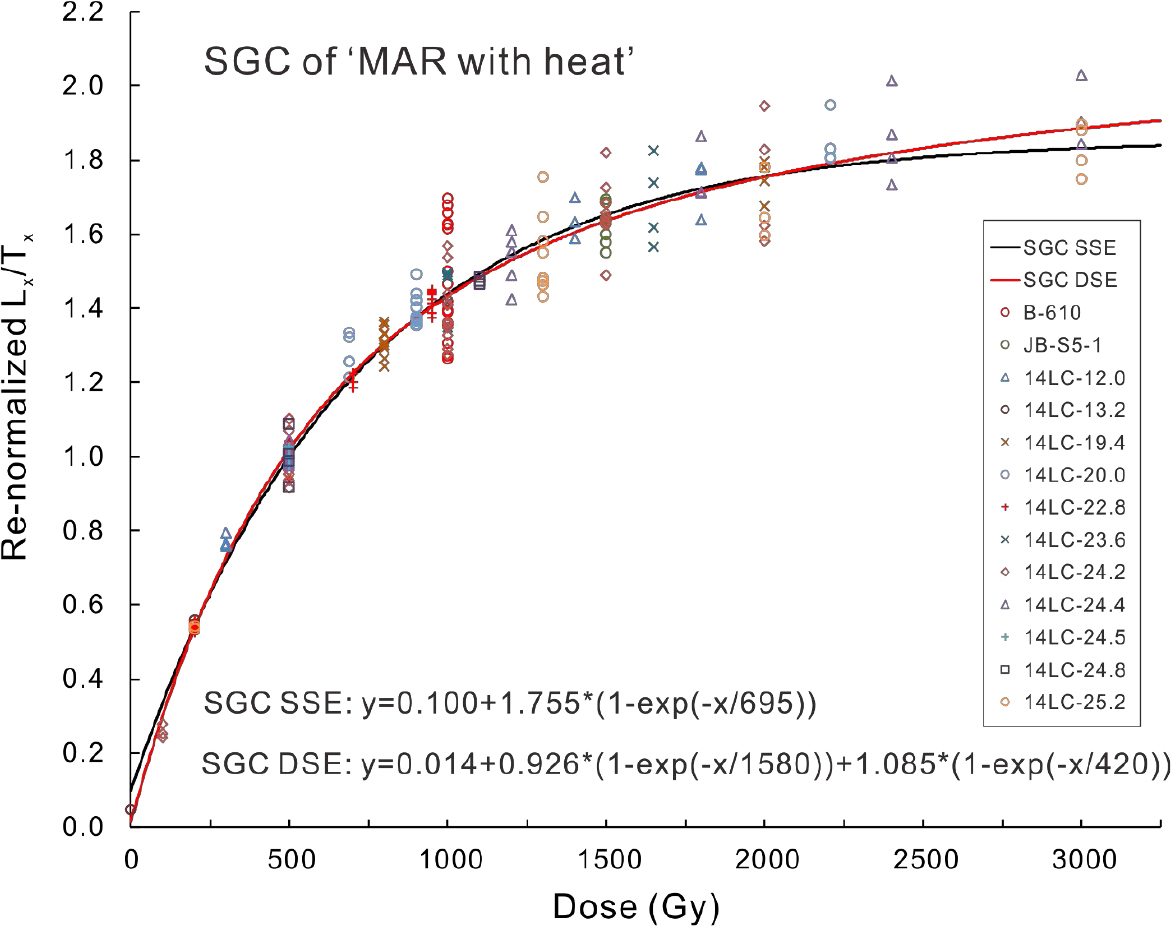
For the “MAR with heat” protocol, samples from both the Jingbian section and the Luochuan section were used to construct the MAR SGC. Test doses were fixed at 100 Gy. Aliquots were first bleached using the ORIEL solar simulator (Newport Corporation, model 94042A) with a 1000W xenon arc lamp for more than 8 hr. Experiments showed that the residual doses of the MET-pIRIR300 signals are reduced to ∼10 Gy after bleaching for 8 hr (Fig. 2). Bleached aliquots were divided into several groups, with different doses administered. For each sample, a group of aliquots was given a dose of 500 Gy. The average Lx/Tx of the aliquots with 500 Gy was used to re-normalise the Lx/Tx values of all the aliquots for each sample, and the re-normalised Lx/Tx values were plotted against the doses and fitted with a single or double saturating exponential function (Fig. 3). The growth curve with the single saturating exponential function can be expressed as y = 0.100+1.755*(1–exp(–x/695)). In order to measure De with the MAR SGC, two groups of aliquots were prepared. One group of aliquots was used to measure the natural signal (Ln/Tn), and the other group of aliquots was bleached for more than 8 hr and then given a specific dose that was close to De, and the signals were measured (Lx/Tx). The average Ln/Tn of aliquots in the first group was normalised by the average Lx/Tx of aliquots in the second group, in order to calculate De. Outliers of the individual Ln/Tn or Lx/Tx values were identified and rejected by comparing the absolute deviation from the median value and the median absolute deviation using the criterion of 2.5 (Rousseeuw et al., 2006; Hu et al., 2019). The error in De was estimated using the error propagation formula.
Fig. 2
Residual doses of IRSL signals stimulated at different temperatures using the SAR MET-pIRIR protocol. After 8 hr of bleaching with the solar simulator, the residual doses were reduced to ∼10 Gy for the MET-pIRIR300 signal.
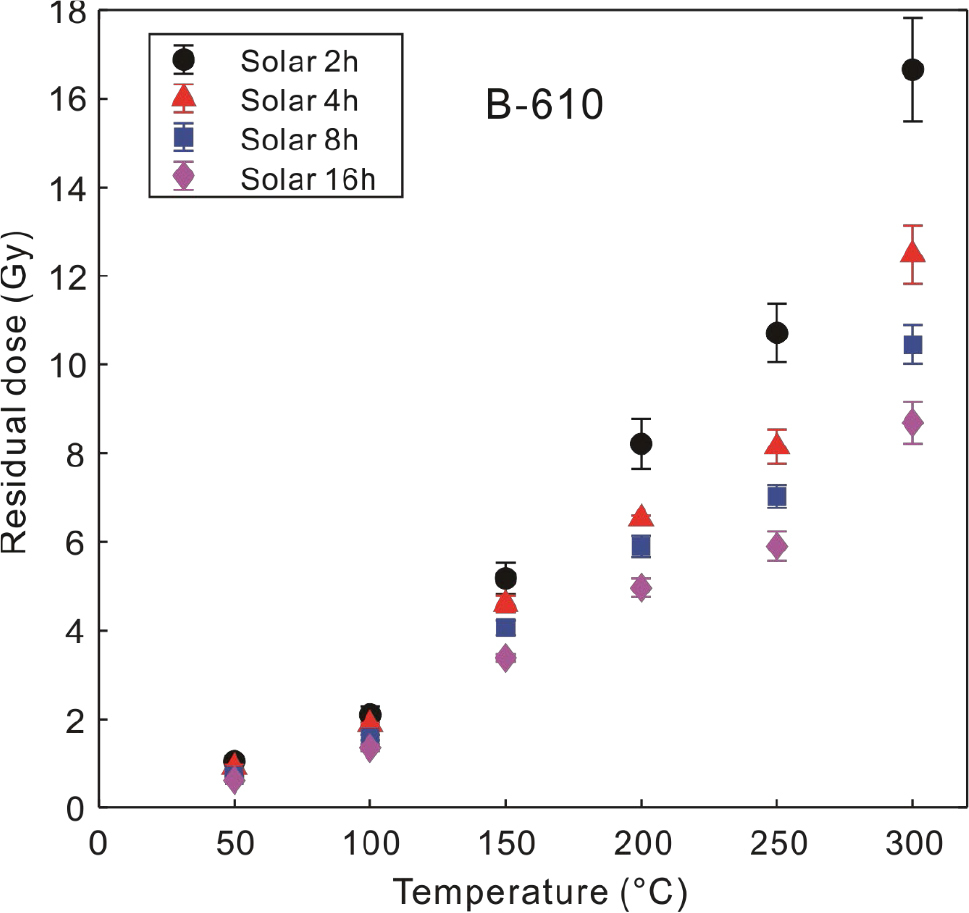
Fig. 3
Standard growth curve (SGC) of the ‘MAR with heat’ protocol. The re-normalisation dose was 500 Gy. SGC curves were fitted with the single saturating exponential (SSE) function: y = y0 + A*(1-exp(-x/D0)) and the double saturating exponential (DSE) function: y = y0 + A1*(1-exp(-x/D1)) + A2*(1-exp(-x/D2)), respectively. The fitted results are shown in the graph. Note that the two SGCs only begin to diverge when the dose exceeds 2000 Gy.
Environmental dose rates were also estimated. Thick source alpha counting was performed to quantify the contribution of U and Th to the dose rate, and the K content of the whole rock was measured by X-ray fluorescence (XRF) analysis. Conversion factors were adopted from Adamiec and Aitken (1998). The internal K and Rb concentrations of the K-feldspar were assumed to be 13 ± 1% and 400 ± 100 ppm, respectively (Huntley and Baril, 1997; Zhao and Li, 2005). The dose rate of cosmic rays was calculated according to the sampling altitude, depth, and geomagnetic latitude (Prescott and Hutton, 1994). For the Jingbian section, the water content was generally set as 15 ± 5% for samples in paleosol layers, and 10 ± 5% for samples in loess layers (Stevens et al., 2018). However, for sample B-610, where an MS peak was located, the water content was measured to be 19.3% for sample material from the inner part of the sampling tube, and we adopted the measured water content for dose rate calculation. Because of the close similarity of depths and MS values between samples B-610 and B-640, we assumed that sample B-640 also had a water content of 19.3 ± 5%.
. RESULTS
The De values of the two sections are listed in Table 2, and the dose rates and corresponding ages are listed in Table 3. The residual doses are not considered as they are negligible compared to the De values (Fig. 2). In section A, for the sample from paleosol S1 (A-570), the De values are consistent (∼400 Gy) between the protocols. However, for the sample from paleosol S2 (A-1050), with the SAR protocol, the De values are ∼620 Gy for the pIR50IR290 signal and ∼700 Gy for the pIR200IR290 and MET-pIRIR250 signals. With the ‘MAR with heat’ protocol, De increased to ∼750 Gy.
Table 2
De values obtained using the five protocols. In the ‘MAR with heat’ protocol, the first ‘n’ indicates the aliquots used to measure the natural signal, and the second refers to the aliquots used to measure the signal of a regenerative dose.
Table 3
Dose rates and ages of the samples using the five protocols.
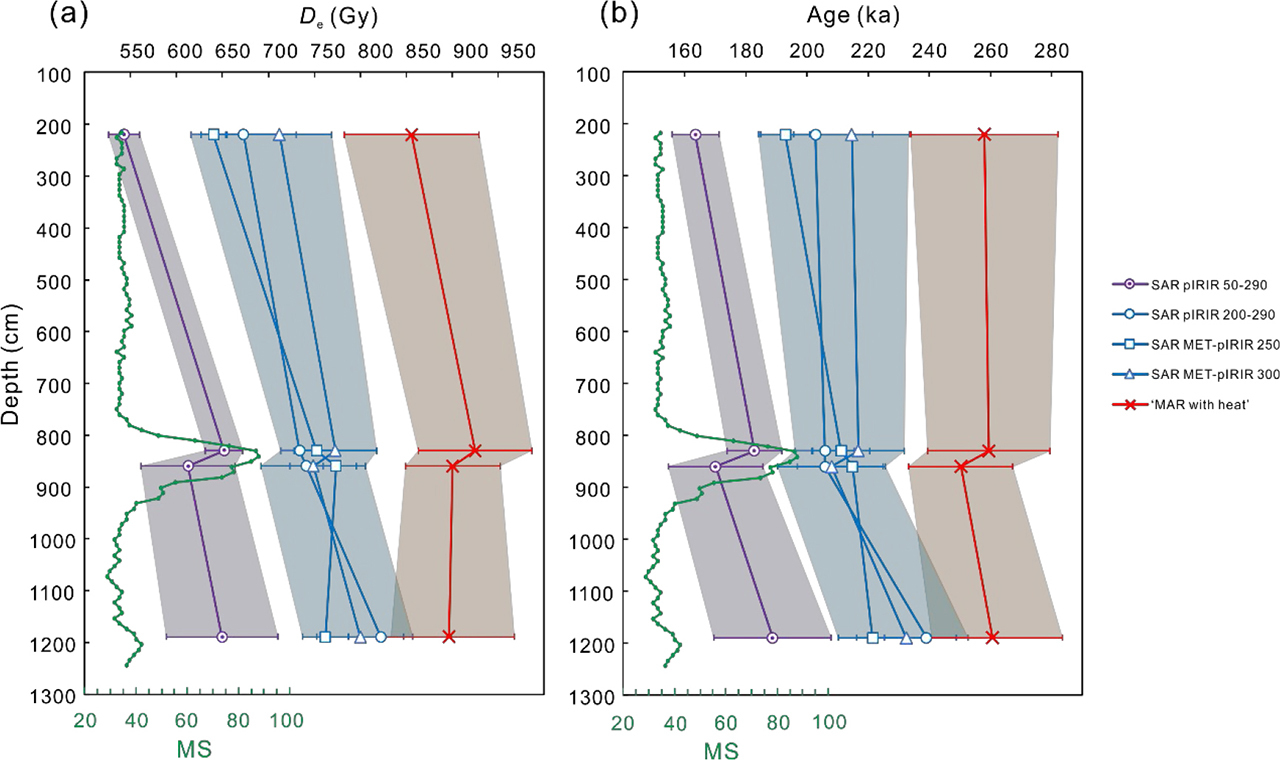
In section B, the De values and ages of samples are plotted against depth in Fig. 4. The De values are overall greater than 500 Gy. With the SAR protocol, the pIR50IR290 signal always gave the smallest De values (540–650 Gy), while the pIR200IR290, MET-pIRIR250, MET-pIRIR300 signals generally had consistent De values (640–820 Gy). However, all of the SAR De values are smaller than those of the ‘MAR with heat’ protocol with the MET-pIRIR300 signal (860–930 Gy). The ages of the four samples are 160–190 ka for the pIR50IR290 signal, and 190–240 ka for the pIR200IR290, MET-pIRIR250, MET-pIRIR300 signals with the SAR protocol. With the ‘MAR with heat’ protocol, the ages are 250–260 ka (excluding the error).
. DISCUSSION
Possible cause of De underestimation with the SAR protocol
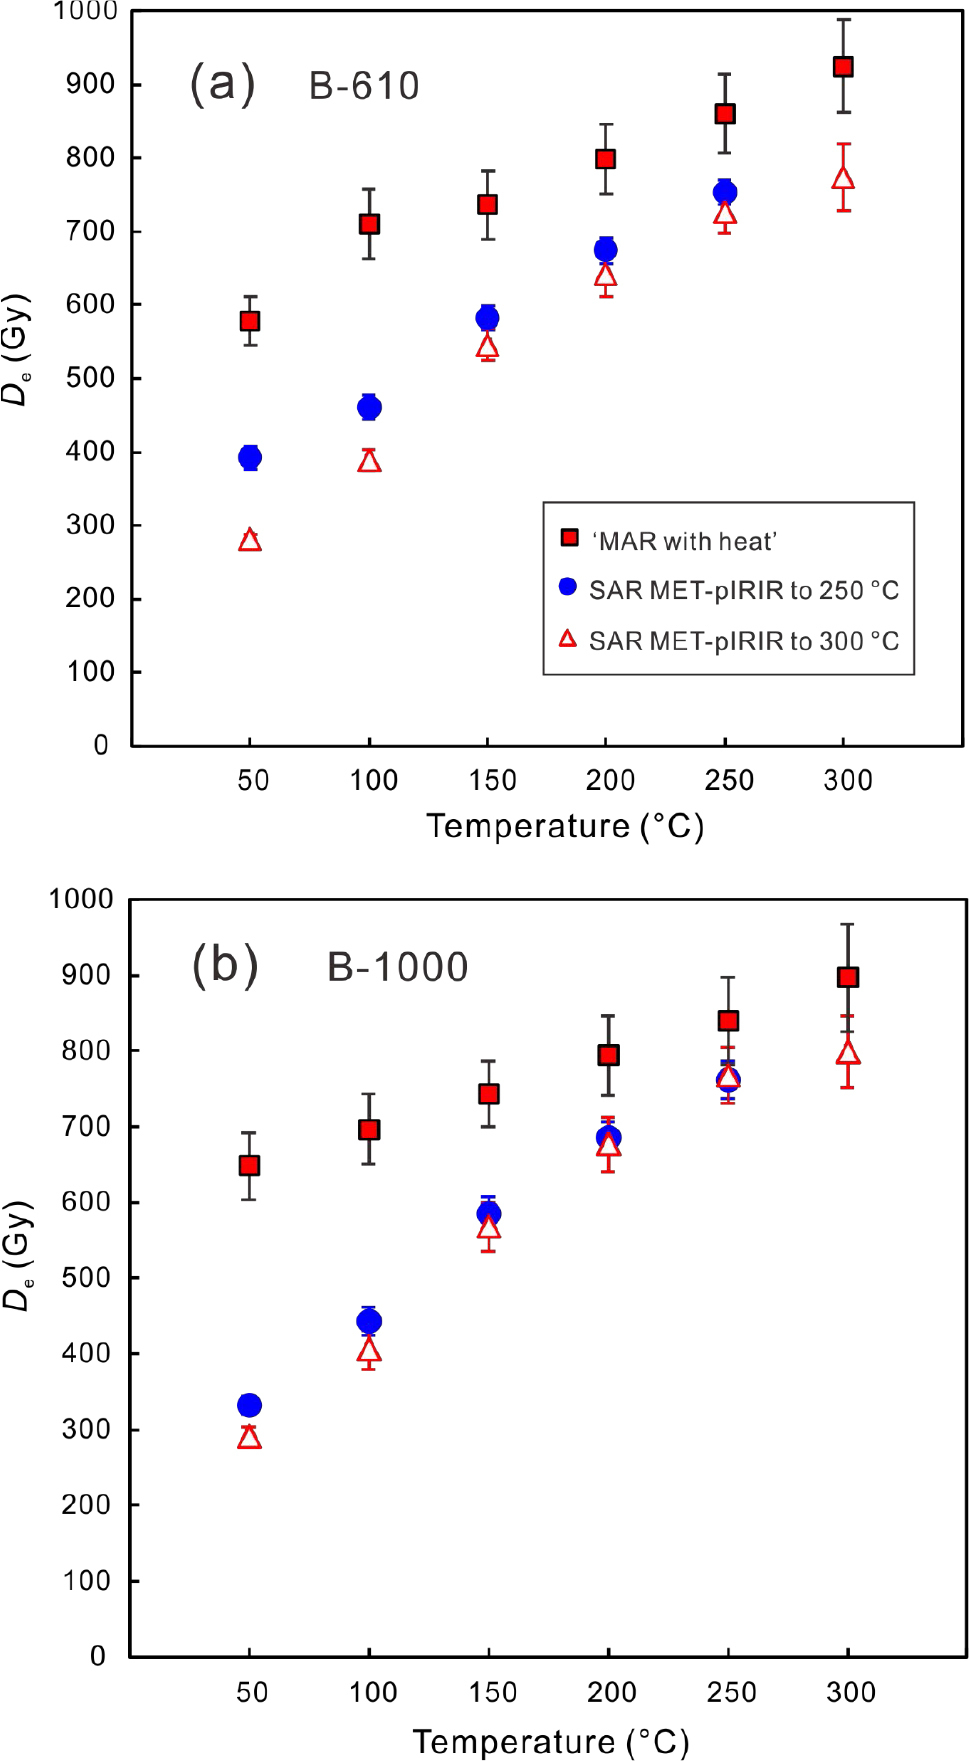
It was reported that the pIR50IR290 signal was not applicable for dating samples with De values exceeding 500 Gy, because the effect of anomalous fading cannot be adequately removed; whereas the pIR200IR290 and MET-pIRIR250 signals were sufficiently stable to date older samples (Li and Li, 2012a). Here, we found that the pIR200IR290 and MET-pIRIR250 or MET-pIRIR300 signals also failed in dating samples with De exceeding ∼750 Gy, as long as the SAR protocol was used. With the identical signal, the ‘MAR with heat’ protocol always had a larger De than the SAR protocol (Fig. 5). Therefore, the failure of the pIR200IR290, MET-pIRIR250, MET-pIRIR300 signals with the SAR protocol for De estimation was not related to the signal stability but rather related to the SAR protocol itself.
Fig. 5
De values with different stimulation temperatures for the two SAR protocols with MET-pIRIR stimulation to 250°C or 300°C, and the ‘MAR with heat’ protocol. Note that the MAR De values always exceed the SAR De values.
Previous studies have shown that the pattern of sensitivity changes of K-feldspar in the first cycle of the SAR protocol may be dissimilar to the pattern of sensitivity change in the subsequent cycles and that the failure of sensitivity correction of the first cycle would result in the underestimation of De for low-temperature IRSL signals (Wallinga et al., 2000; Chen et al., 2013; Kars et al., 2014; Li et al., 2017a; Qin et al., 2018; Zhang, 2018). The difference between the patterns of sensitivity change in the first and subsequent cycles was initially attributed to the increase in the electron trapping probability caused by the first preheat treatment (Wallinga et al., 2000; Kars et al., 2014; Zhang, 2018). However, a later study found that it was due to the combination of the decrease in the electron trapping probability and the increase in recombination probability (Qin et al., 2018). For low-temperature IRSL signals, such as IR50, the failure of sensitivity correction would always result in De underestimation when the preheat temperature was high (e.g. 200°C) (Wallinga et al., 2000; Kars et al., 2014; Zhang, 2018). However, for high-temperature pIRIR signals, the sensitivity correction of the first cycle is generally acceptable (Kars et al., 2014; Li et al., 2017a; Zhang, 2018), and dose recovery ratios are close to unity (Kars et al., 2014; Zhang, 2018). Nevertheless, a slight underestimation or overestimation of dose recovery ratios can occur, depending on the type of pIRIR signal, the magnitude of the regenerative dose and test dose, the preheat temperature (Qin et al., 2018), as well as the sample origin (Zhang, 2018). In order to study the influence, sample B-1000 was used to perform the dose-recovery-like experiments which were the same as those used by Qin et al. (2018). The ORIEL solar simulator bleached about 15 aliquots for 20 hours and then divided into five groups, each group comprising ∼3 aliquots. The given doses for the five groups were 0, 150, 300, 600, 900 Gy, respectively. The test dose was 300 Gy, the same as that used in the SAR De measurements. Two repeating cycles were carried out for each group with identical dose. The sensitivity-corrected MET-pIRIR250 signal of the first cycle (L1/T1) can be treated as the natural signal, and that of the second cycle (L2/T2) can be treated as the regenerative dose signal. Growth curves of the two kinds of signals were constructed with all of the aliquots from the five groups (Fig. 6a). The growth curve of L2/T2 was in fact constructed using multiple aliquots, but it was equivalent to the laboratory growth curve of a single aliquot in the SAR protocol, because of the consistency between different aliquots and the excellent recycling ratios (near unity) in SAR cycles for K-feldspar. In order to calculate the recovery ratios, the given doses of the first cycle were taken as unknown, and the corresponding ‘De’ values were calculated based on the growth curve of L2/T2, using the gSGC method (Li et al., 2015a, 2015b; Zhang and Li, 2019). The mean recovery ratio was calculated for each group and plotted against the recovery dose (Fig. 6b). The results show that with the test dose of 300 Gy, the recovery ratio became slightly overestimated when the recovery dose exceeded 600 Gy. Therefore, the failure of the sensitivity correction of the first cycle in the SAR protocol cannot explain the SAR De underestimation observed in this study.
Fig. 6
Results of dose-recovery-like experiments for sample B-1000. (a) The growth curves of the L1/T1 and L2/T2 signals fitted with a single saturating exponential (SSE) function: y= y0+a*(1-exp(-x/D0)). (b) Regenerative doses of the first cycle are taken as unknown and recovered by the growth curve of L2/T2. The recovery ratios are plotted versus the recovery doses. Note that the recovery ratios are slightly overestimated when the doses exceed 600 Gy.
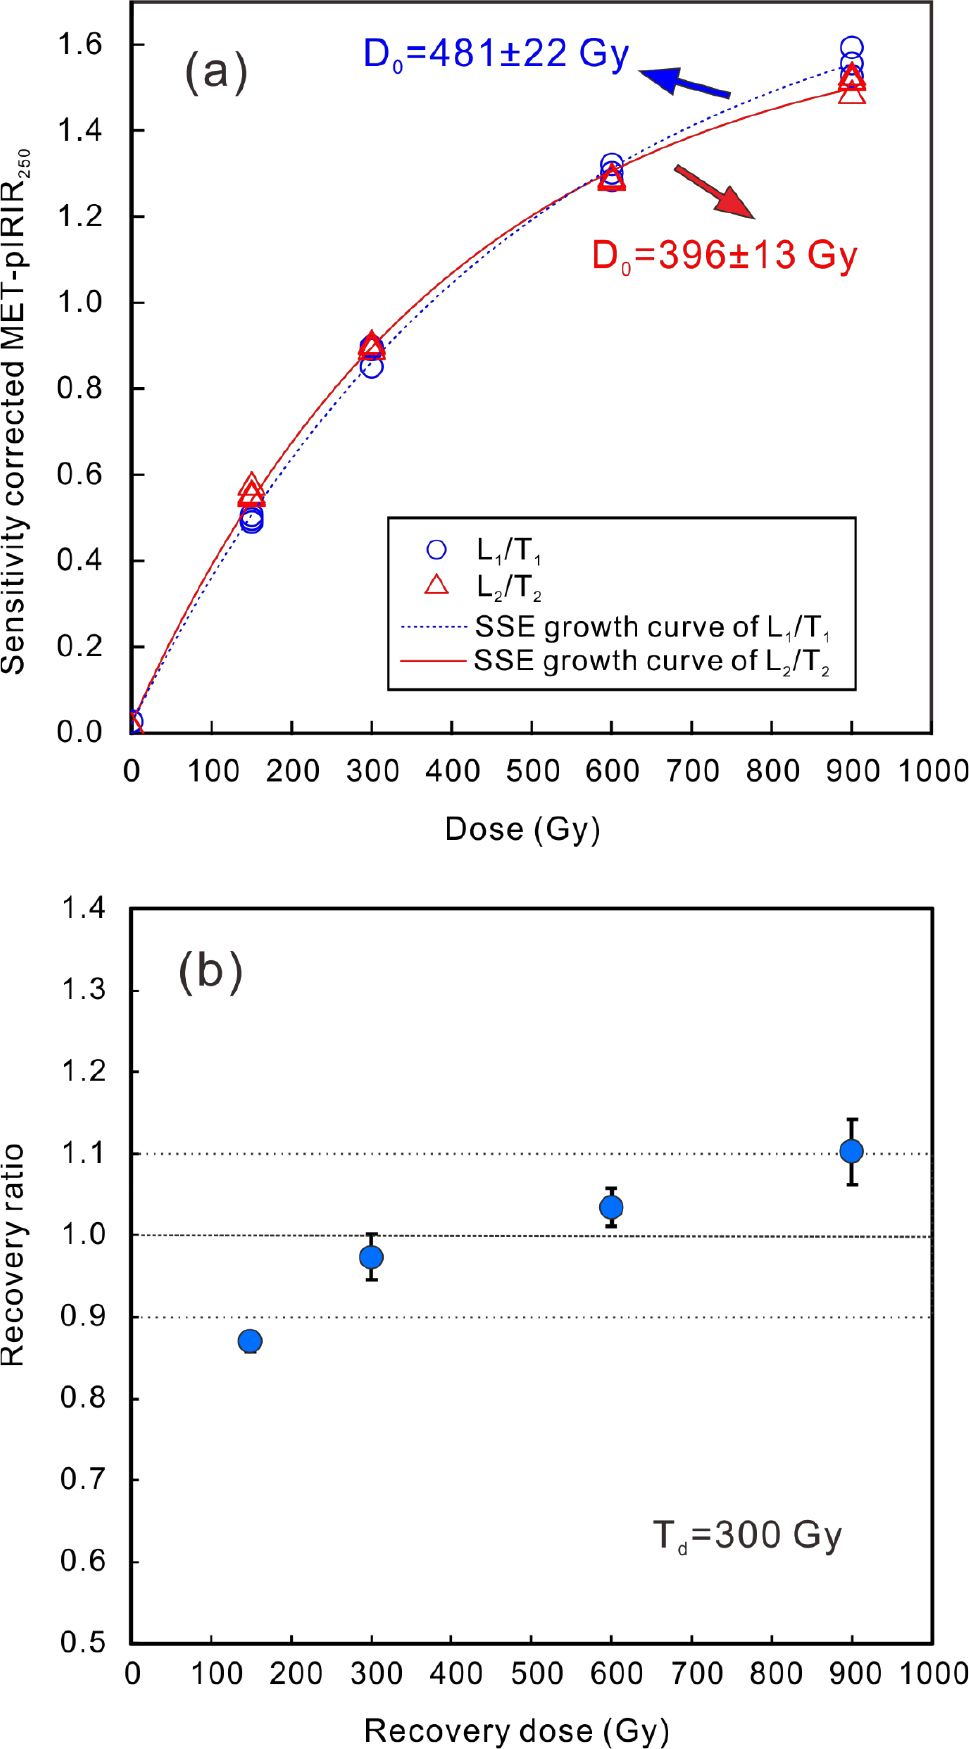
With the SAR protocol, the growth curve of K-feldspar has D0 of ∼ 400 Gy (Fig. 6a). The beginning point of SAR De underestimation is ∼750 Gy, which is very close to 2D0. For quartz, it has been proposed that reliable De estimation should be within the upper limit of 2D0 (Wintle and Murray, 2006). Age underestimation has been observed when applying quartz OSL dating in marine isotope stage 5, with De values close to the 2D0 limit (e.g. Murray and Funder, 2003; Lai, 2010). It appears that the empirical 2D0 limit also exists for K-feldspar. A recent study suggested that De underestimation for quartz when exceeding the 2D0 limit, was caused by the rejection of ‘saturated’ grains or aliquots, and an ‘average Ln/Tn’ method was thus proposed to overcome the problem (Li et al., 2017b). Successful application of this method has been performed on archeological cave sediments with an age range of 170–80 ka (Hu et al., 2019). For the K-feldspar samples used in the present study, no ‘saturated’ aliquots were identified for the SAR protocols. With the application of the ‘average Ln/Tn’ method, De became slightly smaller than the values obtained using the conventional ‘average De’ method.
We can provide no credible hypothesis to explain the SAR De underestimation in the high dose range in the present study. It is possible that the natural growth curve and laboratory growth curve of K-feldspar begin to diverge in the high dose range, similar to the case for quartz (Timar-Gabor and Wintle, 2013). However, it cannot explain the different behaviour of the SAR protocol and the ‘MAR with heat’ protocol and therefore, further studies are needed in the future.
Implications for dating
As shown in Fig. 3, the growth curve of the ‘MAR with heat’ protocol saturates much later, with D0 of ∼700 Gy (Li et al., 2013; Chen et al., 2015). Application of the 2D0 limit would enable reliable dating to ∼1400 Gy. In addition, with the MAR protocol, the discrepancy between the sensitivity changes between the first and subsequent cycles within the SAR protocol is not a concern, since all the aliquots were run for only one cycle. The ‘500°C heat’ inserted before the test dose was designed to erase pre-dose memory (Li et al., 2013; Chen et al., 2015). Although a large sensitivity change would also result from such a high-temperature treatment, it would not influence the reliability of De measurements, as the signal of the subsequent test dose is now solely related to the size of the aliquots. The test dose signal is used for mass normalisation between different aliquots, rather than sensitivity correction. Thus, for old samples, the De values obtained with the ‘MAR with heat’ protocol are the most accurate.
The SAR ages of the four samples from section B range from 160–190 ka with the pIR50IR290 signal, and 190–240 ka with the pIR200IR290, MET-pIRIR250, MET-pIRIR300 signals, which correspond to loess layer L2 and paleosol layer S2, respectively. The ages obtained using the ‘MAR with heat’ protocol are systematically 30–40 ka older than the SAR ages with the same MET-pIRIR300 signal. Considering the errors of ∼20 ka for the MAR ages, it is uncertain whether the samples are located in S2 layer or L3 layer.
. CONCLUSIONS
By comparing De measurements on K-feldspar using five post-IR IRSL dating protocols, we found that De values did not change substantially between different protocols when the De values were less than 500 Gy. However, when the De values exceeded 750 Gy, the SAR dating protocols with pIR50IR290, pIR200IR290, MET-pIRIR250 or MET-pIRIR300 signals underestimated De; in addition, the pIR50IR290 signal had a higher degree of underestimation due to the signal instability. However, for the pIR200IR290, MET-pIRIR250, MET-pIRIR300 signals, the De underestimation was not due to the signal instability, and neither was it due to the failure of sensitivity correction of the first cycle in the SAR protocol. No reasonable explanation can be proposed here for the SAR De underestimation in the high dose range.
Compared to SAR protocols, the ‘MAR with heat’ protocol can provide the most reliable De estimation for old samples with De exceeding 750 Gy.