
. Introduction
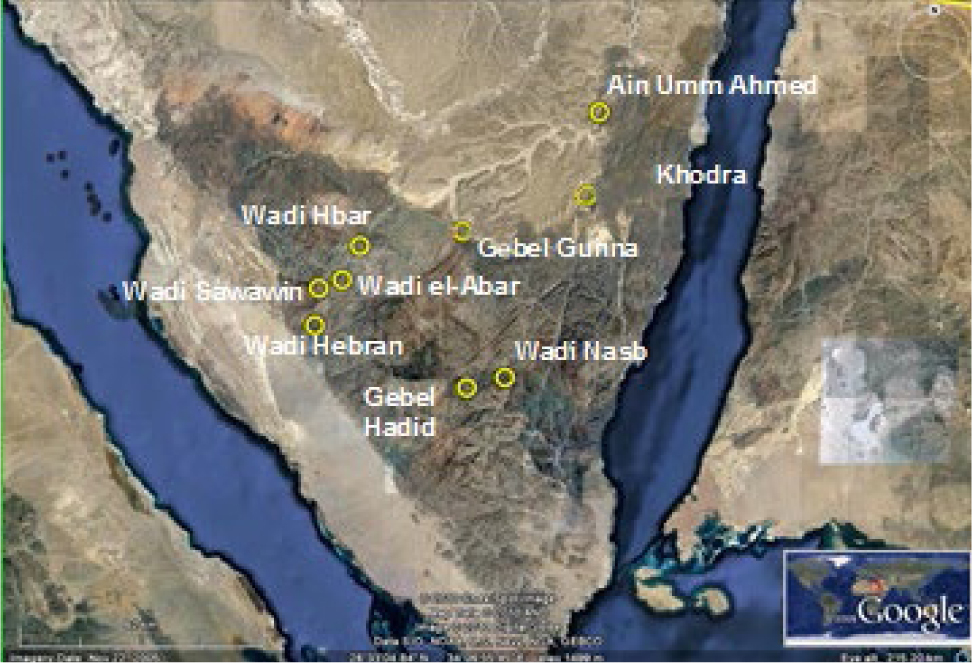
The Nawamis are stone-built circular structures, located at several sites across Southern Sinai (Fig. 1).
Earlier rescue excavations at Gebel Gunna have reported skeletons, lithic axes, scrappers, some copper bronze, grinding stones, hammer stones, beads, shells, with much debitage and debris.
According to initial excavators (Bar-Yosef et al., 1977, 1986) Nawamis appear to be family tombs, made by nomads, that inhabited the area. The age inferred by ceramic and artifact typology, as well as, C14 of charcoal assigns them to a range of Early Bronze Age (EB) I, II mainly EB II. (ca. 2700 B.C.), though Late Bronze age (1550–1200 BC) artifacts are also reported. Reuse of tombs evidenced from diagnosed finds has been noticed with later Roman-Byzantine period, even with some Bedouin burials of unknown age-all of which though may have been subjected to unnoticeable repairs. Primary and secondary burials were mixed and disturbed in historic times (Bar-Yosef et al., 1977, 1986).
There are approximately 1000 Nawamis in Sinai, some of them in very good condition, others almost destroyed (Hershkovitz et al., 1985; Bar-Yosef et al., 1983).
All Nawamis are characterized by the same have same rounded plan, 3 to 6 meters in diameter and about 2 meters height. They are double-walled structures, built on local rocks, usually sandstones. The outer wall is standing upright and the inner wall rises in an arch and forms a corbelled roof lidded by a larger slab. They were built by rough rectangular slabs fit one to another and in a simple manner of construction. The entrances are small corridors made by one or two standing slabs, that remained in place despite later collapse of some of them. In the preserved ones their entrances appear to face west.
Optically stimulated luminescence dating (OSL) followed surface luminescence dating procedures of Litizis et al. (2013a) to date for first time two Nawamis, in Gebel Gunna and Ain Khodra areas, to investigate construction or re-use of these nomadic tombs.
The geolithology of the area comprises of sandstones intercalating with various carbonate rocks and shales, which belong to the Mahla Formation (Wanas, 2011). These are unconformably underlain by low-lying sandstone of the Naqus formation, which together with the granitic rocks of the Precambrian basement form a pronounced relief reaching about 1200 meters above sea level.
. Luminescence Dating Of Walls: The Rationale
The luminescence technique employed in this study has been introduced during the 90’s (Liritzis, 1994), and thereafter tested and published elsewhere (Huntley and Richards, 1997; Habermann et al., 2000; Morgenstein et al., 2003; Greilich et al., 2005), with an overview of the surface dating reported later in this journal by Liritzis (2011) followed by successfully applied case studies (Sohbati, 2013; Liritzis et al., 2013a, 2013b, 2015; Liritzis and Vafiadou, 2014) or reported in review articles about the use of OSL in different materials (Roberts et al., 2015). In masonry it involves dating the inter-block surfaces of building stones which relies on the optically sensitive electron traps responsible for OSL light in the surface layer of the carved rock, having been bleached by sunlight, prior to the blocks being incorporated into the structure. The sunlight bleaching of quartz in sandstone surfaces is in fact fast (Liritzis et al., 2010b; Liritzis and Vafiadou, 2014). Subsequently, the slabs exposed to sunlight are moved in the appropriate position of the structure and overlaid by another block. From the moment that any surface is no longer exposed to sunlight and put in firm contact (with or without mortar), the optically sensitive electron traps are filled by electrons produced by the ionization caused from nuclear radiation of natural uranium, thorium, potassium, rubidium and cosmic radiation. These isotopes are present in the rock slabs and the soil surrounding the sampling point. Thus, the age can be given by Eq. 2.1:
The equivalent dose (ED, in Grays, Gy) is measured by (OSL) following standard procedures of SAR (Murray and Wintle 2000; Greilich et al., 2005; Liritzis et al., 2010b).
The annual dose rate (DR, in mGrays per year) de-notes the radiation dose accumulated in a year. It is com-prised of the three-radiation dose components (alpha, beta and gamma radiation) derived from the natural radioisotopes of uranium (U-238), thorium (Th-232), potassium (K-40), and rubidium (Rb-87), of the sample itself and the surrounding environment, and includes cosmic-rays (Aitken, 1985).
. Sampling
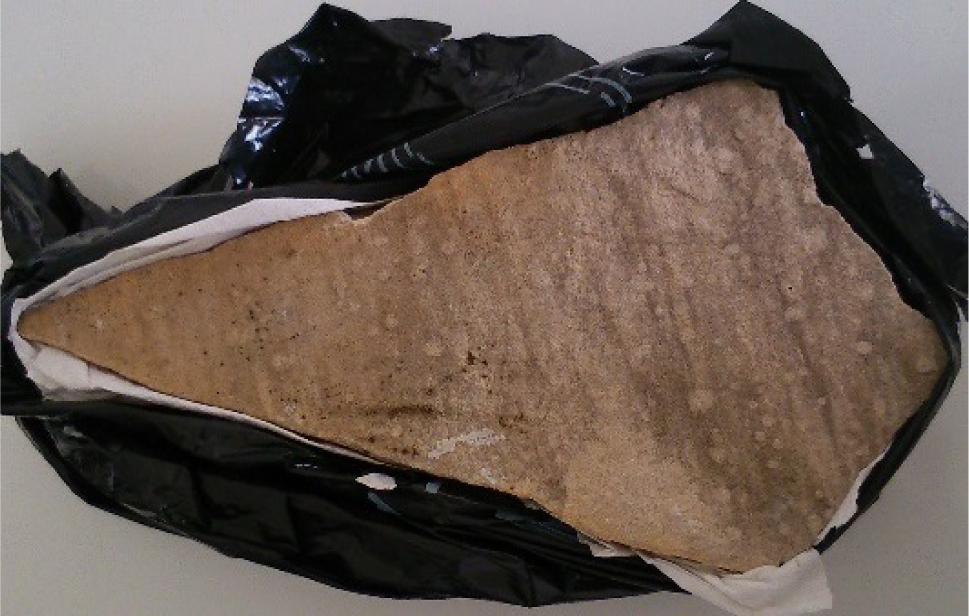
With the aid of a chisel and a hammer samples were detached from firm contacts and swiftly covered to avoid sun exposure. In fact care was taken when removing the samples to avoid light: sampling was made during the sunset working under an in situ mini tent to light deprive, they were gently chipped and when loose while still in original position in the wall and covered by mortar, were gently removed being wrapped by black plastic bags, while adherent sand on the contact of the two cobbles was collected too (Liritzis et al., 2010, 2015; Liritsiz 2010). Surficial pieces of rock about 6–8 cm2 and at least 0.5 cm thick were detached. (Fig. 2). By adhering to this protocol, we insure that the samples collected in the field were not exposed to light.
Fig. 2
Actual sample obtained from the structures, wrapped in opaque bag to avoid sunlight. (scale: longer length ~4 cm). Here the opposite side is shown that is of no interest to dating for clarity of sample size and shape.
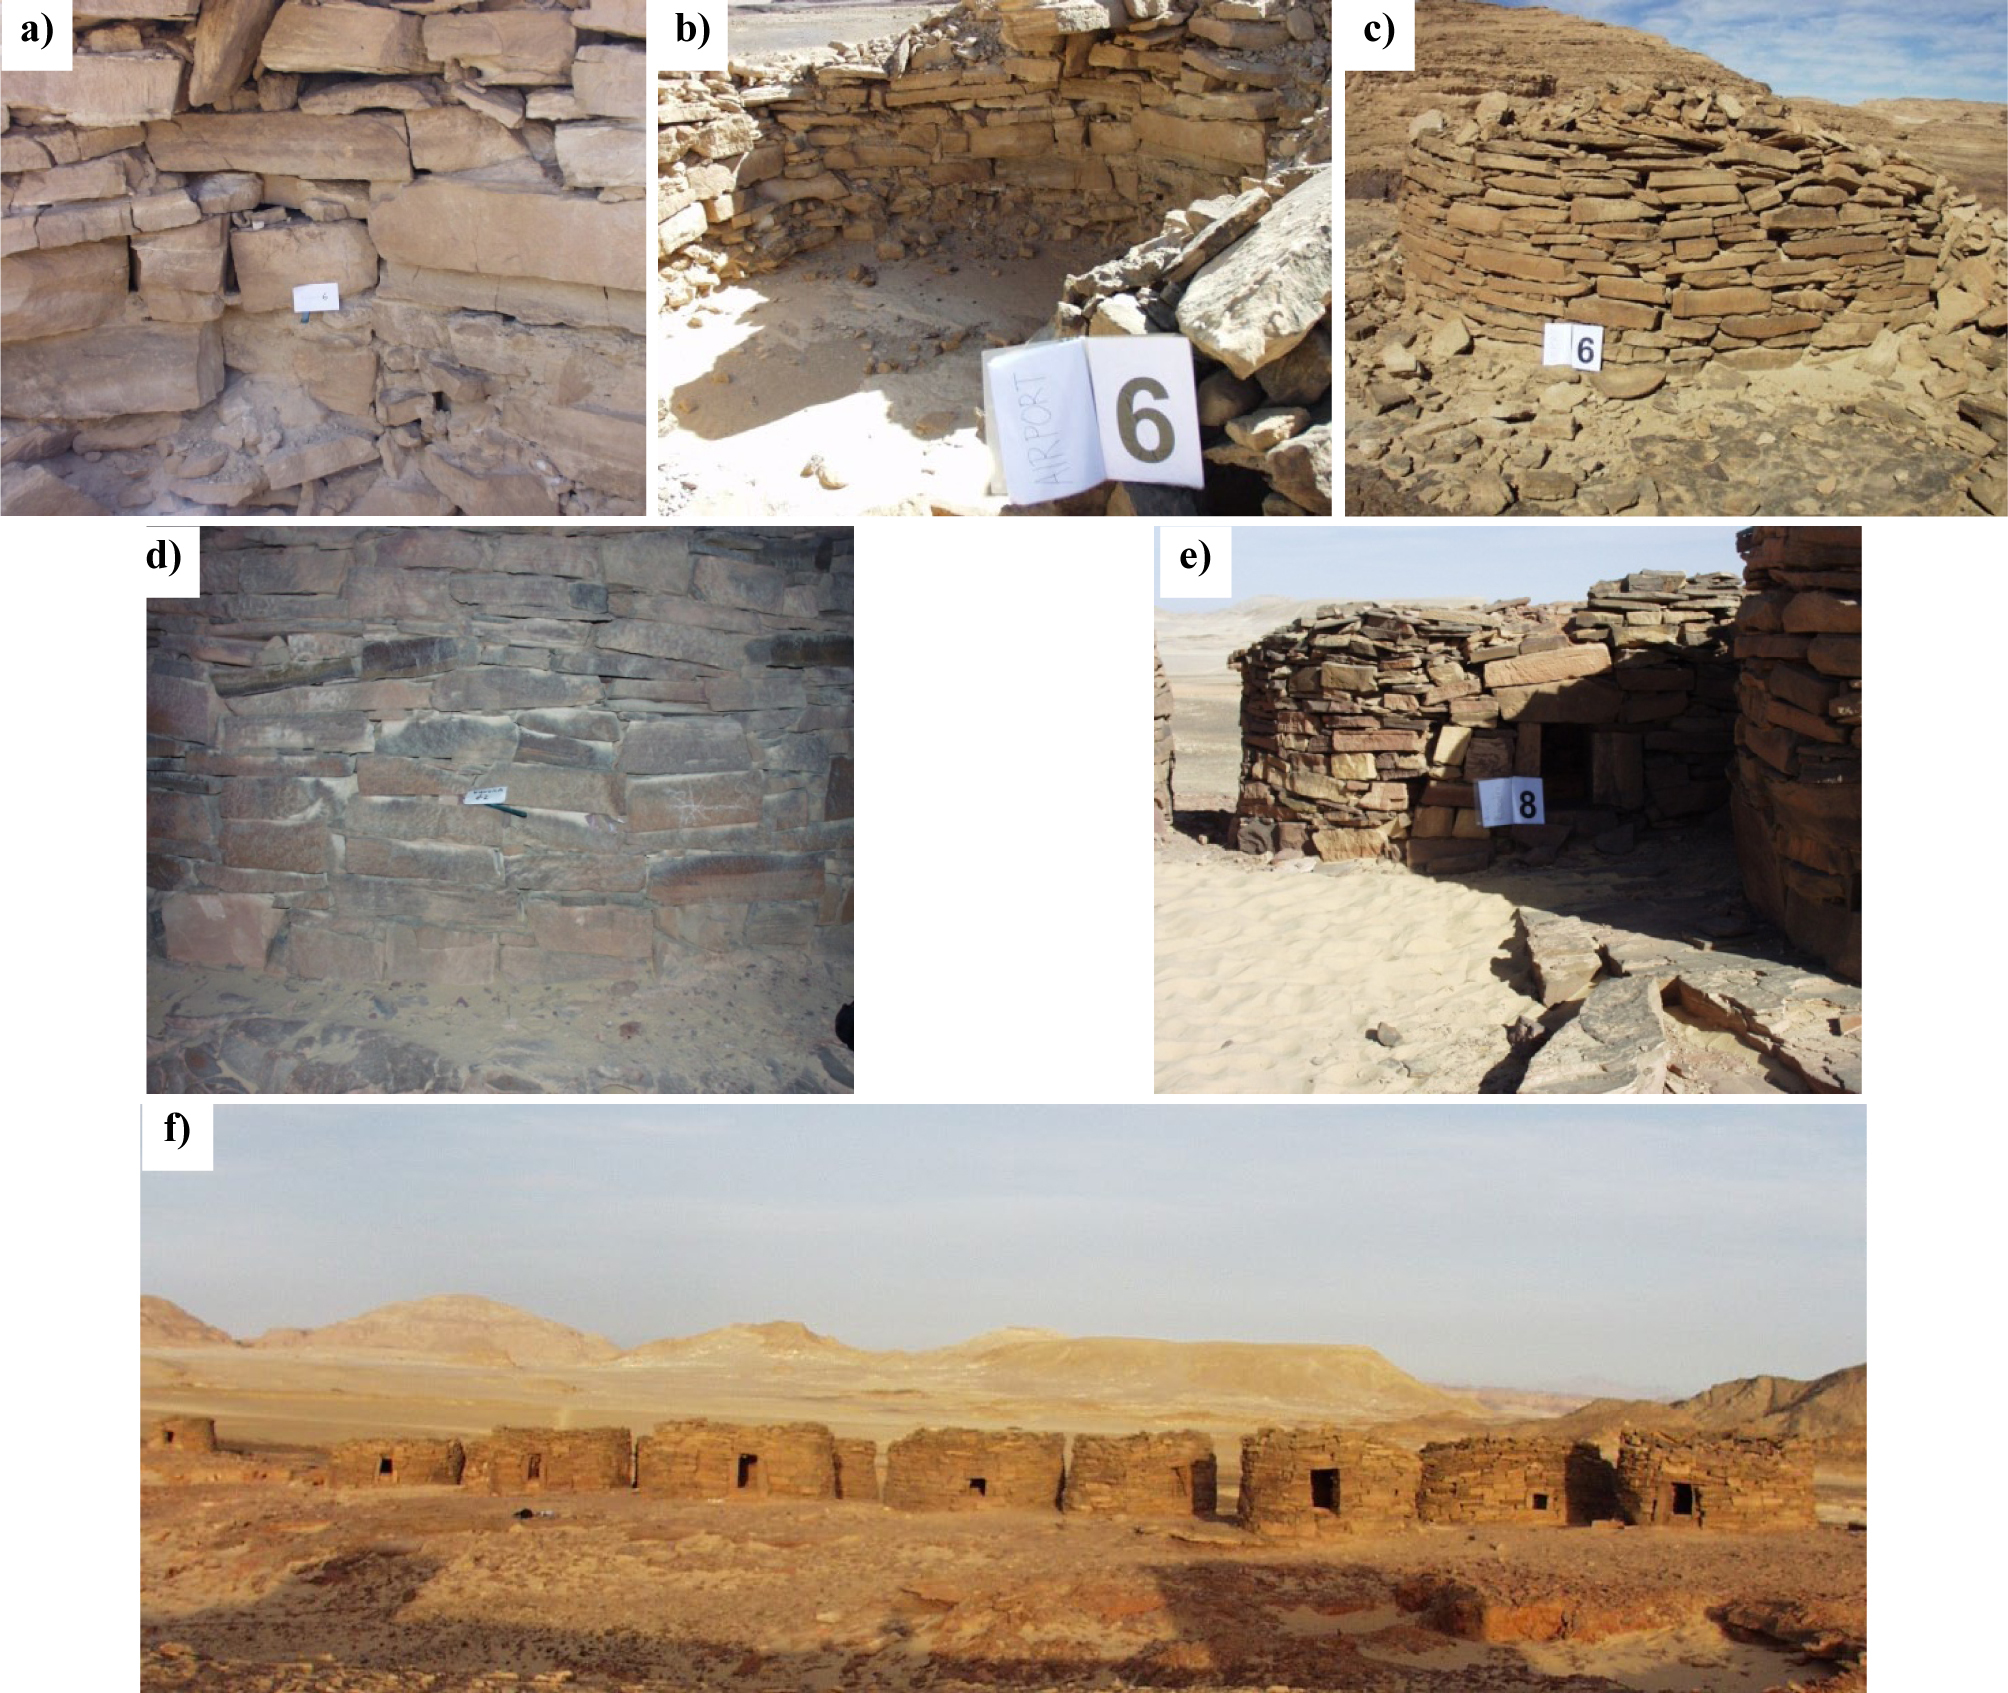
At Gebel Gunna 6 inside the rectangular structure wall sampling was made about 60 cm above the bedrock floor, and from Ain Khodra 8 both samples came from the external wall at a height of about 1.00 m above bedrock ground (Fig. 3). Nine sub-samples were processed from three removed pieces; one piece derived from Gebel Gunna tomb (the GG6 with three sub-samples), and two pieces from Ain Khodra (AK8.1, with two sab-samples, and AK8.2 with four sub-samples from both surface faces).
Fig. 3
a) Gebel Gunna No 6. The sampling point (scale of white paper length 20 cm) where piece of slab was taken from inside the tomb, by a hammer and chisel b) another view of the inside with the slabs and rough construction, and c) a view of the back that indicates the construction manner. Height of tombs ~ 2 meters and wall width ~ 1 m (The A4 white paper sheet acts as a scale on the external wall) d) Ain Khodra no 8 sampling from back side, and e) the entrance face (scale as A4 paper and in sampling point paper length is 20 cm) f) also a cluster of tombs around the sampled one.
A surface layer of about 50 µm (measured by a mi-crometer), which included organic material, dust, and adherent contamination, was removed from the inner surface by briefly inserting it in dilute hydrochloric acid HCl acid (10 wt%) and rinsed with running water. Subsequently, a thin layer of surface polymineral powder was acquired by gently scraping the inter block surface to a depth of less than 0.5 mm (making a series of readings with a micrometer) and transferred to an acetone bath where grains were collected, washed in dilute acetic acid (5 wt%) for 1 min, and dried. Medium sized grains of sandstone were sieved to a diameter of 50–110 µm, washed in HF for 45 min to remove a layer of 25 µm to avoid alpha particle dose rate contribution, prior to OSL measurements.
Sub-samples of the ancient carved surface were taken (by dividing the surface into sizeable parts to acquire sufficient quantity powder for SAR and tests), to reassure regions of interest (ROI) that were not subjected to possible effect of friction (from past earthquake) of two stones in contact. Such an event destroys originally bleached surface layer and provides powder of deeper surface layers not bleached and thus inhere geological luminescence. Where appropriate, two or three sub ROI were selected (see Fig. 6) (in fact, two contact surfaces do not touch each other completely, but there exist sub-areas at the millimeter level of voids; those sub-areas of interest are searched for obtaining consistent equivalent doses, with others, usually high values, as outliers, discarded regarded of geological origin).
. Instrumentation & Measurements
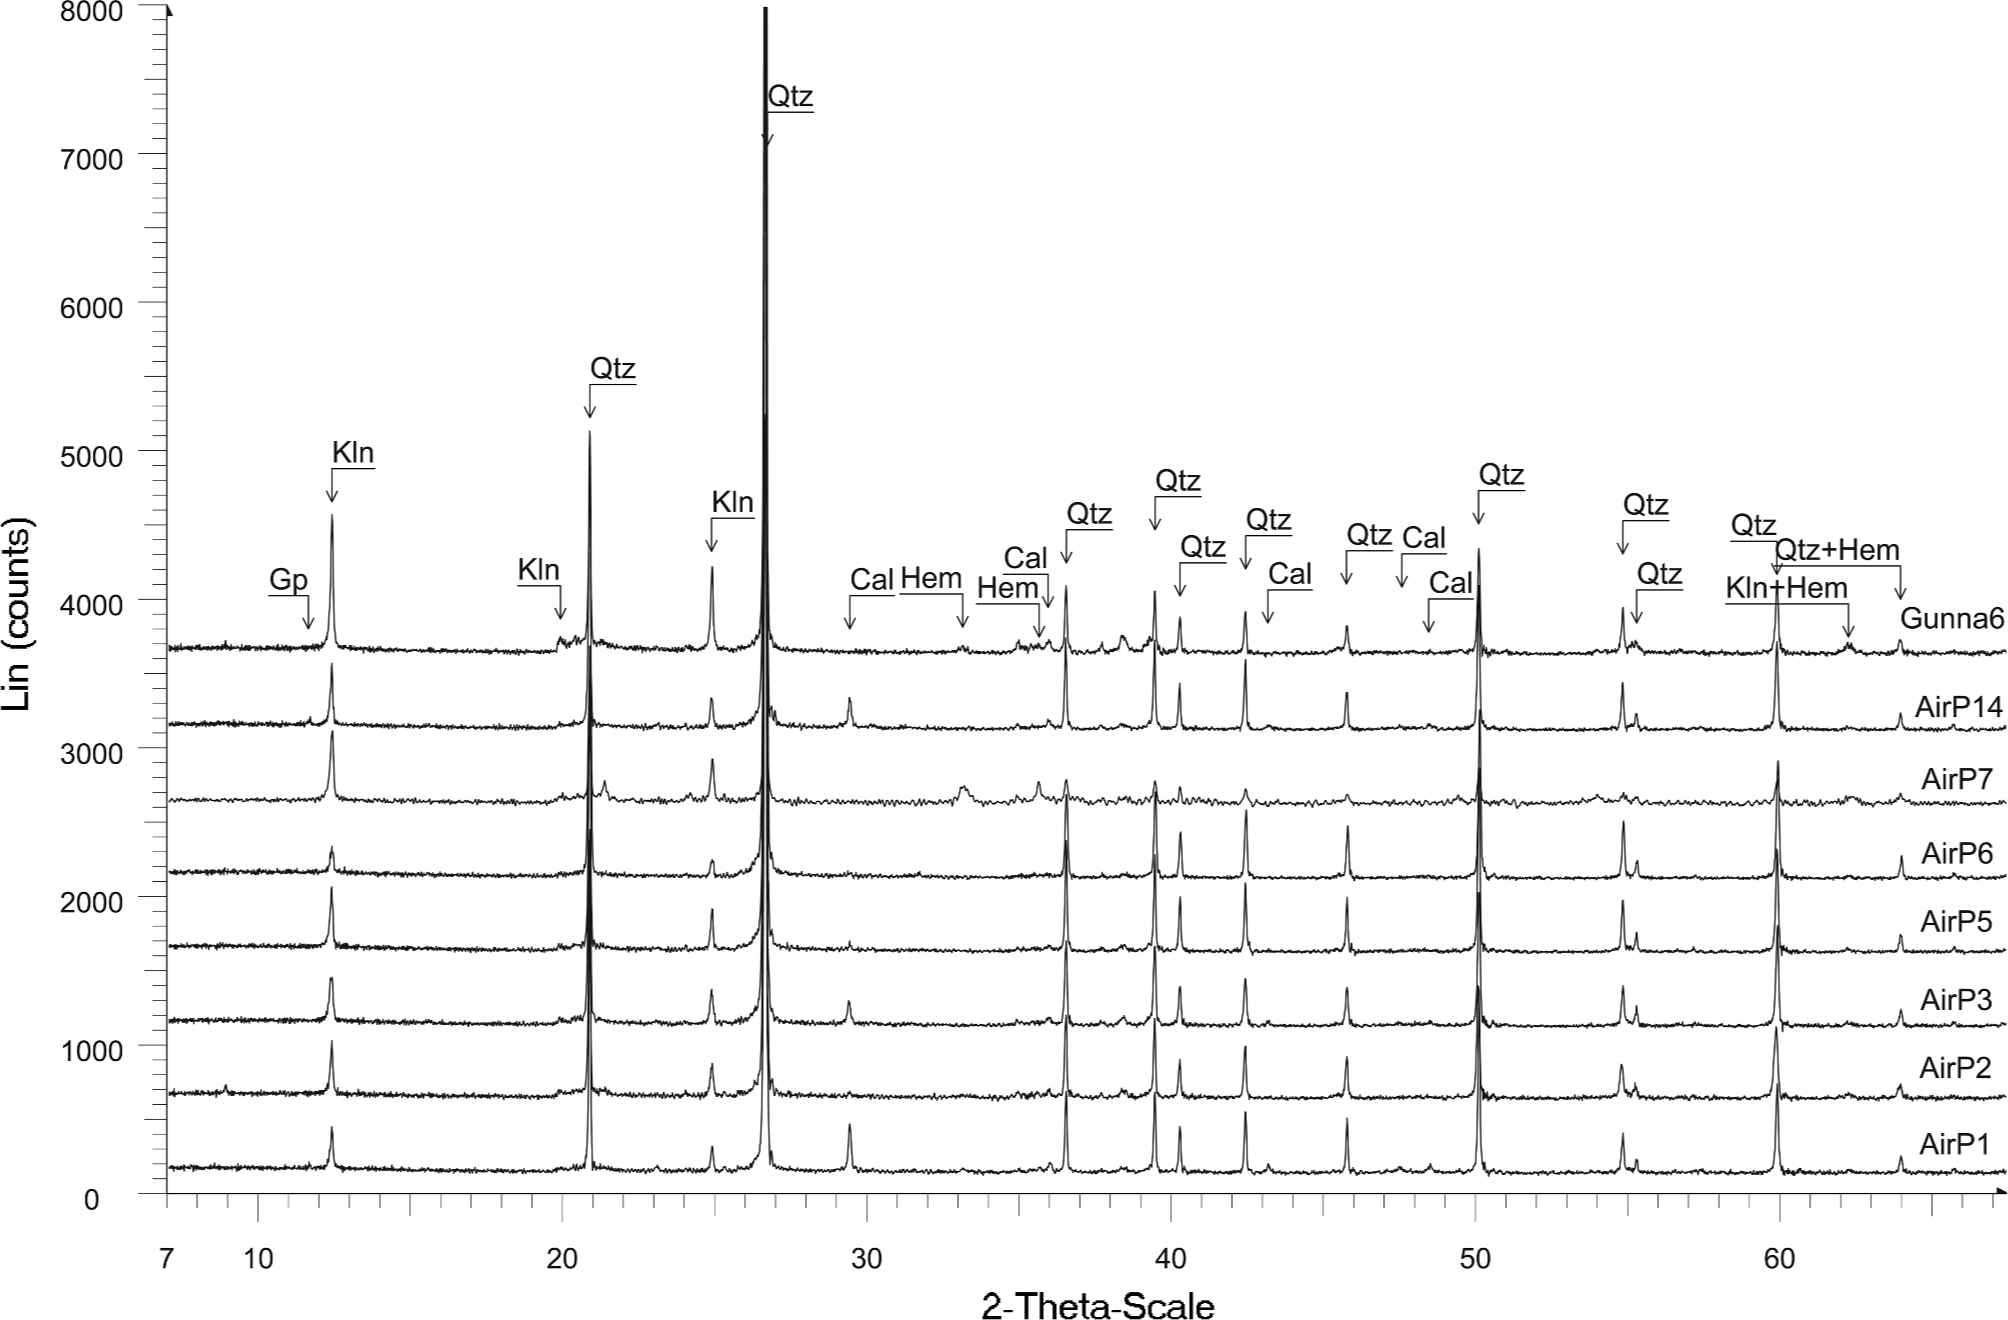
Prior to any sample preparation the mineralogy was checked by XRD, then equivalent dose and dose rates were measured. XRD analyses were performed on the same samples (Ain Khodra 8, Gebel Gunna 6) that were used for dating, as well as, from other rock types of local environment shown in Table 1. Stone was visually similar but mineralogical characterization was decided to be a necessity in order to detect differentiations that potentially point to the exploitations of different quarries and/or different chronological periods of use; checking even small variations was of interest and as a future reference too.
Table 1
Mineralogical composition of the analyzed samples as deter-mined through XRD analysis. Airp stands for rocks around airport (+: dominant; x: present; tr: traces; -: not determined).
XRD analysis
A small aliquot from the samples was used in order to determine the mineralogical composition by means of X-ray powder diffraction (XRD) analysis. Samples were firstly dried in a laboratory oven at 110°C for 24 h and then grinded in a vibration disc mill using an agate grinding set. The samples were then analysed in a Bruker D8 Advance X-Ray diffractometer, with Ni filtered CuKa radiation, operating at 40 kV/40 mA, in the Laboratory of Mineral and Rock Research of the Department of Geology at the University of Patras, Greece. The scanning area covered the interval 2°–70° 2θ, with a scanning angle step of 0.015° 2θ and a time step of 0.1 s (Iliopoulos et al., 2011). The interpretation of the acquired diffractograms and mineral identification was performed using DIFFRACplus EVA software (Bruker-AXS, Madison, WI, USA) based on the International Centre for Diffrac-tion Data Powder Diffraction File (2006). Representative rocks from several tombs are examined. The rock was identified as sandstone with predominant quartz, few kaolinite and only traces of other minerals such as calcite, hematite, gypsum and muscovite (Table 1 and Fig. 4). Lazurite was only identified in the sample from Gebel Gunna 2 (Airp2). This blue colored mineral is the essen-tial ingredient of lapis lazuli, a precious stone well known in prehistoric times, which was widely imported from Afganistan to Egypt. The composite XRD diagram of Fig. 4 illustrates well the quartz predominance in all samples.
Dose Rate
U and Th were measured from alphas with the pairs technique by a calibrated alpha counting system; a 7286 Low Level Alpha Counter, Littlemore Sci. Eng Co Oxford with a PM tube type EMI 6097B using ZnS(Ag) films. Alpha counts converted to concentrations and were calibrated on reference standards following devised con-version factors as well as relevant computations (Aitken, 1985; Liritzis and Vafiadou, 2012). Potassium (K%) content was measured by Flame Atomic Absorption Spectroscopy (FAAS) and a minor contribution by Rb to inclusion from the ratio Kppm/Rbppm equal 200/1. (Aitken, 1990; Warren, 1978). FAAS was made by Perkin Elmer, USA mod.: Analyst 800 Dual System (Flame and Graphite Furnace ionization). The standard procedure was applied i.e. 0.2 g of sample was transferred to solution in a microwave oven in the presence of 5 ml HF (49%) and 5 ml HNO3 (69.5%). Thereafter it was diluted to 100 ml. The calibration standard used was SARM 69, from which five solutions of different concentration made the calibration curve. For the conversion from content to dose rate the recent updated factors are used (Liritzis et at., 2013c).
The dose rate consists of the sum of beta and gamma dose rates as the outer layer of quartz grains affected by alpha irradiation was removed by acid treatment. However, the sampling position has not a straightforward dosimetry geometry (e.g. sandwiched been sediment layers or sample surrounded by an homogeneous medium in the center of a sphere of radius ~35 cm), therefore, dose rates were case sensitive and individually estimated (piece detached from a wall, above a sandy floor etc.). Details are given as follows: Rubidium values are calculated based on K/Rb = 200. The total beta particle doses-rates are halved (lower stone surface plus upper mortar) and include an attenuation factor of 0.90. For GG6.1 the total Dγ is 1.19 mGy/yr. The Dγ from sand is 1.55 mGy/yr and from stones 0.36 mGy/yr. The sampling point is 60 cm above floor and if considered as a center of a sphere of radius ~30 cm (for solid medium, but some meters through air medium) which receives gamma rays dose within 30 cm, including the rock itself, adjoining rocks and mortar, and air from the opposite face of the block: In particular, half gamma dose-rate (equal of 0.180 mGy/yr) from the rear 1 m thick wall and from skyshine inside the enclosed structure of similar stones and the floor, an approximate 25% (¼th of the spherical representation of mixed media around the sampling point) from ground floor sand of 0.39 mGy/yr, plus, 25% from ceiling 0.09 mGy/y. The latter two were estimated from the fact that 70% of infinite gamma dose medium (from K-40, U-238, Th-232) is recorded on surface, and about 25% at a height of 1 meter above ground (Beck and Planque, 1968; Thompson et al., 1999; Liritzis and Galloway, 1981). For AK8.1.1 the half Dγ dose-rate is used as sample derives from external wall, total Dγ is 1.17 mGy/yr. Water uptake measured to be zero. Cosmic rays dose rate for latitude 28°N and longitude 34°E and altitudes 850–1300 m a.s.l. at Sinai is estimated as 0.30 mGy/yr. The penetration through some centimeters in slabs is estimated to be reduced to 0.25 mGy/yr (Prescott and Hutton, 1994). Total dose rate includes cosmic 0.25 mGy/yr and 0.1 mGy/yr internal radioactivity in quartz.
Dβ were contributed to the surface by half from the lower stone where sample powder originates plus half from upper 2 mm layer of sand; from the upper stone surface betas do not reach the lower surface since attenuated by space and introduced sand, while about 20 microns are removed during cleansing of surface that precludes alpha particles dose.
Equivalent Dose-SAR technique and Resulted Dates
All OSL measurements were conducted in the continuous wave OSL mode of an OSL reader (model Ris⊘ TL/OSL – DA15) at 125°C for 100 s. Stimulations were made under blue LEDs light source (λp ~ 470 nm, FWHM 30 nm) and irradiations with a calibrated 0.075 Gy/s 90Sr/90Y β-ray source (B⊘tter-Jensen et al., 2000).
Heating was carried out using a heating rate of 1°C, in order to avoid thermal gradient and 7.5 mm Hoya U-340 (λp ~ 340 nm, FWHM 80 nm) filter for the detection optics. The power level was software controlled and set at 90% of the maximum power of the blue – LED array, delivering at the sample position ~ 32 mW cm−2. The background OSL levels measured after 95–100 seconds exposure were subtracted from the initial luminescence intensity (0–1 seconds) of the decay curves obtained. The De was determined on recovered traces of quartz from sandstones (Liritzis et al. 2010b, 2015,Liritzis and Vafiadou, 2014). OSL signals present an extremely rapid decay in the first seconds of stimulation, providing thus a strong indication regarding the presence of a unique fast component, being dominant at the initial part of the OSL curves. The numbers of aliquots/per sample were very restricted due the nature and the availability of the samples and ranged from 2 to 5; only sample AK8.2.4 provided powder for 7 aliquots (cf. notes on Table 2).
Table 2
Luminescence measurements data. (GB: Gebel Gunna, AK: Ain Khodra).
| Sample No | U(ppm) | Th (Ppm) | K (%) | Rb (Ppm) | Dβ | DY | ED1(Gy) | Age(yrs BC) | Annual Dose,(mGy/yr)2 |
|---|---|---|---|---|---|---|---|---|---|
| GG6.1 | 0.55 ± 0.077 | 4.97 ± 0.32 | 0.21 ± 0.008 | 10.5 | 0.85 ± 0.13 | 0.43 ± 0.044 | 4.83 ± 0.33 (3) | 1800 ± 320 | 1.28 |
| GG6.2 | >> | >> | >> | >> | >> | >> | 5.60 ± 0.45 (5) | 2370 ± 300 | >> |
| GG6.3 | >> | >> | >> | >> | >> | >> | 5.75 ± 0.75 (3) | 2490 ± 450 | >> |
| Average | 2220 ± 300 | ||||||||
| Sand (floor) | 4.0 ± 0.09 | 13.8 ± 1.0 | 2.50 ± 0.1 | 123 | |||||
| AK8.1.15 | 0.89 ± 0.07 | 2.98 ± 0.23 | 0.1175 ± 0.005 | 6 | 0.20 ± 0.0076 | 0.85 ± 0.04 | 4.89 ± 0.23 (2) | 2660 ± 230 | 1.05 |
| AK8.1.2 | >> | >> | >> | >> | >> | >> | 4.69 ± 0.35(2) | 2470 ± 300 | >> |
| Average | 2560 ± 250 | ||||||||
| AK8.2.1 | 3.68 ± 0.35(3) | 1500 ± 350 | >> | ||||||
| AK8.2.2 | 3.48 ± 0.23(3) | 1310 ±230 | >> | ||||||
| Average | 1400± 2807 | ||||||||
| AK8.2.3 | 4.34 ± 0.40 (5) | 2130 ± 370 | >> | ||||||
| AK8.2.4 | 3.13 ± 0.25 (7) | 980 ± 240 | >> | ||||||
Quartz grain aliquots which were collected in earlier steps during sample preparation (and suspected as being partially or totally bleached) for both samples following SAR, was used to perform initial tests like signal growth, preheat and dose recovery tests and those were 2 aliquots made from sample GG.6.1 and 3 samples made from AK.8.2.4.
Below an OSL shine-down curve is given for an aliquot from sample AK.8.2.4 that was used as a test sample (Fig. 5).
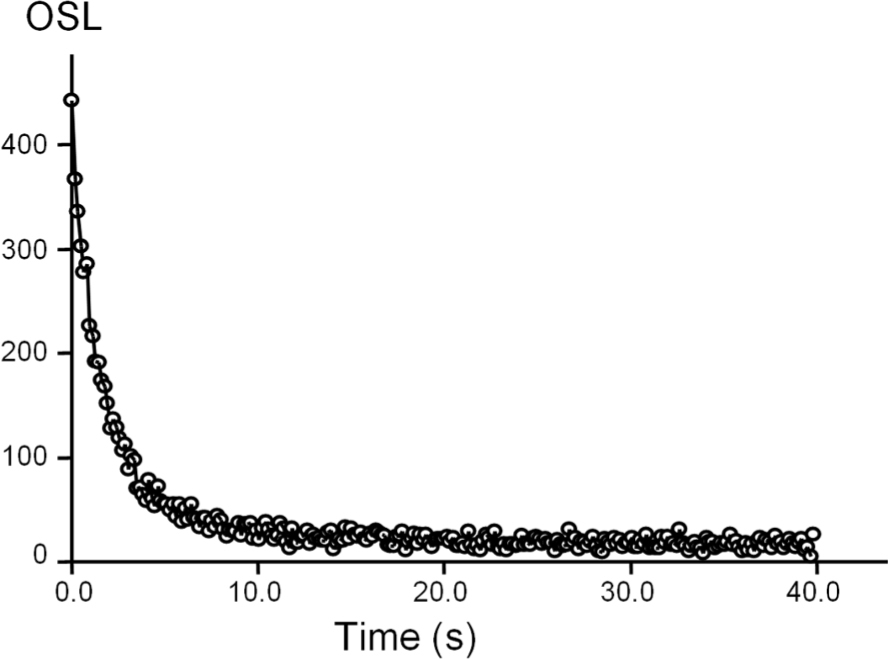
However, in the sole monolayer aliquots composed by quartz grains resetting of luminescence signal due to solar exposure has been documented, but it is not expected for quartz grains in composite stones likewise sandstones and calcareous schists. Longer sun exposures ensure complete bleaching, in concordance to earlier literature accounts and theoretical considerations of photon attenuation in rocks with depth (Liritzis and Bakopoulos, 1997, Liritzis and Galloway, 1999; Habermann et al., 2000; Greilich, 2004; Greilich et al., 2005; Vafiadou et al., 2007; Laskaris and Liritzis, 2011).
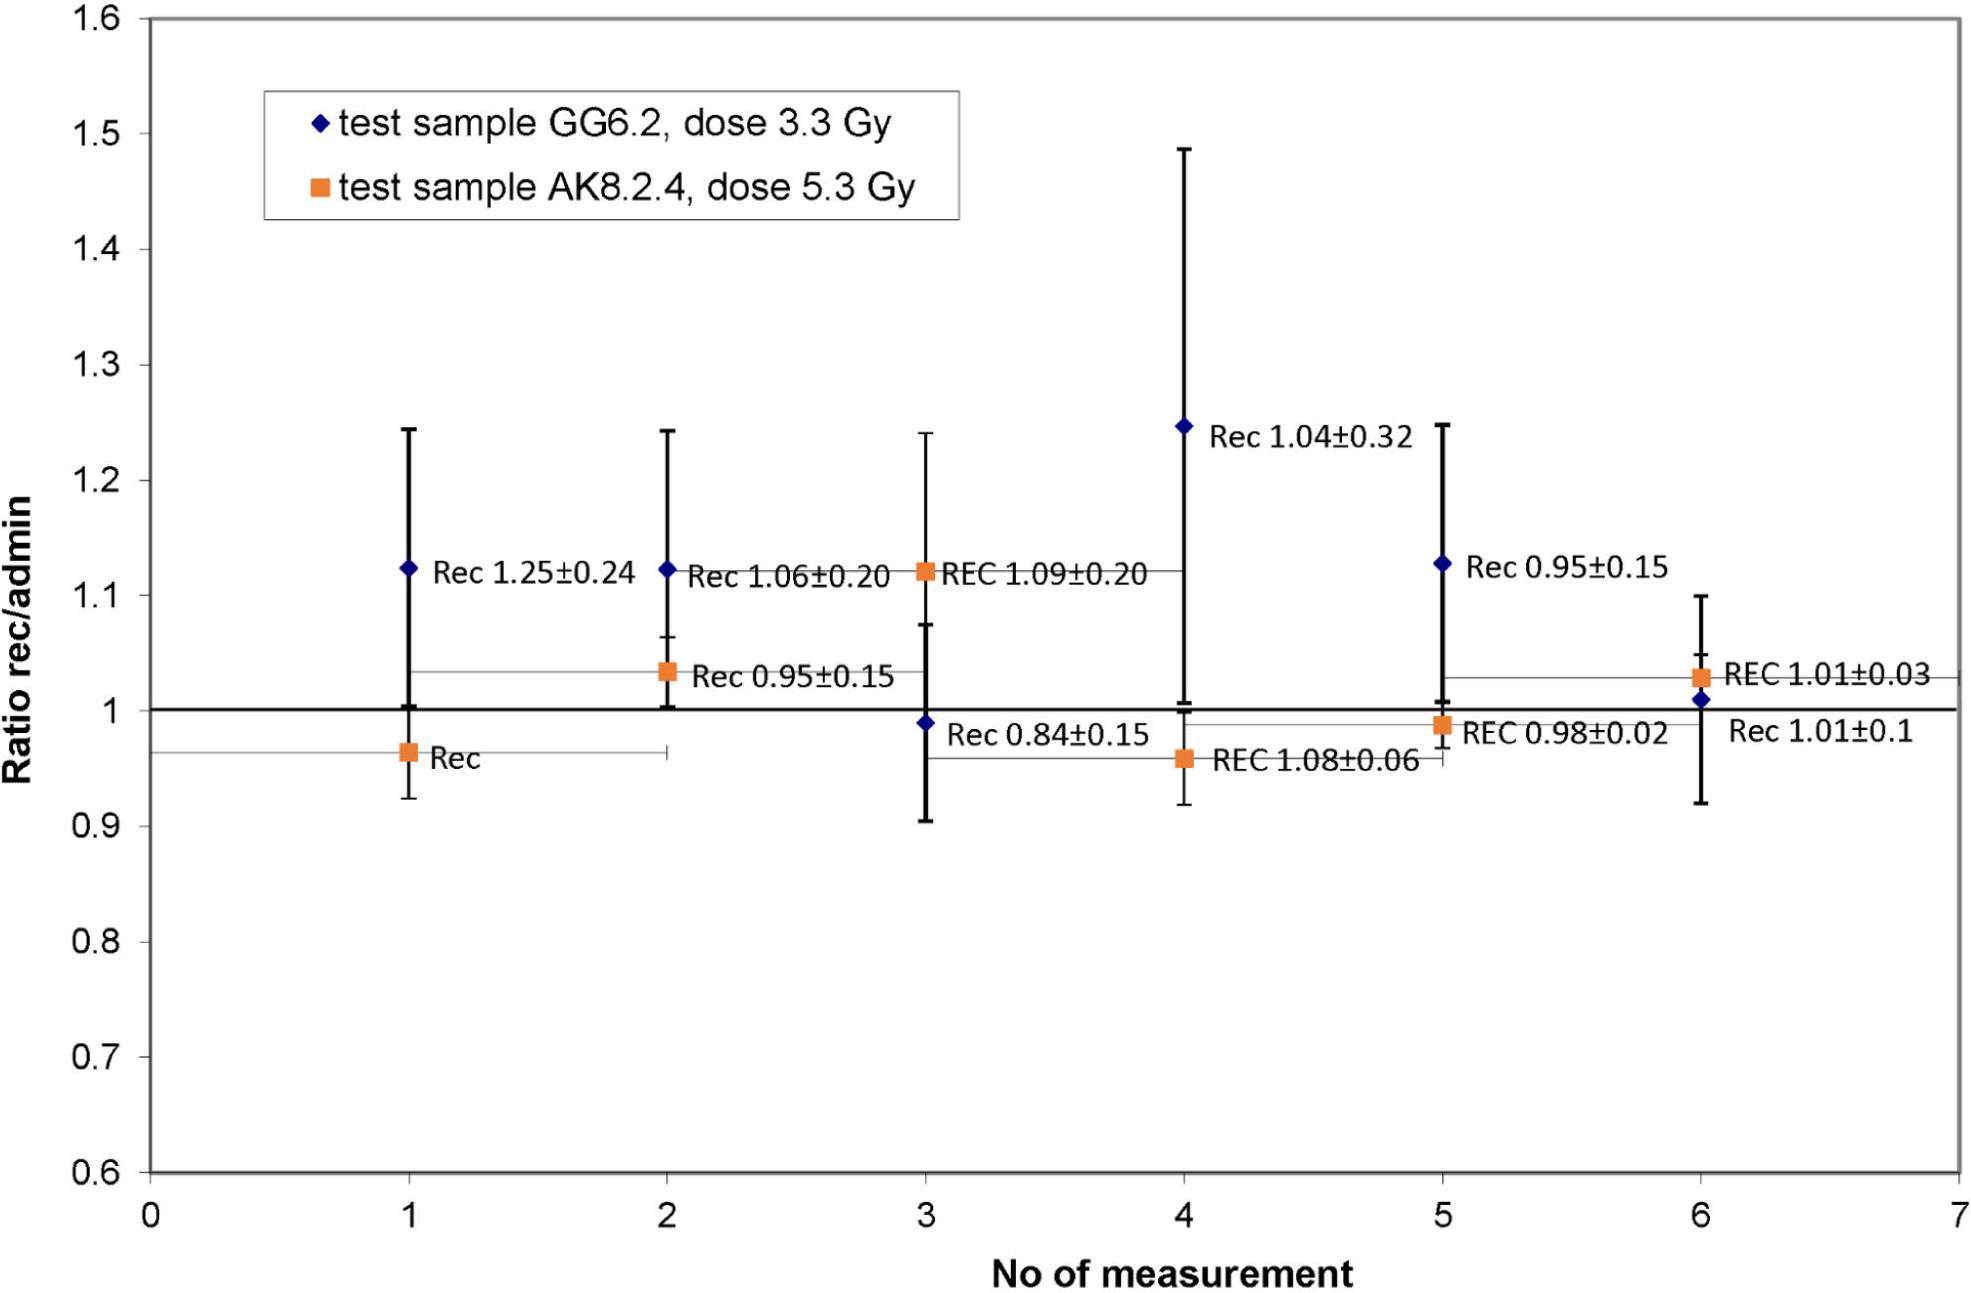
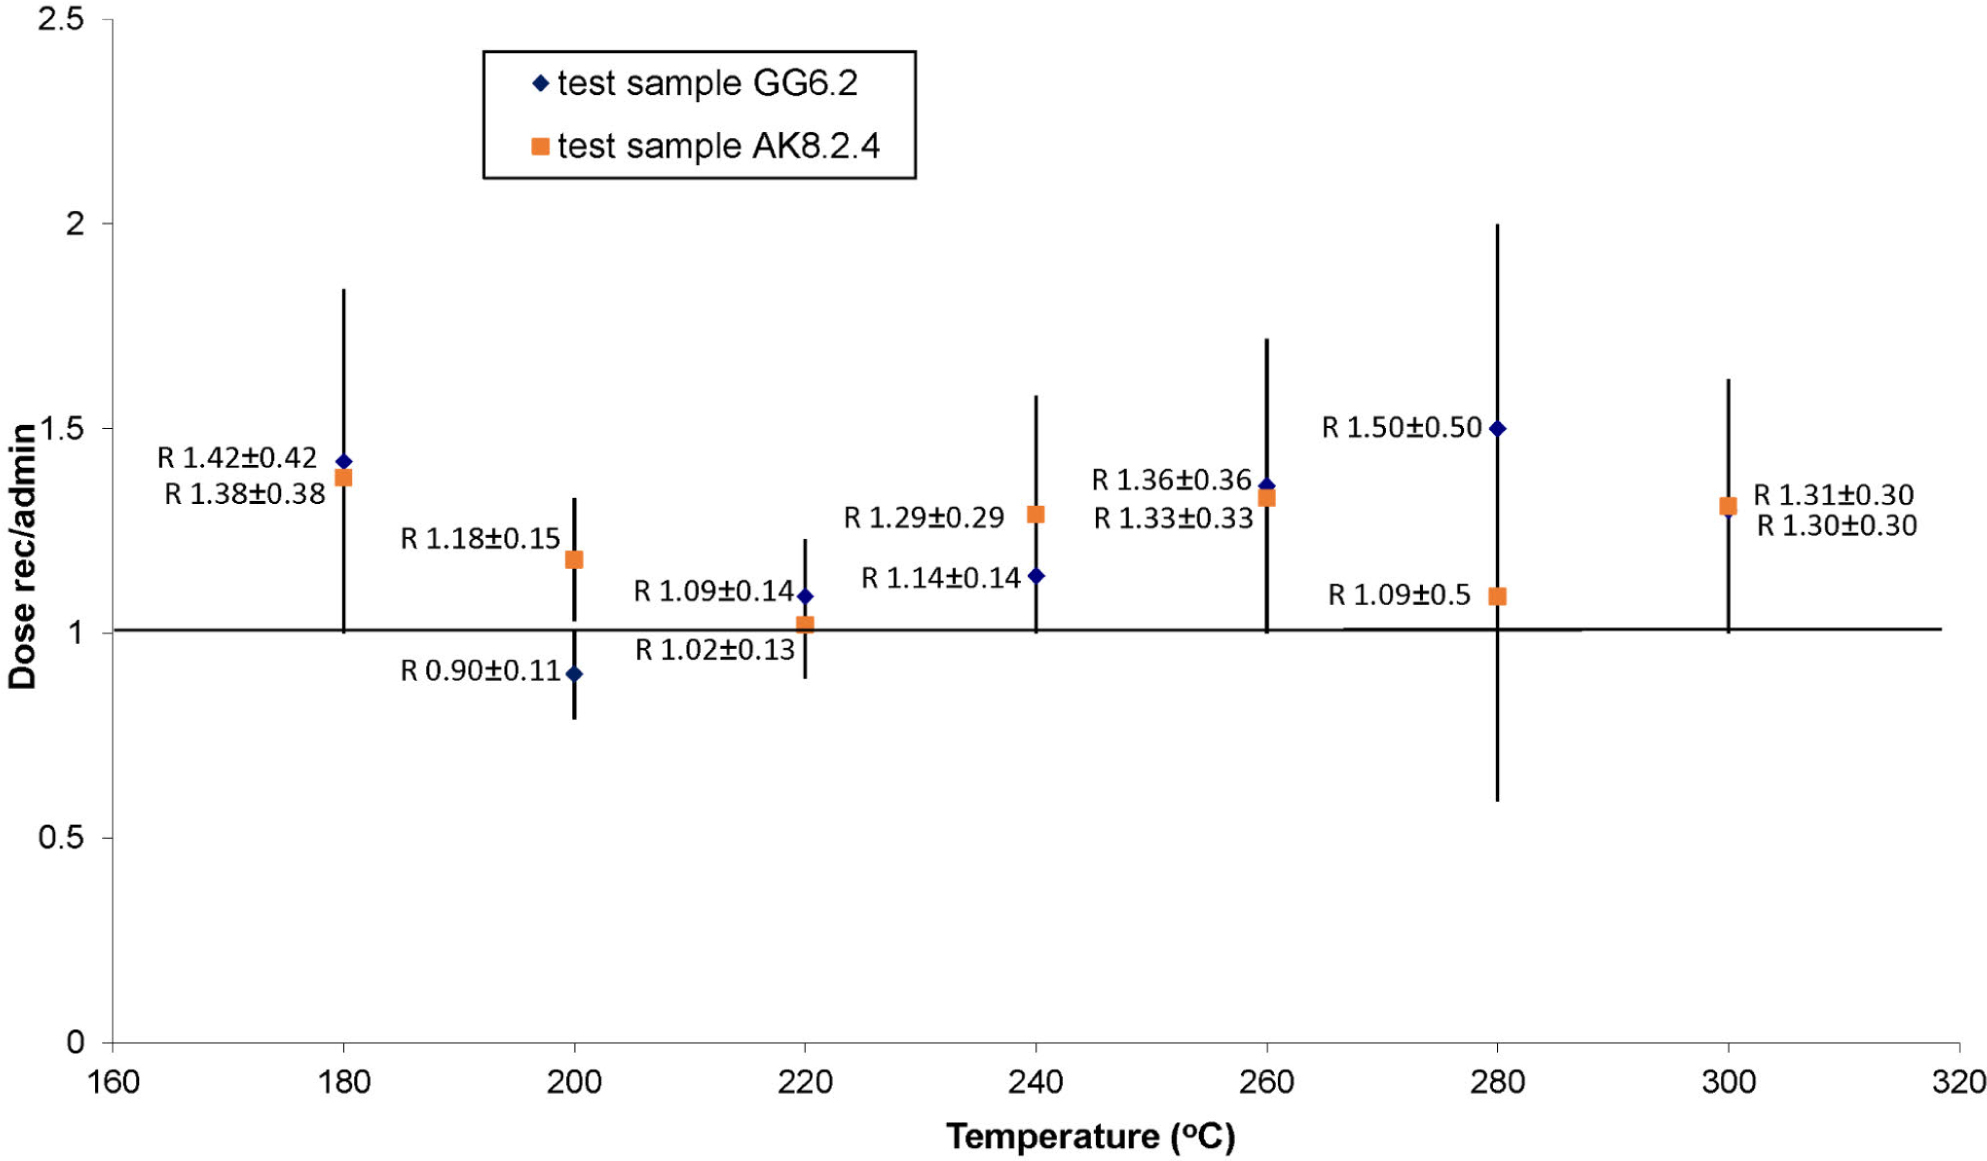
Nine sub-samples were processed derived from three removed stone pieces, two from Ain Khodra and one from Gebel Gunna (Table 2). The flat limited surfaces of the detached pieces which were wrapped in blue opaque bags were divided into regions of interest (ROI) (Fig. 6) where from separate EDs were measured. The latter precaution avoids possible friction which may remove sub areas of the original sun exposed surface. Surface sample was prepared as described above in section 2. All aliquots were checked with infrared (IR) stimulation to ensure the absence of feldspars. The dose recovery test (Fig. 7) varied ±15% around unity and the recycling point around 12% (the dispersed one in GG6.2 given the errors is reasonable; large scatter in the measurement could be due to random error during readouts). A pre-heat test (Fig. 8) provided the 220°C as the suitable to the material temperature threshold.
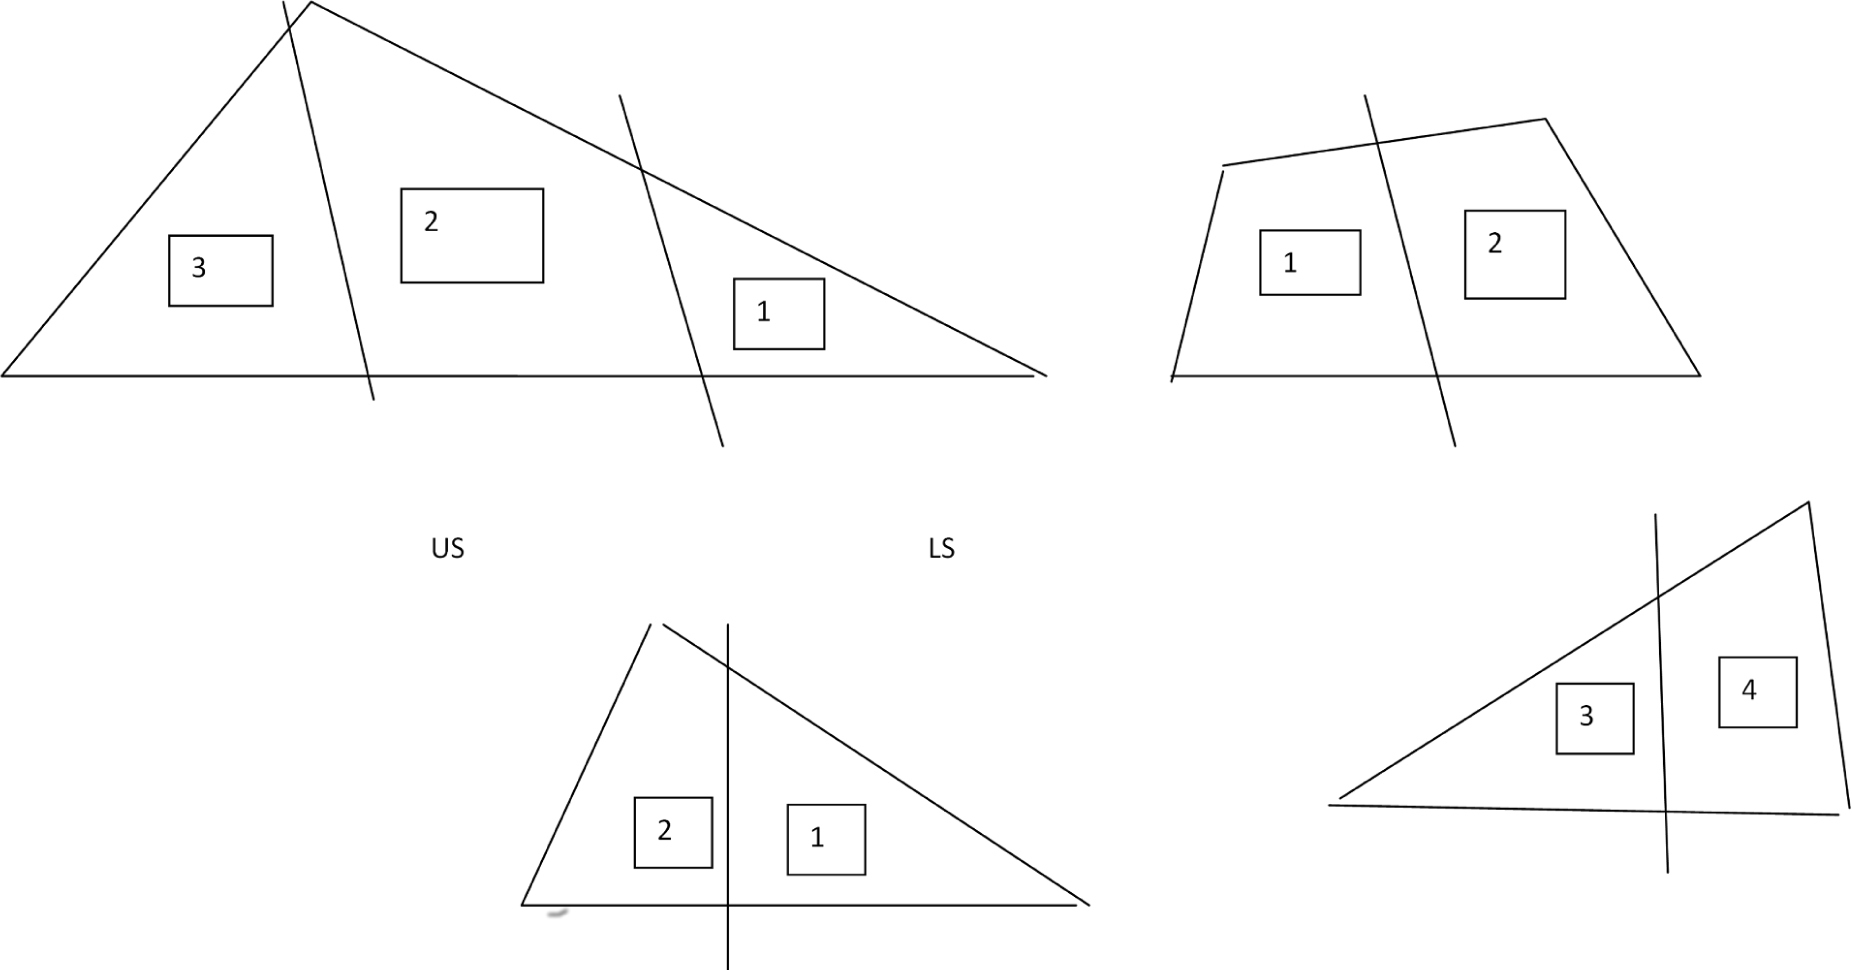
Fig. 6
a) (upper). Sampling three ROI as aliquot powder at a depth of around 1 mm, from Gebel Gunna, (GG6.1, GG6.2, GG6.3), B1) Ain Khodra, AK8.1.1, AK8.1.2; B2) US upper slab’s surface (AK8.2.1, 8.2.2), LS lower slab’s surface (AK8.2.3, AK8.2.4).
. Discussion
The burial structure at Gebel Gunna was amongst a set of six cists built of standing slabs and irregular cobbles, the ground level was sand and skeleton, ribs, other bones and beads were found that date to Late Bronze Age (Bar-Yosef et al., 1983, 1986). According to archaeologists its relationship to the neighboring structures at Gunna area is unclear. Typological examination and radiocarbon dating indicated 3rd millennium BC: for example, the two C-14 ages, at Gunna 25 of 4025 ± 72 BP (SMU-659) and at Gunna 100 of 4373 ± 64 BP (SMU-659) on charcoal from ovens, dug down to bedrock, located in same tomb, cluster but outside the age group of circular tombs (Bar-Yosef et al., 1986). It is worth mentioning the found skeleton of Roman-Byzantine period too. While tombs were used as primary burials, re-use of the structures has been noticed. They were mixed with secondary (later) burials, and/or later historical interventions. This is not surprising because strong stone structures are akin to be reused by later generations. Luminescence dating addresses this as it reinforces an additional value of being applied to reconfirm or question the age of internal findings and its intimate or far relationship with initial construction date.
The estimated ages vary between 1000–2400 BC for the two structures studied, obviously their cluster per sampling point correspond to slightly different ages that fall within the broadly acceptable Bronze Age of the Levant and southern Sinai (Killebrew and Steine, 2014).
For Gebel Gunna (GG6) the average dose from 3 subsamples provided a highly bracketed dose of 5.13 ± 0.53 Gy which corresponds to an age having as mean value the middle 3rd millennium BC (2220 ± 300 BC) but spanning throughout that Early Bronze Age millennium.
For the Ain Khodra the two samples (AK8.1, AK8.2) derived from the external wall at a height above the ex-ternal ground approx. 1 meter, and within a 25 cm distance between them. The sample 8.1 gave two similar De and a similar age to Gebel Gunna. The adjacent sample 8.2 consisted of two apparently safe contacts; the upper and lower ones from which four smaller, but one, De were deduced.
The age range of two upper surface slab sub-samples (8.2.1 and 8.2.2) from Ain Khodra falls within the 2nd half of 2nd millennium BC and those lower surface of same slab sub-samples (8.2.3 and 8.2.4) of 2130 BC and 980 BC respectively not averaged due to large difference (see Footnote 7 in Table 2).
Obviously the latter apparent unconformity can be at-tributed either to later building activities of this part or partial exposure to sunlight. However, the Late Bronze Age presence in Gebel Gunna tombs documented by Bar-Yosef et al. (1986) is also supported by present OSL results.
. Conclusion
The dating of two Nawamis tombs from two Nawamis fields in southern Sinai, Gebel Gunna and Ain Khodra, were re-examined, by applying for first time the surface luminescence dating. The standard procedure of sampling for surface luminescence dating of buildings was used, the SAR protocol was employed for ED estimation, and dose rate in mixed radiation field was properly evaluated. Total bleaching is assumed for the upper millimeter surface layer. OSL ages have been derived from nine sub samples of two tombs from Gebel Gunna and Ain Khodra.
Satisfactory criteria tests applied sway opinion that the calculated dates obtained correspond to Levant and southern Sinai archaeological phases of Early Bronze ages with presence of three dates at later Late Bronze period. Archaeological rescue excavation and C14 ages on charcoal from similar tombs as well as detailed typological analysis on plethora of tools indicated an Early Bronze age with some presence at later period.