
. Introduction
Tree-ring widths have globally been used for investi-gating the impact of environmental factors on tree-growth dynamics such as the rising atmospheric CO2 concentration (Gedalof and Berg, 2010) and rapid changes in SO2 and NOx air pollution (Bošeľa et al., 2014a) but also for cli-mate reconstructions (Popa and Kern, 2009; Büntgen et al., 2011) and testing vegetation models (Babst et al., 2013).
The reliability of tree-ring widths (TRW) relies on the exact dating of the year of their formation and therefore the correct dating of tree rings is a crucial methodological step in all dendroecological and dendroclimatic studies (Fritts and Swetnam, 1989; Maxwell et al., 2011). Particularly in European temperate forests, where climatic factors are less limiting to tree growth, the measurement of the tree-ring widths and their accurate cross-dating is important to preserve as much of the climatic information as possible with a minimum of “noise” introduced through errors (Holmes, 1983).
The issue is particularly important for diffuse-porous and semi-ring-porous tree species such as European beech wherein the vessel-size distribution is uniform throughout the year creating tree rings that are difficult to read (Schweingruber, 1988; DeRose and Gardner, 2010). European beech was found to have high a potential for dendrochronological studies (Dittmar et al., 2003; Lebourgeois et al., 2005) due to its widespread distribu-tion, sensitivity to climate and longevity (Di Filippo et al., 2007).
Due to a high degree of uncertainty with the cross-dating process, checking the dating accuracy against independent reference chronologies is highly desirable. With beech, the difficulty often emerges from the fact that as a widespread shade-tolerant tree species it frequently grows in unfavourable environments and/or be-low the canopy layer of dominant coexisting tree species (e.g. oak, spruce). At the upper distributional limit of beech, cool years with short growing seasons or extreme frost events could lead to the formation of very narrow or even missing rings (Hantemirov et al., 2004). Very hot and dry growing seasons at the lower distributional limit have the same effect. Cross-dating is much easier for dominant or co-dominant trees, often used for climate reconstructions (Briffa et al., 1998). However, when forest growth dynamics and forest production changes are to be studied, the sampling strategy must include trees from the entire forest stand cohort including trees that are supressed (Nehrbass-Ahles et al., 2014). So far, there is little knowledge on the ability of cross-dating trees from a variety of canopy positions and vigour classes (Lorimer et al., 1999).
In an effort to allow the full utilization of the dendro-chronological potential of beech and to contribute to improving the cross-dating process in general, we present a technique where visual dating before measurement is validated by instrumental climate data dated with absolute certainty. The properties and practical applicability of this method are demonstrated on datasets cross-dated without an independent regional chronology.
. Material and Methods
Study area
The study area is situated in the upper altitudinal vegetation belt (1300–1450 m a.s.l.) of the Poľana Mountain (48°38'N, 19°29'E), which is part of the Slovak Ore Mts. and belongs to the Western Carpathians. The area is char-acterized by cold mountain climate with a mean annual temperature of 3.5–4.0°C and an annual precipitation sum of 900–1100 mm. Here, European beech reaches its upper limit and grows mostly under the canopy of Norway spruce (Picea abies (L.) Karst.) which is the natural pre-dominant tree species.
The study material was collected in the years 2012 and 2013 at two sites near the top of the Poľana Mt. (Fig. 1). The site Predná Poľana (48°37'46''N, 19°27'44''E - PP) is characterized by less dense spruce-dominated stands overgrowing an abandoned pasture at 1300 m a.s.l. The prevailing south and south-east exposition enables beech ascending to high altitudes in sparse spruce forests.
Fig. 1
Location of Slovakia in CE Europe, enlargement of the study area and location of the two study sites Predná Poľana (dataset PP) and Zadná Poľana (dataset ZP), © EEA, Copenhagen, 2012.
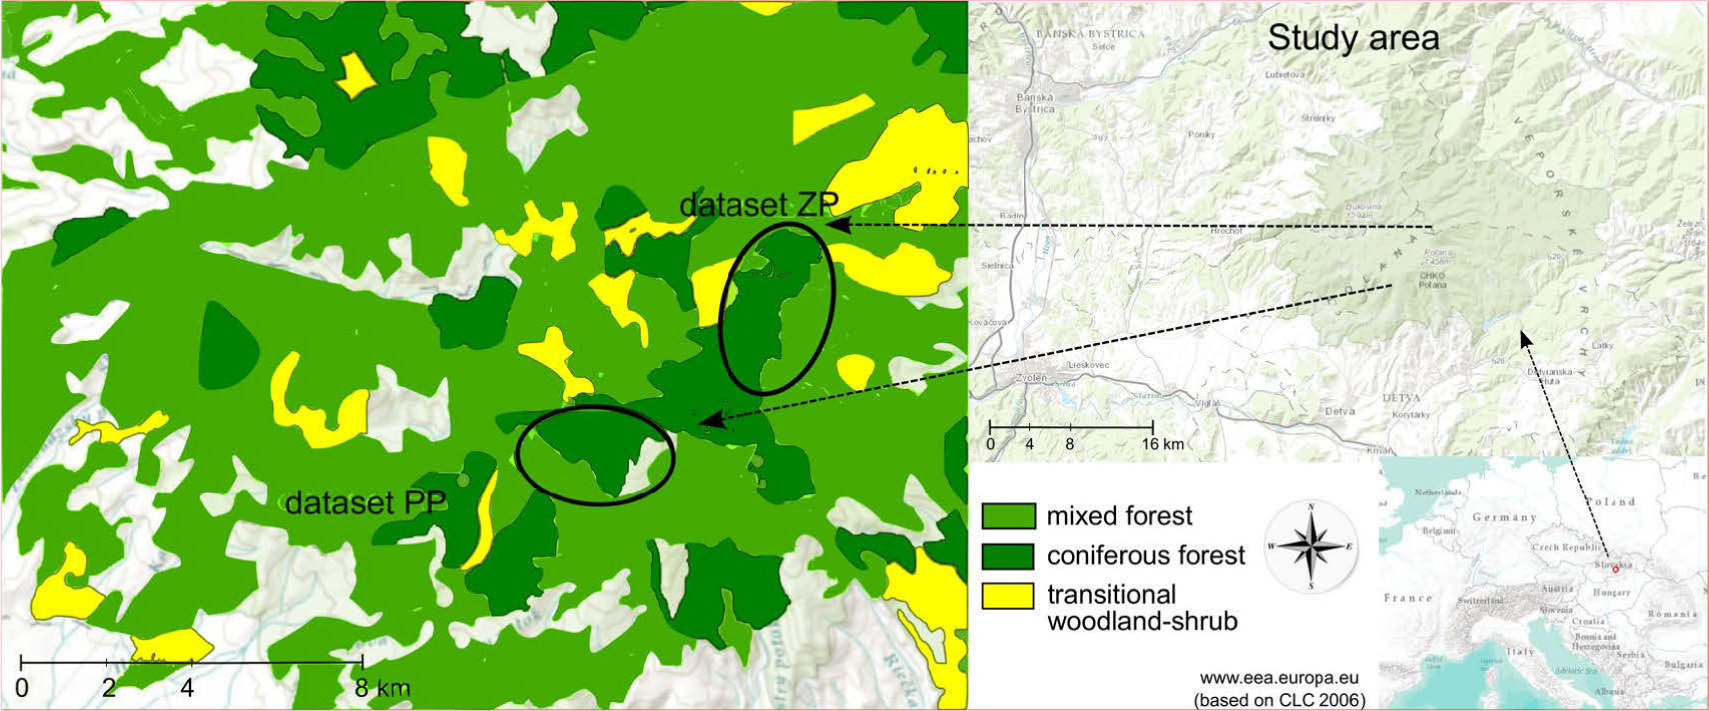
The site Zadná Poľana (48°28'23''N, 19°29'05''E - ZP) is characterized by a very old closed-canopy primeval spruce forest. The prevailing expositions are east and south-east. Beech occurs sporadically between 1100 and 1200 m a.s.l., i.e. 100–200 metres lower than at the PP site, mostly in patches of subdominant and dominant trees.
Climate data
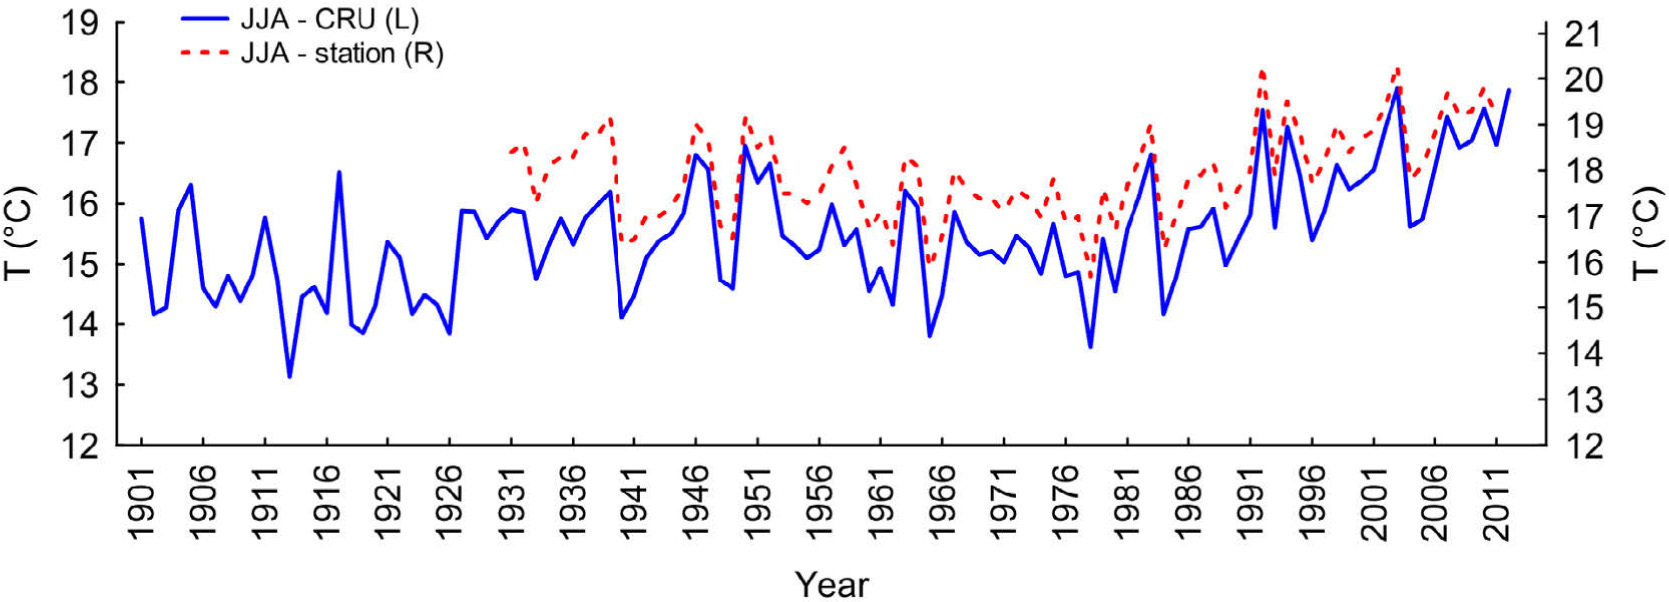
Monthly observations of CRU TS3.21 Mean Temperature (0.5° × 0.5° grid interpolated points) covering the time period since 1901 available at KNMI Climate Explorer (Harris et al.,2014; http://climexp.knmi.nl) were selected. To assess the reliability of the CRU data, the annual air temperature time series were compared with the data recorded since 1931 by the meteorological station Sliač about 20 km apart from the study sites (Fig. 2). Although air temperature in the CRU time series was, on average, higher by up to 2°C, but the trend and dynamics of the values of the two datasets were significantly correlated (r = 0.96). Due its length, we preferred the CRU TS3.21 record.
Fig. 2
Interpolated CRU TS3.21 mean temperature data (solid line) to the point of the meteorological station Sliač compared to mean SHMI (Slovak Hydrometeorological Institute) temperature data (dashed line). JJA (June, July and August) temperature was calculated as arithmetic mean of monthly mean temperatures.
Sampling and tree-ring measurements
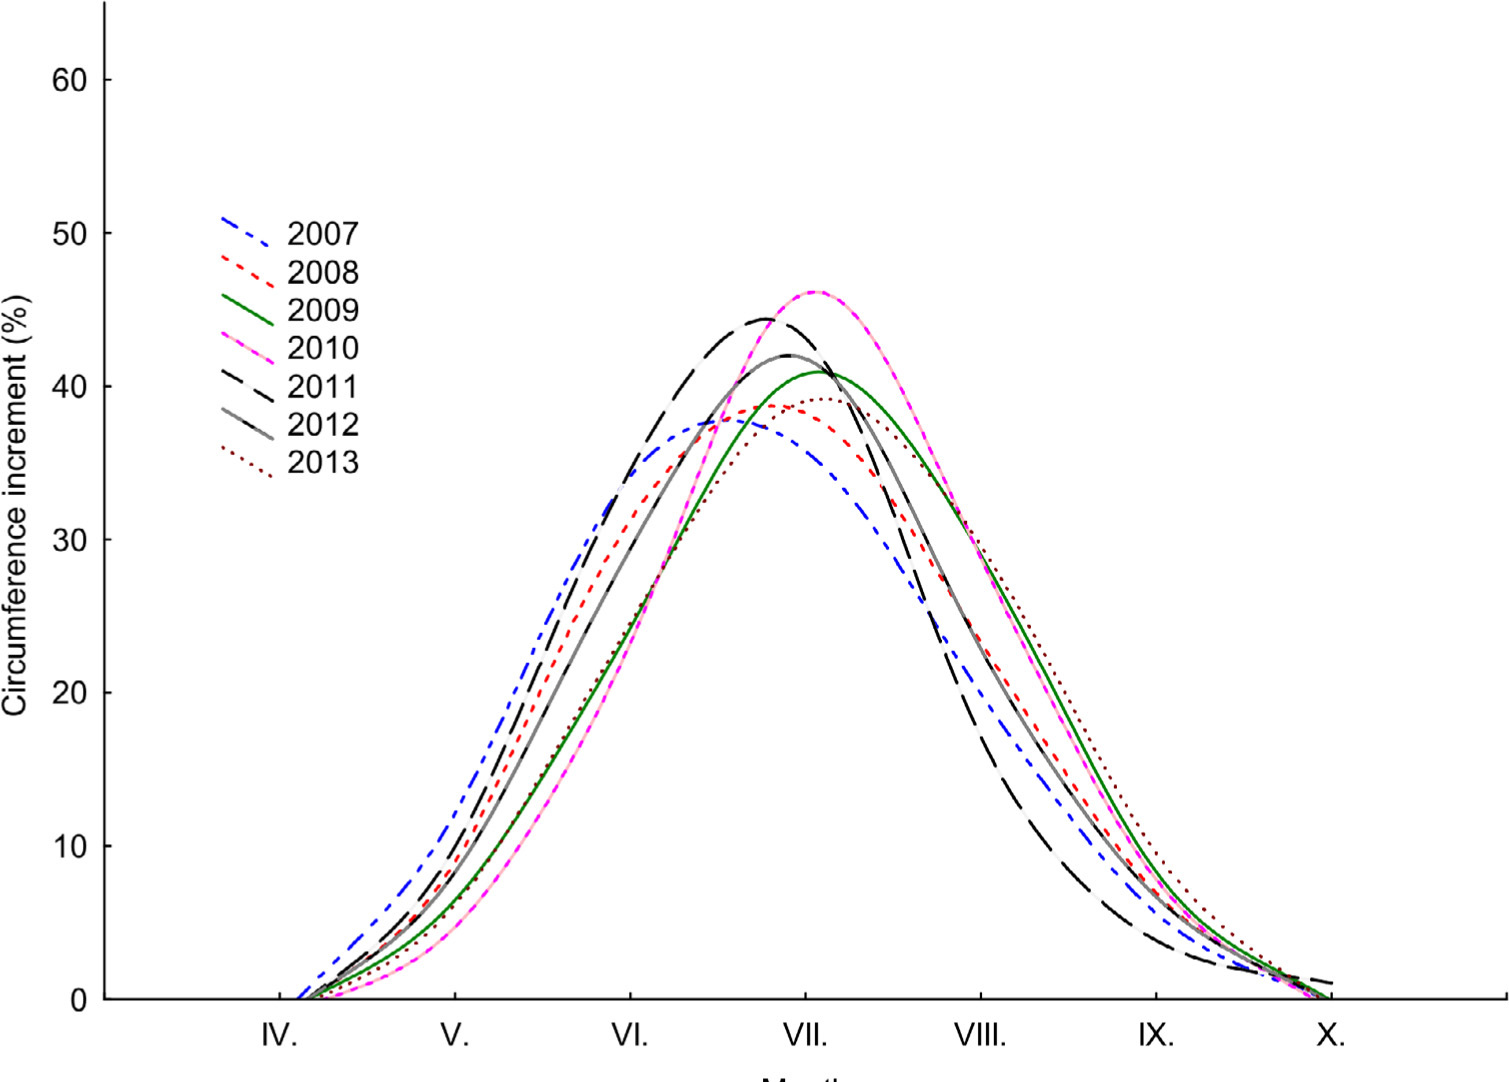
Eleven trees (two cores per tree) were sampled at Predná Poľana (dataset PP) and 10 trees (one core per tree) were sampled at Zadná Poľana (dataset ZP). The trees at PP were younger (pith age 60–80 years) than the trees at ZP (pith age 130–170 years). All cores were mounted into 5 mm wooden bars, air-dried and sanded by grain paper (400–600 grain). The TRW were measured to the nearest 0.01 mm with the digital positiometer DAS (Digital Analysis System, Janíček, 1994) and processed by standard methods (Cook and Kariukstis, 1990) using the TSAP-Win software (Rinn, 2003). In addition, at PP, the changes in stem circumference were measured using automatic band dendrometers — DRL 26 (EMS Brno, Cz), installed on three beech trees at 2.5 m above the ground during seven vegetation periods from 2007–2013.
Cross-dating
Three cross-dating methods were applied: (1) Visual cross-dating by graphical comparison and alignment of individual TRW series (Schweingruber, 1983); (2) dating by skeleton plotting in combination with the memorization method when the visual quality of the study material did not permit the use of simple graphics (Speer, 2010); (3) a new procedure for cross-dating of cores from living trees (referred to as combined dating method) (see Appendix A).
The practical applicability of the combined dating method was tested and validated in separate ways: (i) comparing the dating results by two independent re-searchers; (ii) comparison with an independent reference chronology for beech growing at its upper limit in the nearby mountain range Vtáčnik (48°38´N, 18°39´E; 1240 m a.s.l.) (Dittmar et al., 2003); validation on an inde-pendent dataset (a single stand of beech) and its compari-son with a reference chronology (Dittmar et al., 2003) and with a constructed climate reference series, and (iii) indirectly by testing the ability of the new method to reveal visually undetectable micro-rings through micro-sectioning.
High resolution cross-dating (light microscopy)
Cross-dating of a problematic core using the combined dating approach was verified by micro-sectioning and examination under a light microscope. Thin sections were prepared following Gärtner and Schweingruber (2013). The core was split length wise into 2 parts. The part used for detailed examination was saturated in water and complete cross-section (approx. 20 µm thick) was cut using a GSL1- microtome (Gärtner et al., 2014), and stained with Safranin and Astrablue to increase the visi-bility of the cell walls and other structural features. These sections were chemically dried with ethyl alcohol and xylene and fixed to a microscope slides using Canada Balsam. The samples were examined under a light micro-scope. Subsequently, the second part of the core was measured on the digital positiometer.
Independent dataset
Tree-ring series in a pure beech stand (site Veľké Pole-dataset VP; 48°33.29'N, 18°31.10'E; 500–530 m a.s.l.) in the Štiavnické Mts. were collected from 13 trees in the canopy layer in 2014 (one core per tree either from the north or east exposed side). This 50-year old beech stand down to the east and with an slope of 30° is located at the boundary between the optimum and the lower distributional limit of beech. Monthly observations of CRU TS3.21 Precipitation (0.5° × 0.5° grid interpolated points) since 1901, available at KNMI Climate Explorer (Harris et al., 2014; http://climexp.knmi.nl) and corresponding to the sampling site, were selected to construct climate reference series (June to August precipitation sums). The reference chronology Žiar n. H./Štiavnické Mts. (48°33'N, 18°54'E, 600 m a.s.l.) (Dittmar et al., 2003), was used for comparison.
. Results
Statistical characteristics of the chronologies after cross-dating
Dendrochronological characteristics such as mean TRW, standard deviation (SD), mean sensitivity (MS), first-order autocorrelation (AC1), series inter-correlation (Rbar), coefficient of coincidence (Gleichläufigkeit GLK%) and expressed population signal (EPS) were calculated for the raw site chronologies using the average of the TRW series at each site after cross-dating (Table 1). Both higher MS and SD values indicate that tree-ring series are very sensitive, i.e. they exhibit a large inter-annual variability of TRW, a higher frequency of irregu-lar growth patterns, completely missing rings or extreme-ly narrow rings (micro-rings) that may hamper the cross-dating. Low AC1 values indicate that the series are not highly auto-correlated which could help facilitate the cross-dating process. Despite a higher sensitivity of individual series and their low number, the rather high values of GLK%, EPS and Rbar indicate successful cross-dating. The resulting chronologies are of good statistical quality and are representative for a common climatic signal rec-orded for a site (tree species population) in the mean chronology (sensu Wigley et al., 1984).
Table 1
Basic descriptive statistics of the raw European beech tree-ring site chronologies.
| Dataset1 | Period2 Length | TRW Mean Min-Max | N | SD | AC(1) | GLK% | MSs% Mean Min-Max | MSc% | R-bar | EPS |
|---|---|---|---|---|---|---|---|---|---|---|
| PP | 1940–2012 | 247 | 11 | 71.5 | 0.35 | 79 | 34 | 27 | 0.48 | 0.90 |
| 73 | 91–383 | (10) | 26–53 | |||||||
| ZP | 1857–2012 | 148 | 10 | 50.4 | 0.56 | 77 | 38 | 27 | 0.56 | 0.92 |
| 156 | 45–302 | (9) | 34–50 | |||||||
| VP | 1957–2014 | 210 | 13 | 52.4 | 0.21 | 82 | 31 | 26 | 0.48 | 0.92 |
| 58 | 78–328 | (13) | 26–37 |
2 Period and length of chronology with sample depth over 4 series; TRW — tree-ring width (1/100 mm); N — number of series, in parenthesis mean number of series in chronology; SD — standard deviation; AC(1) — 1st order autocorrelation; GLK% — coefficient of coincidence Gleichläufigkeit; MSc% — mean sensitivity of the chronology; MSs% — mean sensitivity of individual series in %; R-bar — series inter-correlation; EPS — expressed population signal.
Cross-dating by currently used methods
Increment cores from the PP dataset were cross-dated using the graphical comparison method (Schweingruber, 1983). The tentative reference curve was constructed as the arithmetic mean of the individual TRWs for each calendar year from a subset of seven series with the highest interseries correlation (r > 0.6) and the highest coefficient of coincidence (GLK > 80%). The rest of the material was graphically cross-dated with the tentative reference curve. Skeleton plotting, in combination with the memorization method (Speer, 2010), was used for the dataset ZP, in which most cores showed difficult to recognize ring structure and rather poor quality. The tentative reference curve was also constructed from a subset of the seven best measurable series. The comparison of the two reference curves (constructed separately by two in-dependent operators in 2012 and 2013) from two nearby localities showed several apparent inconsistencies in dating of the same marker rings and characteristic ring patterns (visually clearly detectable in both datasets). When the cross-dating of the individual series in both ZP and PP data sets were checked with COFECHA (Holmes, 1983; Grissino-Mayer, 2001), no crucial errors or misdated series were identified.
Cross-dating by the combined dating method
As no local tree-ring chronologies were available as independent references, instrumentally measured climate records were taken to check the calendar years of tree-ring formation. We assumed that temperature is the most limiting factor for the growth of beech at its upper distribution limit. According to Ježík et al. (2011), the cambium of beech in central Slovakia is active from June to August (Fig. 3) so that this 3-month period of temperature was taken to be correlated with the TRW series (r = 0.43). The combined dating method (Appendix A) started with the selection of the seven longest and best measurable series (with the widest rings) from the ZP dataset (group of very old dominant trees at the mountain ridge). After visual dating, synchronization and exact measuring of the TRW of these cores, the preliminary constructed reference curve was checked with COFECHA in order to eliminate possible raw measurement errors. It was then also checked against the inde-pendent climatic record through moving correlation (30 year moving window). When abnormalities in these run-ning correlations appeared, a re-inspection of the cores was done for possible dating errors. The final dating of marker rings/patterns in the validated tentative reference was recorded. The rest of the series from the ZP dataset and all series from the PP dataset were visually cross-dated using the memorization method in a way that all identified marker rings/patterns were properly aligned to rings in the wood (Yamaguchi, pendent climatic record through moving correlation (30 year moving window). When abnormalities in these running correlations appeared, a re-inspection of the cores was done for possible dating errors. The final dating of marker rings/patterns in the validated tentative reference was recorded. The rest of the series from the ZP dataset and all series from the PP dataset were visually cross-dated using the memorization method in a way that all identified marker rings/patterns were properly aligned to rings in the wood (Yamaguchi, pendent climatic record through moving correlation (30 year moving window). When abnormalities in these running correlations appeared, a re-inspection of the cores was done for possible dating errors. The final dating of marker rings/patterns in the validated tentative reference was recorded. The rest of the series from the ZP dataset and all series from the PP dataset were visually cross-dated using the memorization method in a way that all identified marker rings/patterns were properly aligned to rings in the wood (Yamaguchi, 1991). Finally, all series were measured and additionally checked with COFECHA and corrected for possible mistakes in measurements.
Testing the quality of the proposed method
Comparison of the mean curve constructed by the combined dating method and the mean curve constructed by the graphical method for the PP site (Fig. 4a) shows that both methods provide consistent results for the last 40–50 calendar years. Correlations between the tempera-ture records and common graphical method suddenly drop and are consistently lower in comparison with the moving correlations of the combined dating method. The combined dating method also improves the empirical signal strength statistics of the mean chronology (Rbar increases by 0.07 and EPS by 0.02).
Fig. 4
Interpolated CRU TS3.21 mean JJA temperature series and indexed chronology for the PP site; a) arrows indicate a one-year shift in the chronology when comparing the cross-dating of the same material with the common graphical method (PP-common; Rbar = 0.408, EPS = 0.884) and with the proposed combined dating method (PP-combined; Rbar = 0.479, EPS = 0.902); there is an agree-ment between cross-dating by both methods up to approximately 1956 from there on, discrepancies in dating are evident. b) Comparison of indexed chronology for the PP site established by two independent dendrochronologists through appli-cation of the combined dating method (PP-combined-independent; Rbar = 0.482, EPS = 0.903).
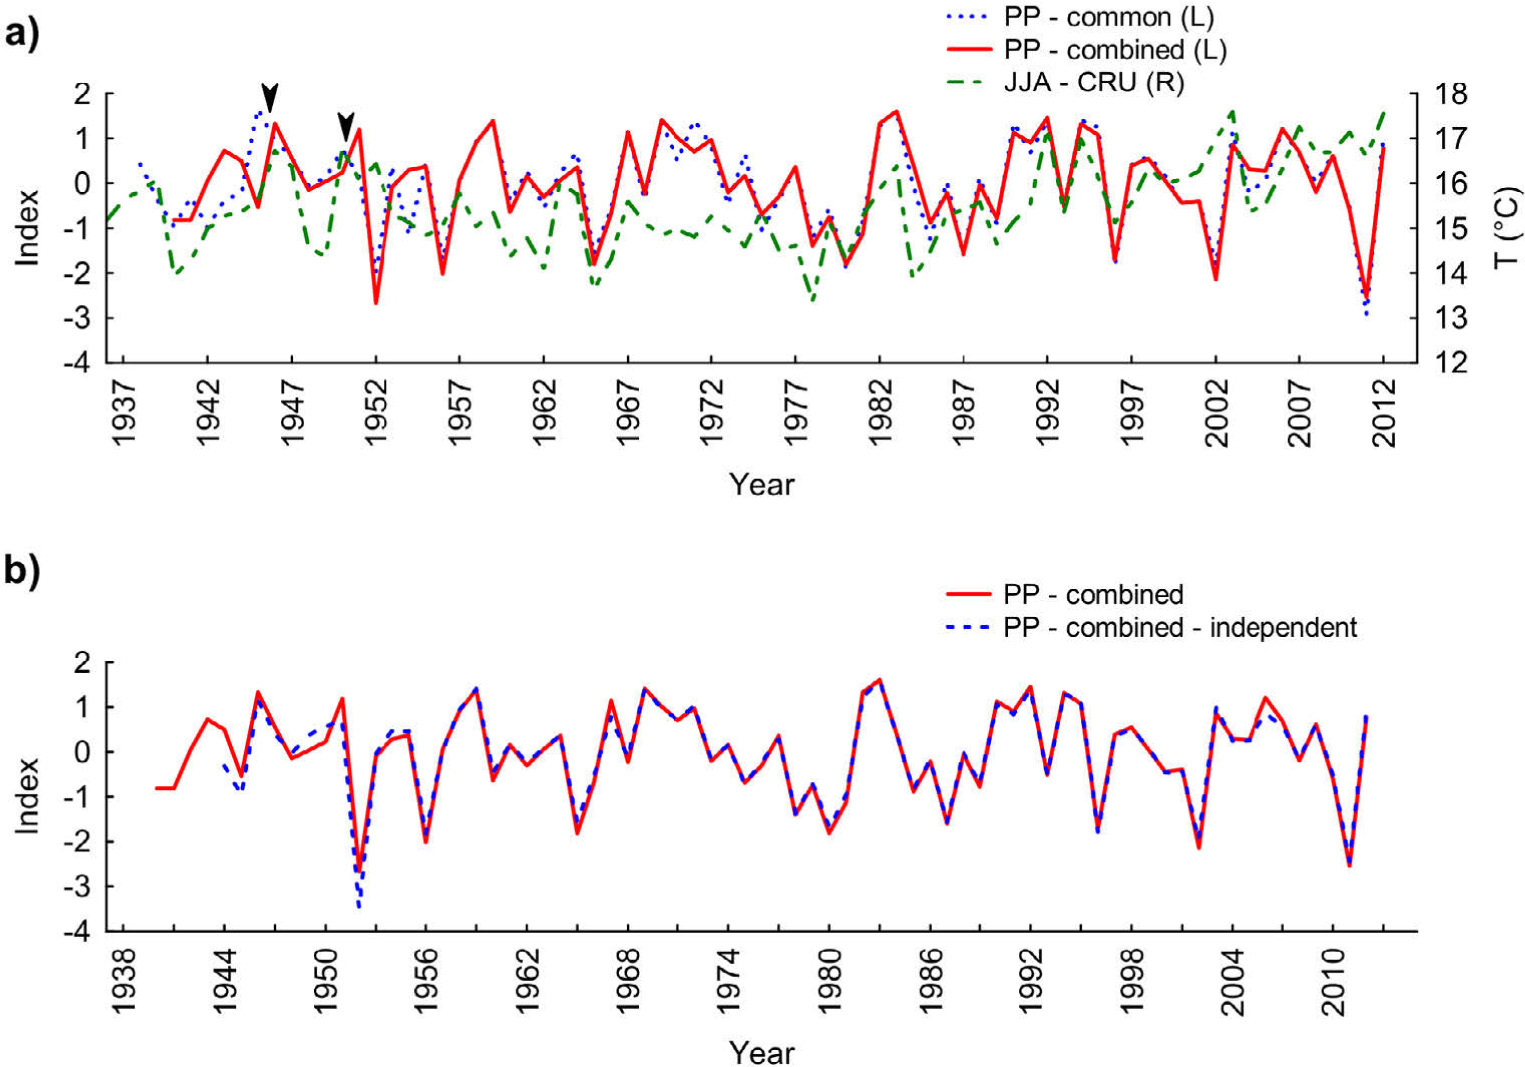
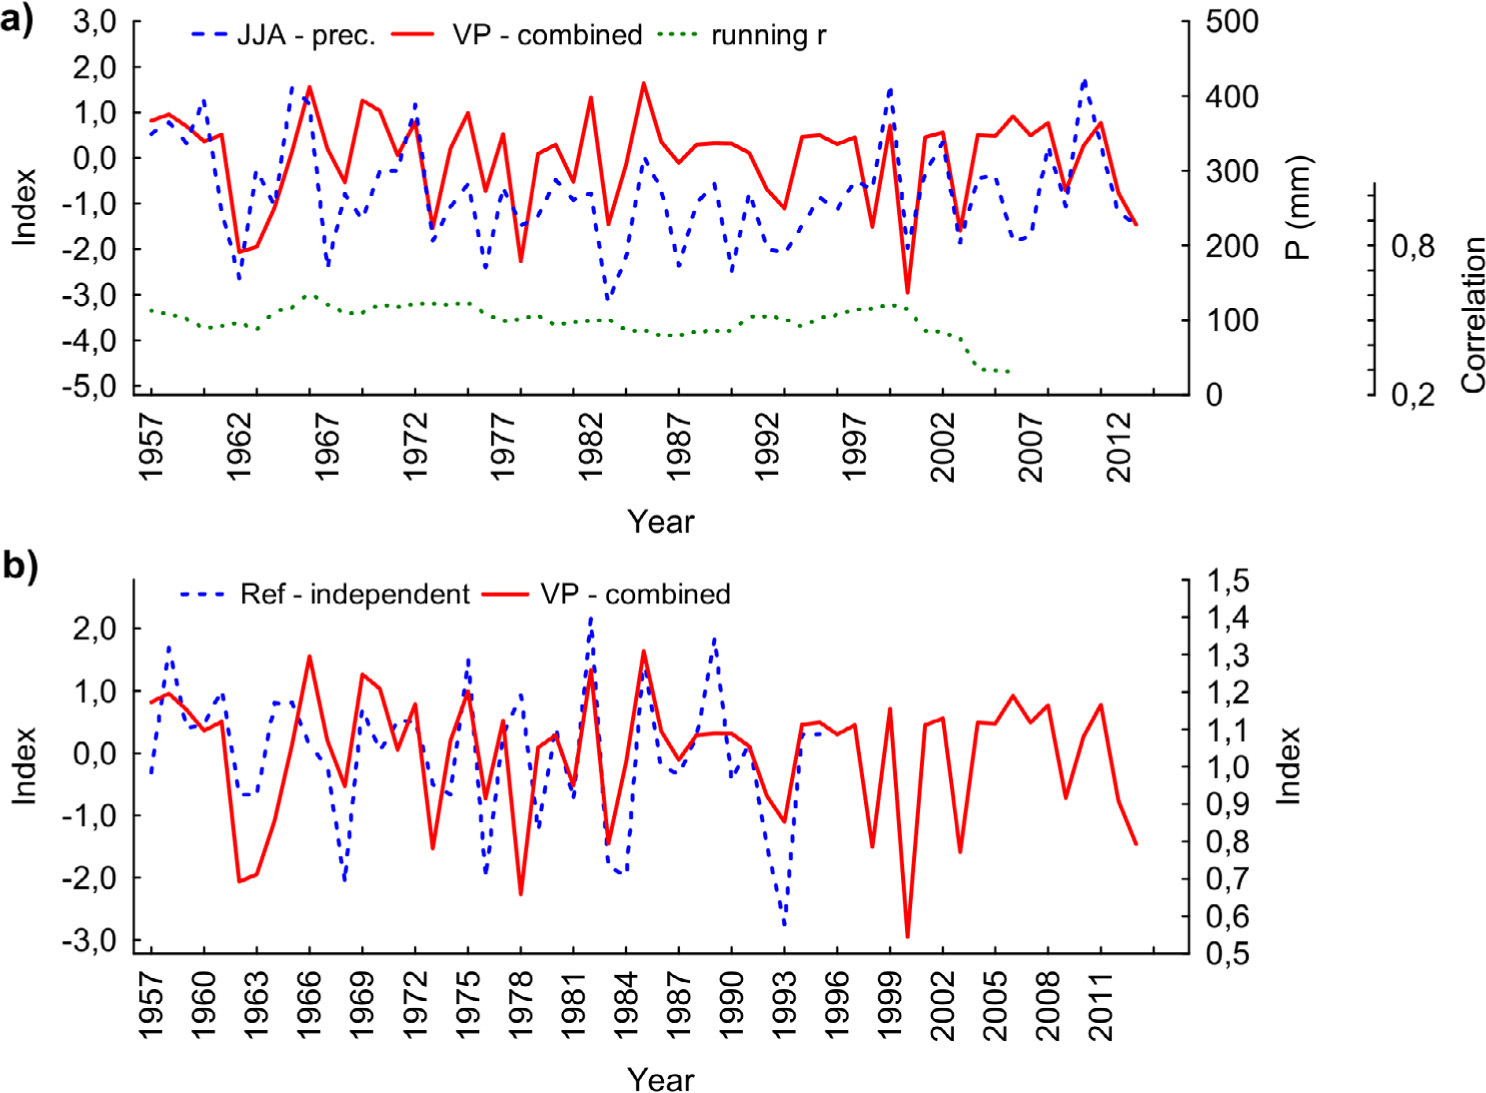
To validate the combined dating method, another dendrochronologist independently applied the procedure to all 11 tree-ring series from the PP dataset (Fig. 4b). By visual examination of the wood, assigning and recording marker rings and prominent growth patterns the dendro-chronologist was able to construct a reference curve that coincides with our reference curve (no difference in Rbar and EPS statistics). Additionally, the reference chronology for the Poľana Mt. was checked for dating against the independent reference curve from the Vtáčnik Mts. (Dittmar et al., 2003). The reference chronology Poľana was concurrent with both the climatic record and the independent reference chronology Vtáčnik (Fig. 5). Finally, the applicability of the method was validated on the series originated from only one single stand, in which 13 cores were selected to construct a tentative reference curve (for statistical characteristics, see Table 1). The correlation of the mean TRW series with precipitation sums from June–August was significant, r = 0.36 (correlation of the indexed series vs. the master series from COFECHA was r = 0.50). As the correlation was considered sufficiently high, June–August precipitation sums were utilized as a reliable independent reference. Once again the constructed reference chronology was checked against the independent reference chronology from Žiar n. H./Štiavnické Mts. (Dittmar et al., 2003). The constructed tentative reference curve Veľké Pole coincided with both the climatic record and the independent reference chronology (Fig. 6).
Fig. 5
Indexed chronologies for the ZP site compared to a) a mean JJA temperature series, and b) to inde-pendent reference chronology from Dittmar et al. (2003).
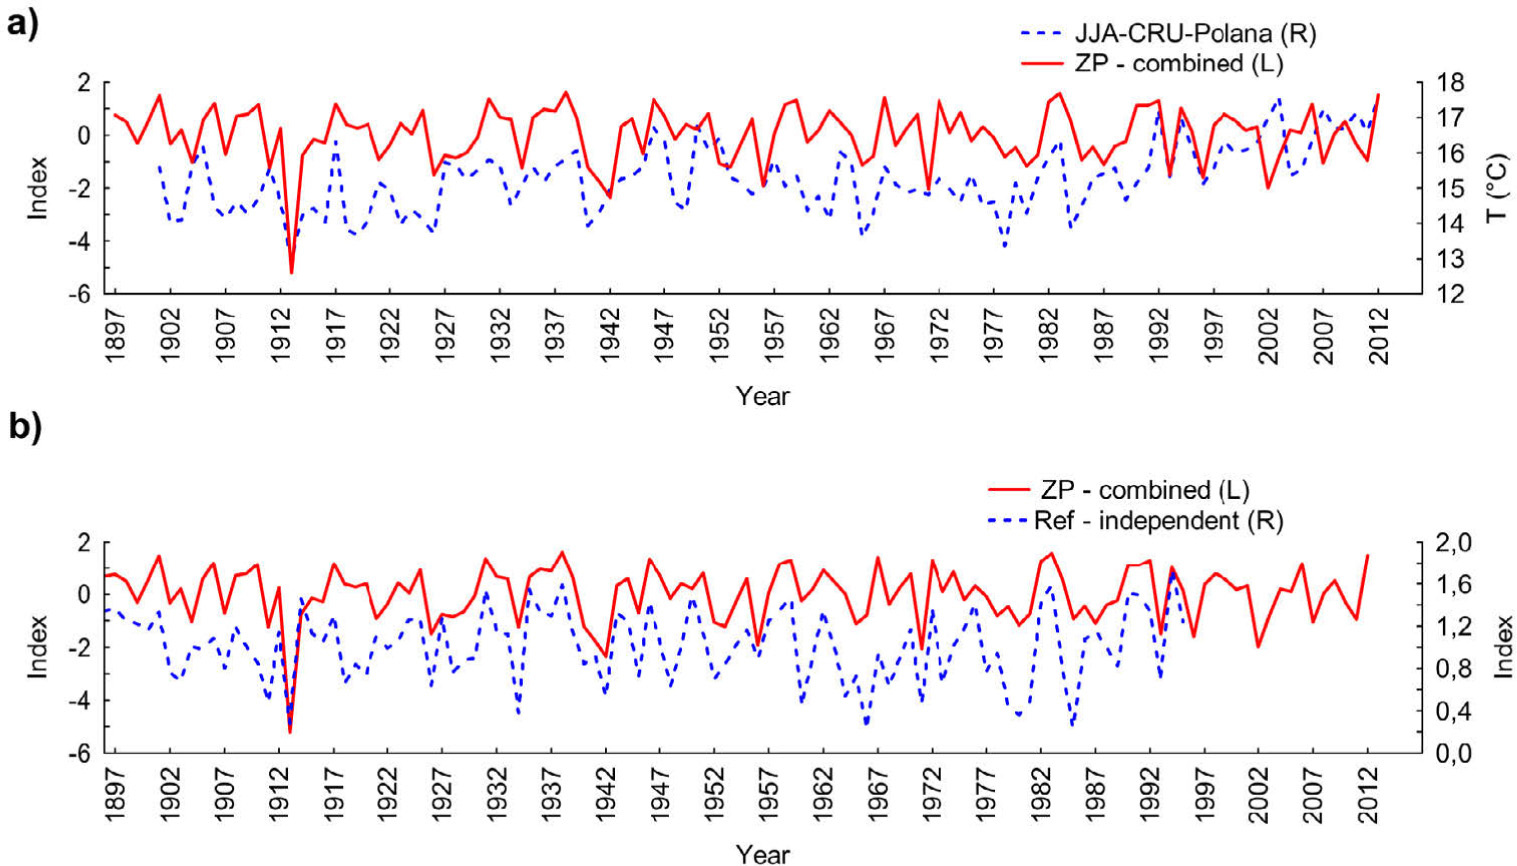
Fig. 6
Indexed mean series for VP site compared to a) a mean JJA precipitation series, and b) to an independent reference chronology from Dittmar et al. (2003). The green curve in (a) shows 30-year running correlations between mean series (VP site) and JJA precipitation sum records reaching on aver-age r = 0.5 with a range of values from 0.61 to 0.29 (at the end of the series).
In addition, the evidence of the dating ability of the combined dating method was validated using light microscopy. Three cores from ZP were taken from sup-pressed, slow-grown beech trees with very narrow rings (Fig. 7). The TRW series often contained more than one problematic segment for which correct visual detection of the number and borders of the rings was impossible. If cross-dating is applied using the common graphical methods, such cores are frequently considered intractable and excluded from further investigation.
Fig. 7
a) Common beech TRW series 7_12 (on top) and established mean chronology (below), (TRW in 1/100 mm); b) since it was impossible to identify the true number of rings with a digital positiometer, micro-sections were used to verify the correct number of rings in problematic seg-ments of the core; within a distance of about 1.5 mm eight micro-rings were detected; TRW —tree ring width, scale 200 μm; c) beech tree of about 120 years old (pith age at coring height) with a diameter of 19 cm and a height of 19.5 m experienced repeated growth depressions lasting for about 5 years.
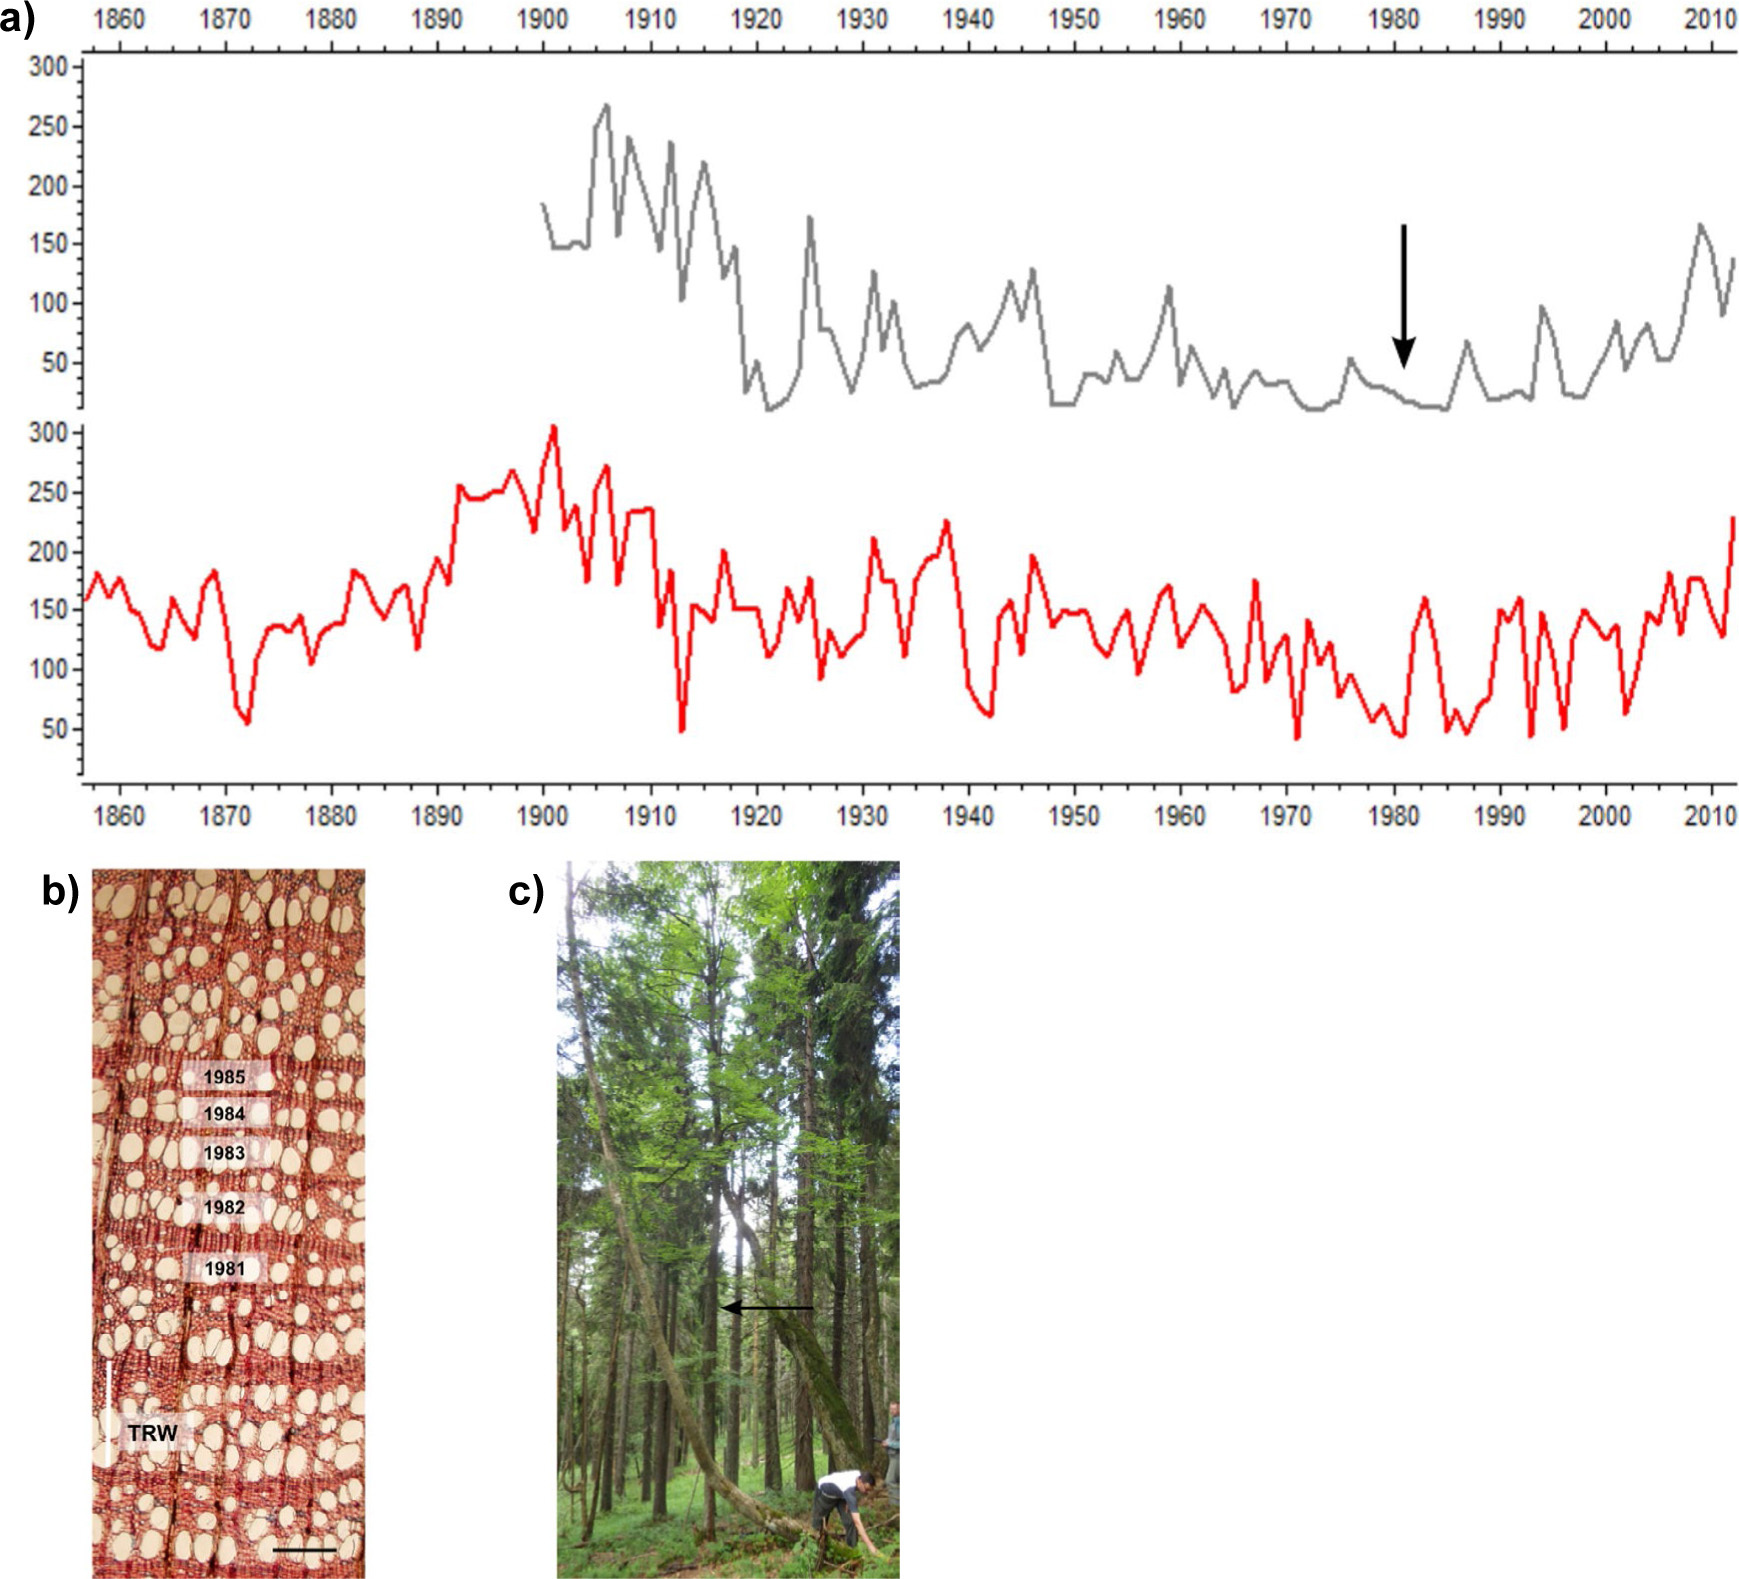
After inspection of the micro-section the number of rings were counted and measured. The comparison of an established chronology and the single tree-ring series revealed the problematic segment (Fig. 7a). The combined dating method indicated 8 missing rings confirmed by micro-sectioning (Fig. 7b). The possible explanation of this issue is that suppressed sensitive trees exhibited repeatedly reductions in growth lasting 5–8 years.
. Discussion
The core idea of the proposed cross-dating approach is the validation of uncertain subjective decisions in da-ting of the tree ring series. The method especially applies in cases of unclear TRW boundaries, frost rings, intra-annual growth pulses, ring wedging, missing or micro-rings, etc. It relies on the assumption that if TRW series or working chronology is misdated, its correlation with climate is essentially reduced, although, in reality, climate variability is objectively incorporated into TRWs. This simple idea is strongly supported by Esper et al. (2013), whose findings clearly suggest that the systematic shift in dating in the working reference chronology would be accompanied by either very low or no correlation with climate.
The proposed cross-dating approach is to simplify and verify the subjective decision of the researcher regarding the visual assessment of tree-ring boundaries. In general, for each tree ring there is five possibilities affecting the dating (insert, join, delete, divide and leave without change). For example, in the 30-year segment with only, let’s say, 4 problematic boundaries there exist in total 54 = 625 combinations of possible decisions. A large sampling design is thus required to explicitly capture complicated spatial patterns of climate-growth relation-ships even for relatively small geographic areas (Büntgen et al., 2010). The uncertainty of correct dating grows exponentially in the absence of independent reference chronology combined with small available dataset and even a relatively short sequence of problematic rings can cause “dating collapse”. Situations when TRW samples are collected in one research plot in the region are, how-ever, frequent. For such cases, the proposed method may be essential to reach successful cross-dating.
Extensive research is needed especially for the shade-tolerant beech as one of the main tree species in Europe, which often grows in understorey of the mixed stands on boundaries of its natural range (i.e. climate sensitive sites). Although some reference chronologies were developed for conifers in the region, their climate-growth responses often differ from that of broadleaved trees, even in the same locality (Castagneri et al., 2014; Hartl-Meier et al., 2014). Therefore, many reference chronologies are to be constructed based on a large number of TRW series for each distinct site in the region. Such extensive sampling is, however, costly and time consuming.
Under such circumstances it is very convenient to use freely or easily available instrumental records as an alter-native reference chronology. One option can be using the climate records from the nearest meteorological stations. However, the proposed method does not require very precise climate data for the each sampling point. As was shown in our study, gridded CRU TS, a freely available climatic series, was sufficient for cross-dating and has already been used in many dendroclimatological studies in other European regions (e.g. Babst et al., 2013; Büntgen et al., 2007, 2009, 2013).
The instrumental time series is used to control the subjective decisions of the researcher. The climate records partly replace the role of working reference chronol-ogy (which cannot be reliably constructed using a very small sample size) and partly serve as a validation tool similar to an independent reliable dated regional chronol-ogy (which might not be available for the site). In gen-eral, the climate records mainly serve for the identifica-tion of suspicious segments with reduced climate-growth correlation, suggesting a misdating, which should be re-assed and re-inspected on the wood.
However, a concern of a “cycling error” (using climate records for validation of tree-ring sequences and then using these sequences for climate reconstructions) could arise. But indeed, this possibility is almost excluded if two simple conditions are met: (i) any purposive adjustment of the measured tree-ring widths in order to artificially increase the correlations with climate without visual justification on the wood are not allowed and per se (ii) manipulation with available climate records is fully excluded. When trial shifts of dating position of the segment does not result in a correlation increase, the low correlation with climate is accepted as a fact and any deliberate interventions to TRW measurements are not justified and thus not allowed. On the contrary, employing climatic records for cross-dating can be considered as the first phase in constructing a dendroclimatic model and can improve the extraction of the climate signal from tree-ring series.
Anyhow, the method is based on the assumption that the relationship between climate and tree growth has a non-zero magnitude and is time-stable (Fritts, 1976). Although significant and temporally stable correlations when testing temporal coherence between TRW, maximum latewood density (MXD) and observed JJA summer temperatures in chronologies from cold environments have been demonstrated (e.g. Esper et al., 2013). Several studies reported a change in climate sensitivity and temporal stability toward the end of the 20th century (e.g. Briffa et al., 1998; Di Filippo et al., 2007; Leal et al., 2008; Bošeľa et al., 2014b). This deviation may thus cause a problem in the application of the combined dating method. For instance, as correlation between TRW and temperature decreases, temperature variation is no longer sufficiently recorded in the tree rings and an-other climatic variable has to be used for successful cross-dating. As was illustrated using the dataset VP, the combined method is not specifically limited to the use of temperature measurements. Any reliable dated climatic instrumental record can be used instead. Therefore, when a tree-ring series loses the sensitivity to the originally selected climate variable, it can be replaced by another available alternative.
Adverse (cool, rainy and short) growing seasons in temperature limited environments may lead to the formation of very narrow rings (micro-ring, Hantemirov et al., 2004), so may go completely undetected in all sam-pled trees. In this regard the proposed method allows the detection of the missing rings throughout the entire sample set. The ability of the method to reveal missing rings is sufficient allowing detecting even the whole sequence of missing rings (as it was proved on the core of the most problematic suppressed tree). The correct number of missing rings on the tree was obtained by micro-sectioning.
Many of the problematic trees are suppressed trees for which the exclusion is acceptable when considering that unreliable cross-dating would introduce a lot of noise to the chronology (Lorimer et al., 1999). On the other hand, the suppressed trees are frequently demanded for eco-production analyses (Nehrbass-Ahles et al., 2014) and facts derived from suppressed trees could provide valuable deep-insight information about the stand development (especially disturbance history).
If core exclusion is unavoidable, the additional coring of more trees from particular or nearby localities should be employed. However, both approaches – microsectioning and/or additional coring – are rather costly and time consuming. From this point of view, the combined cross-dating method has a good potential for better exploitation of empirical material.
. Conclusions
The proposed combined method resulted in the successful construction of a reference chronology despite the small sample size and the absence of the regional chronology. The proposed dating technique demonstrates its ability to markedly facilitate the process of cross-dating, particularly of trees from limiting environments or sup-pressed trees. The method allows the detection of rings that are completely missing or hardly identifiable.
The method was applied to ring series of living beech trees from sites where temperature or precipitation was identified as the most prominent growth limiting factor. The applicability of our approach thus needs further testing for different environments and tree species where other climate factors drive the tree growth. However, since the method has been successful for small datasets of under-canopy trees and problematic species (beech), the reasonable assumption exists that it will likely work for larger datasets that include species with better recognizable annual rings.
Up-to-date there is no published or generally accepted dating method that is fully independent of human bias. According to Cook and Kairiukstis (1990) “the operator will never have relief from his responsibility in synchronization of tree ring series”. The same is true for the method proposed in this study. Any final decision on the assignment of calendar years in the absence of a reference chronology depends mostly on the dendrochronologist, but the proposed method has the potential to be a useful tool increasing the confidence of the operator in his dating decisions.