
. INTRODUCTION
Fault dating by Electron Spin Resonance (ESR) is a method that estimates a time of fault formation or the last movement of the fault using ESR signals of quartz grains contained in fault gouge proposed by Ikeya et al. (1982). This method is based on the premise that the ESR signals (electrons or holes trapped in defects) in quartz grains are reset to zero by frictional heating, cataclastic deformation and/or shearing stress during fault movement (e.g., Ikeya et al., 1982; Fukuchi, 1992; Lee and Schwarcz, 1993, 1994). It is essential to reveal the mechanism of zeroing by fault movements for improving the reliability of this method (Hataya and Tanaka, 1993). However, the relationship between fault movement and resetting the ESR signals upon shearing has not been fully understood (Lee and Schwarcz, 1993, 1994; Yang et al., 2019). Frictional heating might be a possible mechanism described in Fukuchi (1989), however, cataclastic deformation which involves various phenomena: grain boundary frictional sliding, grain fracture and particle rotation, is also possible mechanism. In particular, fracture might be resetting mechanism as first proposed by Ikeya et al. (1982). Therefore, fracture experiments with low frictional heating have to be done to see whether these mechanisms have the effect on zeroing of ESR signals.
The E1’ centre is one of the fundamental and major paramagnetic lattice defects in crystalline quartz, which is an unpaired electron at an oxygen vacancy (Feigl et al., 1974) (≡Si·, where – is paired electrons and · is an un-paired electron, e.g., Ikeya, 1993). Previous experiments showed that ESR intensity of E1’ centre increases (Hataya and Tanaka, 1993) or decreases (Tanaka, 1987; Lee and Schwarcz, 1993; Yang et al., 2019) by shear tests and these indicated that there are several factors affecting the ESR signals during shearing. Tanaka (1987) performed ring shear tests for silica sands with kaolinite under a low normal stress (1.0 MPa) and found that E1’ centre was reset perfectly over the displacement of 1.41 m without dependence on the slip rate (0.094–0.236 m/s). However, Hataya and Tanaka (1993) later confirmed that the zeroing of E1’ centre reported in Tanaka (1987) was caused by the disturbance of broad ESR signals associated with iron powder contamination originated from the stainless steel forcing blocks. The fact suggests that the zeroing of ESR signals does not occur under the conditions as described in Tanaka (1987). Yang et al. (2019) also performed low-speed shear tests for natural quartz sands and showed that ESR intensities of some ESR signals decreased. However, their quartz gouge after the experiment turned into black (Fig. 1 in Yang et al., 2019) and it is likely that gouges include contaminants originated from the titanium alloy forcing blocks affecting ESR measurements as has been seen in Tanaka (1987). On the other hand, from low-speed shear tests Hataya and Tanaka (1993) found that ESR intensity of E1’ centre increased by a shear test with no effect of contaminants from the ceramics forcing blocks.
Fig. 1
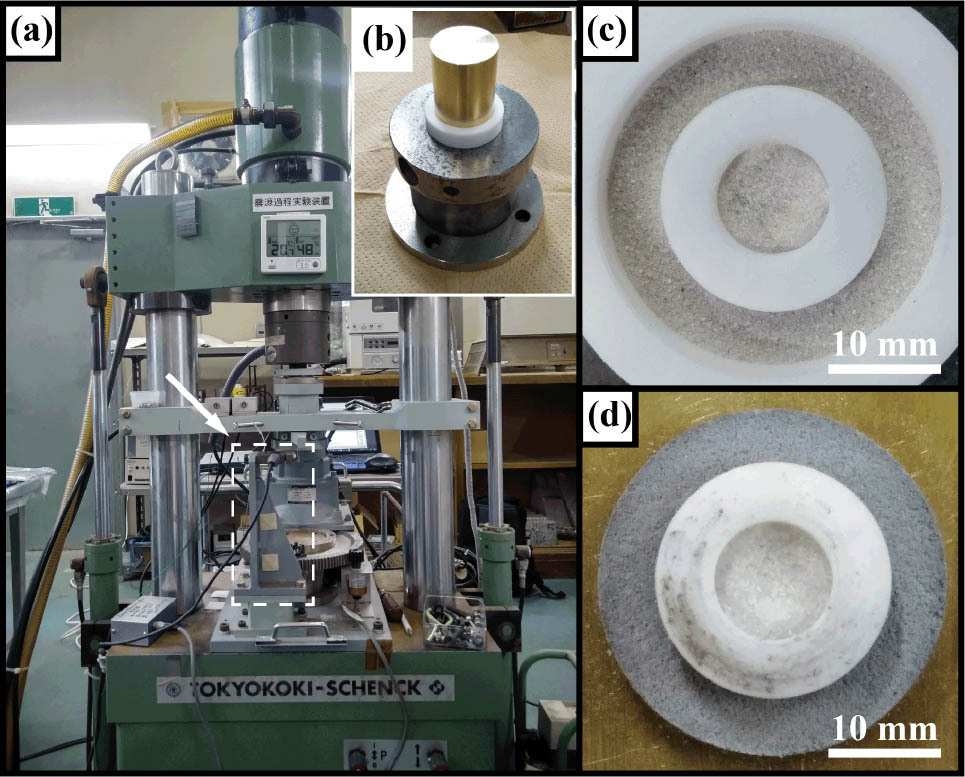
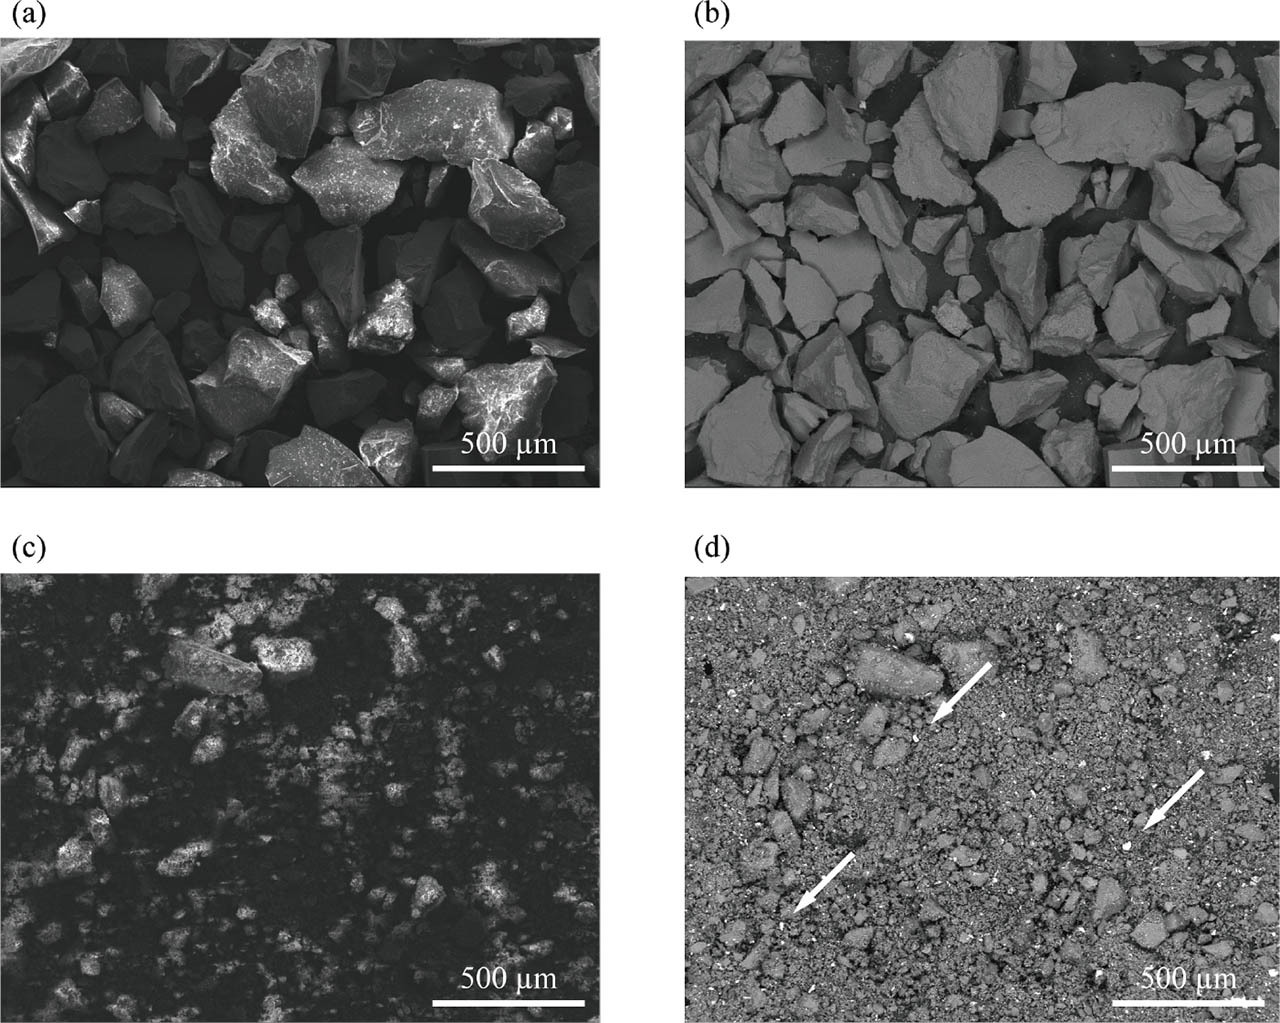
The overall view of a low-velocity rotary shear apparatus and simulated-quartz gouges before and after a shear test. (a) A low-velocity rotary shear apparatus. A white arrow points a torque arm. (b) A part of an assembly to set in the apparatus. (c) Starting and (d) sheared gouges on the surface of the brass forcing blocks. Note the colour change of gouge after a shear test in (d).
The results of Tanaka (1987) and Yang et al. (2019) could be disturbed by contaminants of stainless steel and titanium alloy used in their experiments, respectively. Although the result of Hataya and Tanaka (1993) might not be disturbed by contaminants of ceramics, the relationship between ESR intensity and friction is obscure because they performed a shear test only at a specific condition. Therefore, we performed shear tests for simulated-quartz gouges using a low-velocity rotary shear apparatus with the brass forcing blocks. The experimental conditions are the same as the previous study by Tanaka (1987) and simulate fault movements with different displacements at the shallow depth, avoiding the effect of frictional heating. In addition, the effect of contaminants during shear tests on the ESR measurements were carefully confirmed. From the results of ESR measurements, we evaluate the effect of grain fracture by shearing with low frictional heating on ESR signals and discuss separately from that of frictional heating.
. MATERIALS AND METHODS
Starting material as simulated-quartz gouge
We used quartz sands bought from the Association of Powder Process Industry and Engineering (APPIE), Japan as starting materials for the simulated-quartz gouges. Quartz sands are called JIS test powder1-1 (Lot number. P060425) or Tohoku quartz sand No. 5 in Yamagata, Japan. According to the APPIE instruction, the manufacturing process is that ore mixed clay having strong fire resistance was repeatedly washed and separated with water. Subsequently, collected sands were processed by dry sieving, and then these sands were sieved with milling to fit a standard. The shape and overview colour of this powder are irregular and white, respectively. The grain size is 45–300 μm. The particle density and apparent densities of particles placed loosely and tightly in the containers are 2.6–2.7, 1.503 and 1.612 g/cm3, respectively. The powders consist of 95% SiO2 and 5% trace amount of impurities (Fe2O3, Al2O3, TiO2, MgO and ignition loss) and we regarded the quartz sands as “pure quartz gouges”. We used the quartz sands in all experiments without any processing.
Low-velocity rotary shear test
Low-velocity shear tests were performed for quartz gouges to mimic fault motion at the shallow depth using a low-velocity rotary shear apparatus in the Research Centre for Prediction of Earthquakes and Volcanic Eruptions, Graduate School of Science, Tohoku University (Figs. 1a and 1b). Quartz gouge was placed by sieving between two brass partial hollow cylinders with an inner and outer diameter, 20 mm and 30 mm, respectively (Fig. 1c). The end surfaces of those cylinders were ground with #30 grit SiC powder (carborundum) to inhibit slippage along the interface. Two Teflon sleeves of 20 mm outer diameter and 30 mm inner diameter were attached around the simulated-fault zone to prevent gouge leakage (Fig. 1c). We measured the heights of two cylinders before and after placing quartz gouge to confirm that the thickness of starting gouge is constant (1.4–1.6 mm). After the preparation of a sample assembly, it was set into a shear apparatus, and we measured the thickness change upon the contact of an axial piston just after compression. Then, the shear test was started, and mechanical data was measured using a software package Labview (National Instruments) until experiments end. The normal load and rotational speed of a low-velocity rotary shear apparatus were controlled by hydraulic servo and stepping motor, respectively. Quartz gouges were sheared by the rotation of the lower cylinder with the fixed upper cylinder. The following physical parameters were calculated according to Tanaka (1987). The normal stresses were determined from the total weight of a load cell and normal load by a hydraulic servo. The shear stresses were determined from shear torques calculated from shear loads measured at 0.15 m from the axial centre (Fig. 1a). The slip rates and displacements were calculated at a diameter of 25 mm. We sheared simulated-quartz gouges with various displacements up to 1.4 m at a constant slip rate of 0.76 mm/s under a constant normal stress of 1.0 MPa. Experimental conditions of normal stress and displacement were similar to Tanaka (1987). Shear tests were performed three times in each experimental condition. After a shear test, we also measured the thickness of the sheared gouge. Subsequently, an assembly was opened, and the sheared gouge was divided into halves (Fig. 1d). The half of sample was used for ESR measurement, microstructural observation using a Field Emission Scanning Electron Microscopy (FE-SEM) with Energy Dispersive X-ray Spectrometry (EDS) and the other half was used for powder X-ray Diffraction (XRD) analysis to detect contaminants.
Electron Spin Resonance (ESR) measurement
ESR measurements were performed using a JEOL RE-2X X-band ESR spectrometer in the Department of Chemistry, Graduate School of Science, Tohoku University. Here, to clarify the effects of fracture with increasing fault displacement at the shallow depth, and brass and carborundum contaminants on ESR intensity, we performed the following experiments. To reveal the relationship between ESR intensity and fault displacement, we performed ESR measurements for starting and sheared gouges (Measurement 1). In order to verify the uniformity of quartz sands, we have confirmed the reproducibility of ESR characteristics. In particular, we paid special attention to the characterisation of the starting materials. Therefore, we had created ten different batches of samples and carried out ESR measurements for them. ESR measurements for sheared gouges were conducted for three samples because the shear tests were performed three times in each condition. In order to confirm the effect of contaminants originated from the forcing blocks on ESR intensity, first, ESR measurements were performed for starting gouges with different weights from 180 to 200 mg (quartz only sample). Then, we measured the ESR intensities of starting gouges with various amounts of contaminants, adjusting the total weight of 200 mg. Mixed samples contain brass debris (mixed sample-1) or #320 grit SiC powder carborundum (mixed sample-2). Measurement 2 is the investigation of the effect of brass contaminants on ESR spectra, and Measurement 3 is that of #320 carborundum. Samples were put into quartz tubes, and they were set into an ESR spectrometer. ESR measurements for E1’ centre were conducted under room temperature with a microwave power of 0.01 mW, a sweep width of ±5 mT, a modulation frequency of 100 kHz, a modulation amplitude of 0.079 mT, a sweep time of 60 s, a time constant of 0.1 s and a repetition of 40 times. The instrumental settings of oxygen hole centre (OHC, O3−, e.g., Ikeya, 1993) and peroxy centre (≡Si–O–O·, e.g., Ikeya, 1993) were the same as that of E1’ centre except for a microwave power of 1 mW and a repetition of 10 times. ESR measurements were repeated five times under the same condition for each sample. ESR intensity and g-values were those averages obtained from five ESR spectra.
Powder X-ray Diffraction (XRD) analysis
The XRD measurements were conducted to identify contaminants in the sheared samples for starting and sheared gouges, #320 carborundum and brass powder with a Philips X’pert-MPD PW3050 diffractometer set with CuKα, radiation (λ = 1.5418 nm) in the Department of Earth Science, Graduate School of Science, Tohoku University. The samples were scanned from 25° to 45° with a step size of 0.02° and an acquisition time per step of 2.0 s. XRD peaks in spectra were identified using the ICDD (International Centre for Diffraction Data) database. In addition, the approximate weight of brass debris contained in sheared samples was calculated from the peak area ratio of a maximum peak of brass at 42.2–42.3° to that of quartz at 26.7° using software Origin.
Microstructural Observation and Elemental Analysis on the Field Emission Scanning Electron Microscopy
Microstructures of starting and sheared gouges were observed using an FE-SEM (JEOL JSM 7001F) in the Department of Earth Science, Graduate School of Science, Tohoku University. Element composition analysis was also performed with energy dispersive spectroscopy (EDS) detectors (Oxford, INCA), at 15 kV accelerating voltage and 10 mm working distance.
. RESULTS
Mechanical Data
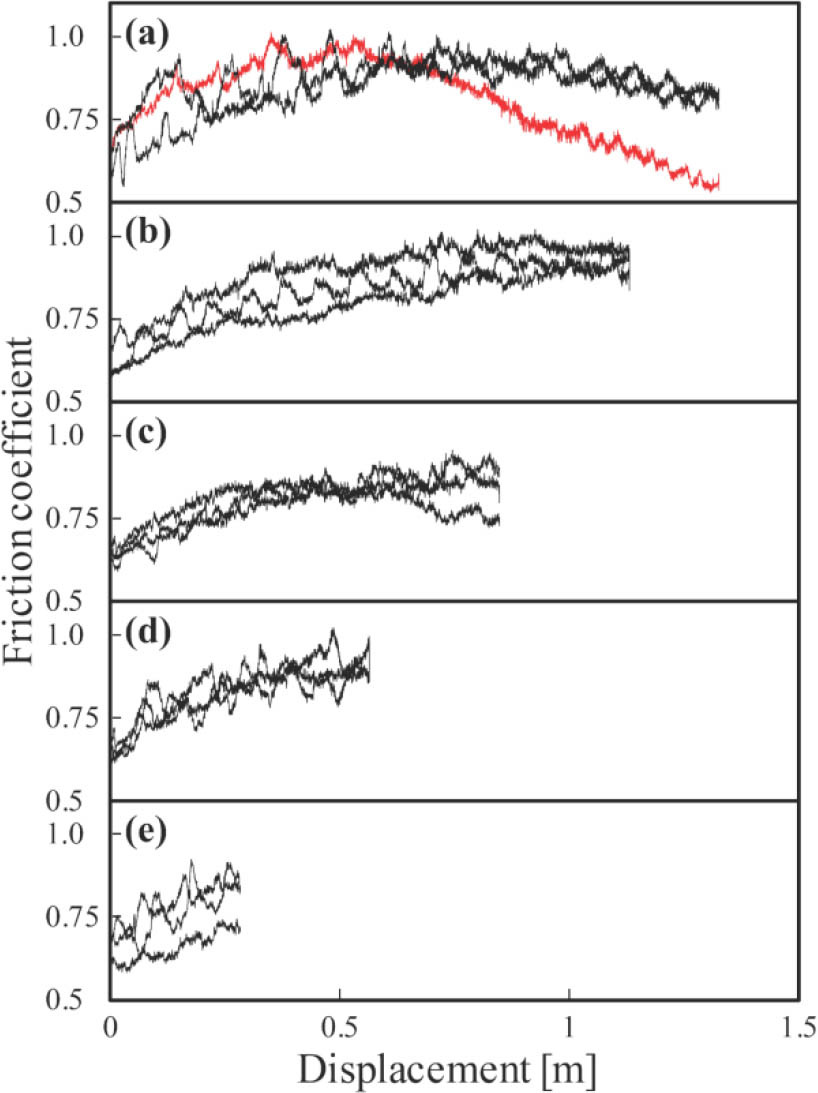
Fig. 2 shows the mechanical behaviour observed during shear experiments conducted at room temperature. Simulated-quartz gouge was sheared up to a displacement of 1.4 m at a constant slip rate of 0.76 mm/s and a constant normal stress of 1.0 MPa. The average frictional coefficient, a ratio of the force of friction between two bodies to the force pressing them together, during shear tests was almost constant about 0.8. The wave periods observed in mechanical data might reflect the time per rotation or the roughness of the sample’s surface.
ESR measurement
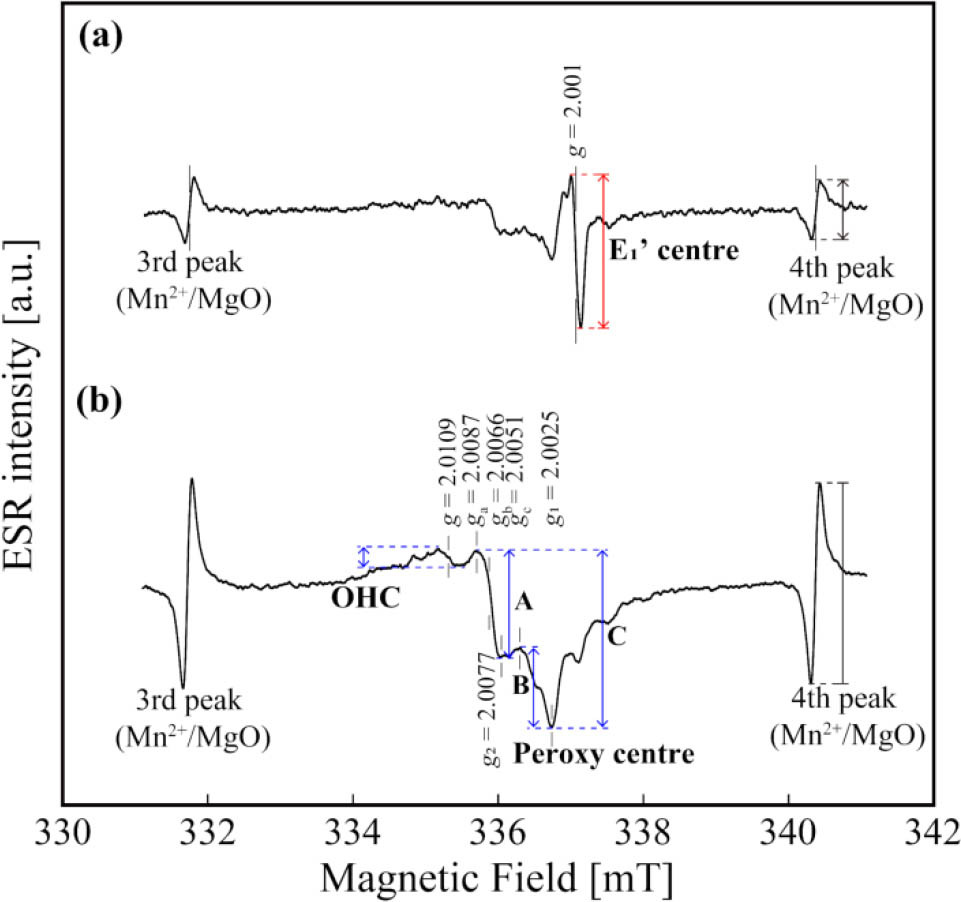
In Measurements 1–3, Each ESR spectrum for samples showed anisotropic peaks at g2 = 2.0006, which corresponds to E1’ centre (g1 = 2.00179, g2 = 2.00053 and g3 = 2.00030, e.g., Ikeya, 1993) (Figs. 3a, S1a, S2 and S3), an isotropic peak at g = 2.0109, which corresponds to OHC (g = 2.011–2.012, e.g., Ikeya, 1993), and anisotropic peaks at g1 = 2.0025 and g2 = 2.0077, which corresponds to peroxy centre with (g1 = 2.0014 and g2 = 2.0074, e.g., Ikeya, 1993) (Figs. 3b, S1b, S2 and S3). For peroxy centre, we defined peroxy centre-A and B according to Tsukamoto et al. (2017) and peroxy centre-C referring to Timar-Gabor (2018) by the peak positions of peroxy centre. Moreover, g factors with ga = 2.0087, gb = 2.0066 and gc = 2.0051 were defined, and ESR intensities of peroxy centres were calculated using ESR intensities at those g factors. ESR intensities of E1’ centre, OHC, peroxy centre-A, -B and -C were shown in Fig. 3 and normalised by the 4th peak of standard material, Mn marker (Mn2+/MgO). In Measurement 1, we carried out ESR measurements for ten batches of starting gouge and defined the ESR intensity as the intermediate value between maximum and minimum values in 10 batches. ESR intensities of sheared gouges were normalised by that of the starting gouge. Error bars of starting and sheared gouges were defined the range of ESR intensities for ten batches of starting gouge, and three sheared gouges, respectively. In Measurements 2-3, error bars of samples were defined the range of ESR intensities for ten batches of starting gouge.
Fig. 3
Representative ESR spectra of E1’ centre, peroxy centre (-A, B and C), OHC and Mn2+/MgO marker. ESR spectra (a) at room temperature and a microwave power of 0.01 mW (b) at room temperature and a microwave power of 1 mW.
ESR intensity of E1’ centre increased with displacements and reached about 120% at a displacement of 1.4 m. That of OHC kept constant with increasing displacement. Those of peroxy centre-A, B and C kept constant, increased by about 30%, increased slightly by about 10% at the maximum displacement, respectively (Fig. 4). In Measurement 2, ESR spectra for quartz only sample and mixed sample-1 showed the same peaks: E1’ centre, OHC and peroxy centre (see supplementary Fig. S2). Intensities for those ESR signals in mixed sample-1 were nearly the same as those in the quartz only sample (Fig. 5). In Measurement 3, ESR spectra for quartz only sample and mixed sample-2 showed the same peaks: E1’ centre, OHC and peroxy centre (see supplementary Fig. S3). Intensities for E1’ centre, OHC and peroxy centre-A in mixed sample-2 were the nearly same as those in the quartz only sample (Fig. 6). On the other hand, those for peroxy centre-B and C in mixed sample-2 were not the same as those in the quartz only sample. Those intensities increased with a weight percentage of carborundum and reached about 300 and 150%, respectively.
Fig. 4
The ESR intensities of (a) E1’ centre, (b) OHC, (c) peroxy centre-A (triangle), B (square) and C (pentagon) versus displacement. Red solid and dot lines indicate a linear approximation curve and a saturation curve calculated by least squares method, respectively. Blue solid lines indicate linear approximation curves calculated by least squares method.
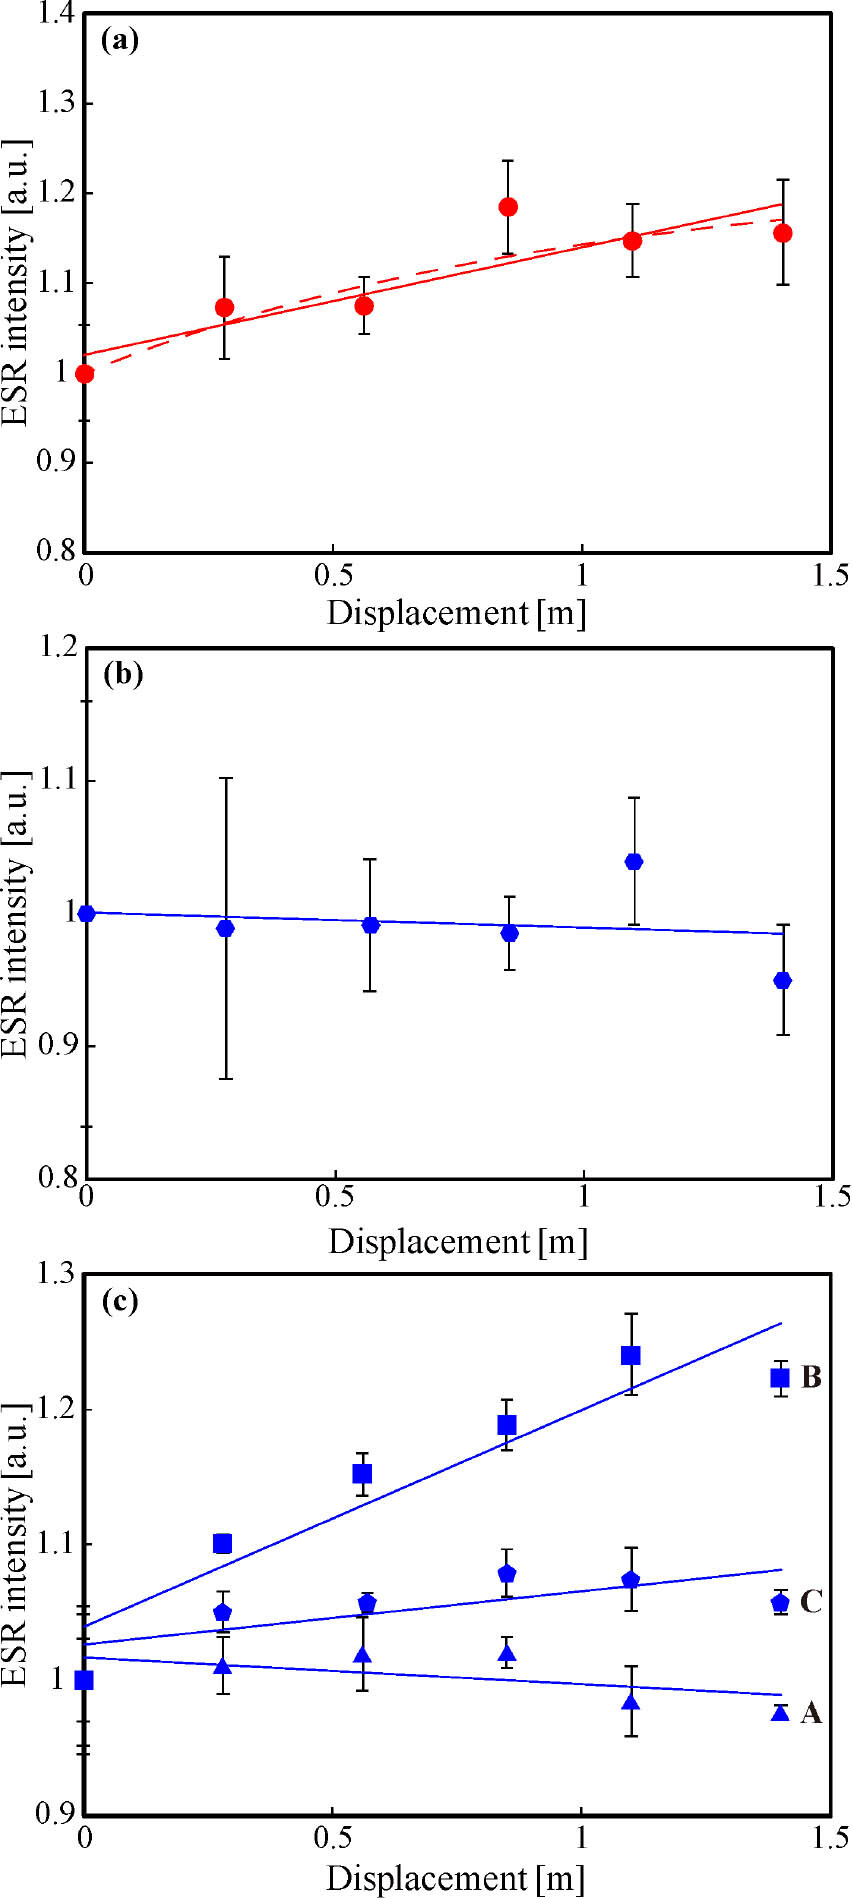
Fig. 5
The ESR intensities of (a) E1’ centre, (b) OHC, (c) peroxy centre-A, (d) B and (e) C versus the weights of starting gouge of quartz only sample and mixed sample-1 and the weight percentage of brass of mixed sample-1. The error value reflected the measured error of ESR intensity of 10 batches of starting gouge. Black symbols mean the values of quartz only sample and red symbols mean the values of mixed sample-1. Solid lines indicate linear approximation curves calculated by least squares method. Dashed lines indicate the weight dependency of ESR intensity based on the results in Fig. S4.
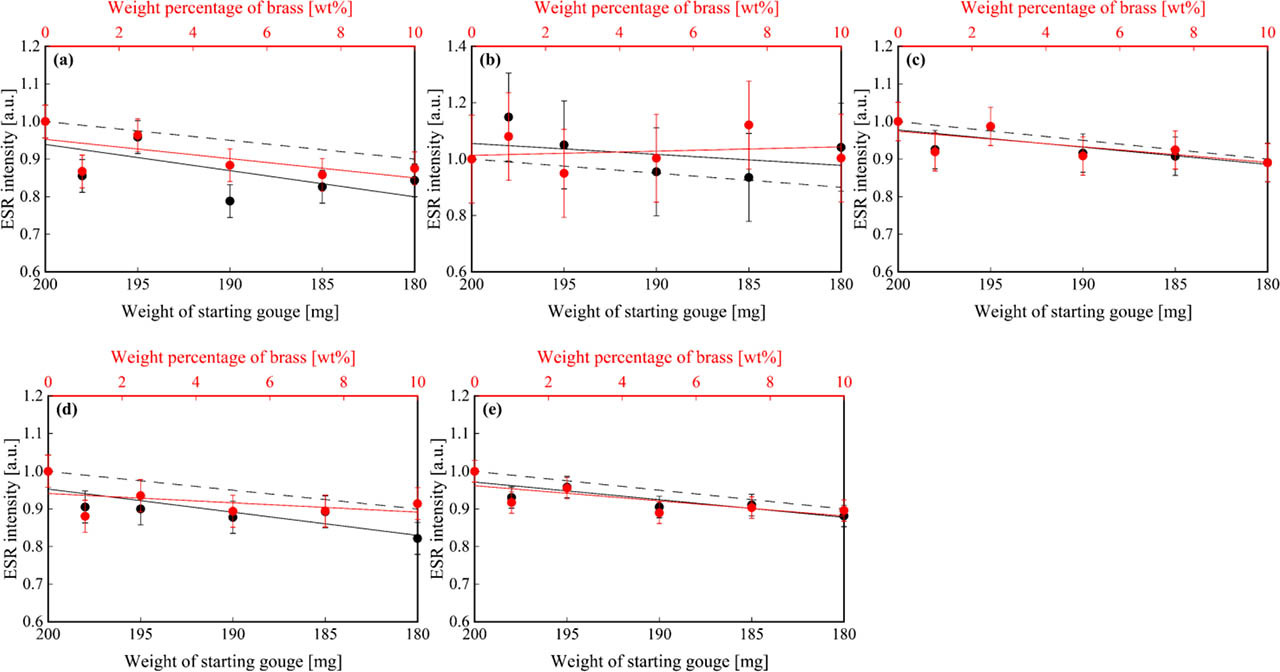
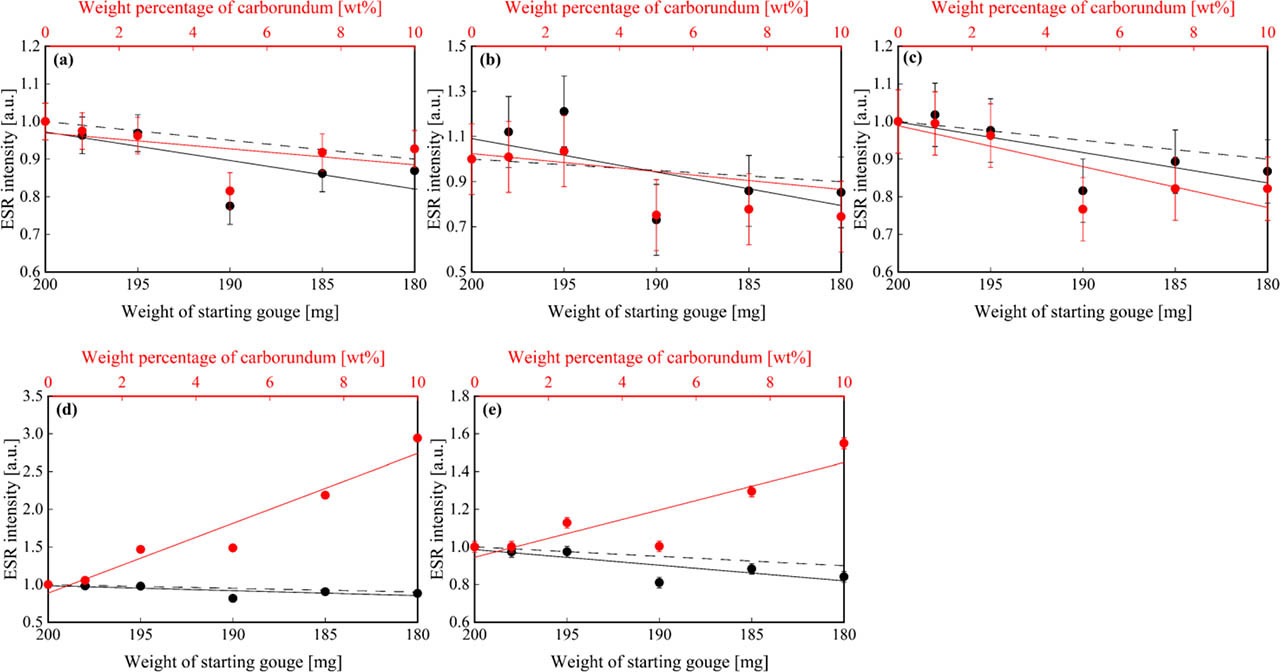
Fig. 6
The ESR intensities of (a) E1’ centre, (b) OHC, (c) peroxy centre-A, (d) B and (e) C versus the weights of starting gouge of quartz only sample and mixed sample-2 and the weight percentage of carborundum of mixed sample-2. The error bars represent the measured error of ESR intensity of 10 batches of starting gouge. Black symbols mean the values of quartz only sample and red symbols mean the values of mixed sample-2. Solid lines indicate linear approximation curves calculated by least squares method. Dashed lines indicate the weight dependency of ESR intensity based on the results in Fig. S4.
Powder X-ray diffraction (XRD) measurement
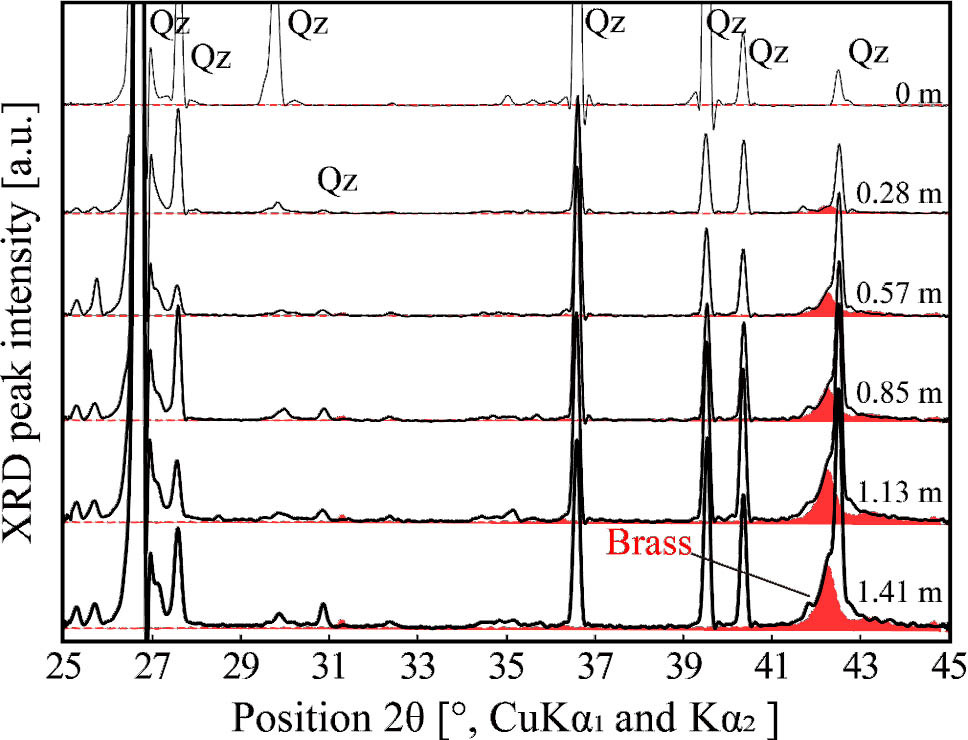
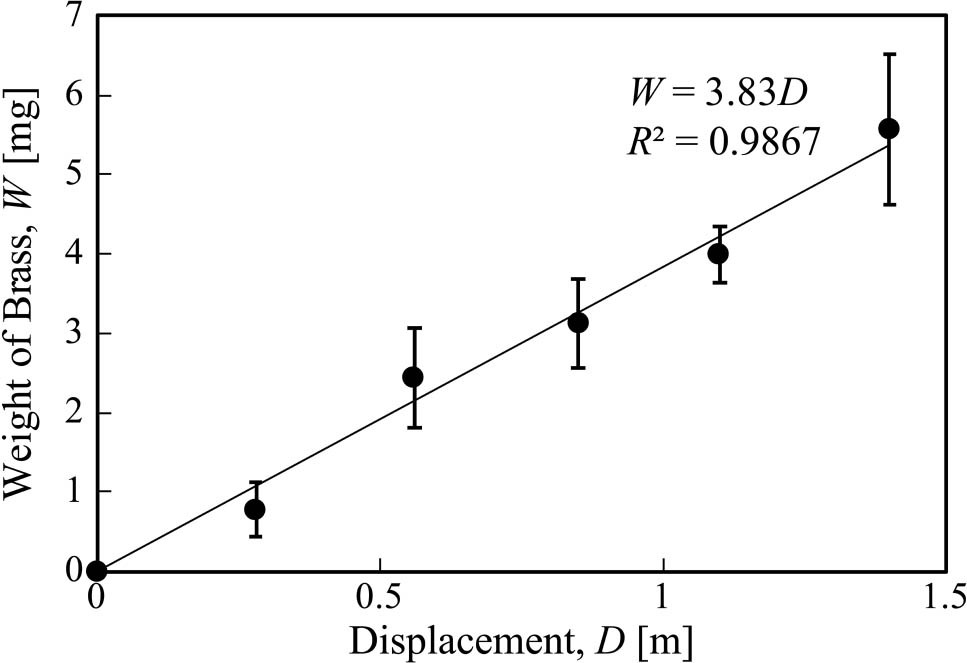
The powder XRD analysis shows that sheared gouge contains brass debris (Fig. 7). An XRD peak of brass at 42.2–42.3° increases with the increasing displacement. The weight percentage of brass debris was calculated from the peak area ratio of brass debris to quartz in sheared gouges. It increased linearly with displacement (Fig. 8).
. DISCUSSIONS
The factor of ESR intensity change by shearing
ESR intensity of E1’ centre in simulated-quartz gouge (φ = 45 – 300 μm) changed with increasing displacement by low-velocity shear tests, while those of OHC and peroxy centre (-A) did not change (Section 3 – ESR measurement). Especially, E1’ centre increased with increasing displacement. From SEM observations (Fig. 9), a mode of deformation of shear gouges is likely to be a fracture in all shear tests. Hence, fracture can be a dominant contribution to the change in the ESR intensity for E1’ centre. It is also possible that frictional heating and colour change (blackening) of starting materials (Fig. 1d) also contribute to the change.
For frictional heating during shear tests, the temperature rise was estimated (Archard, 1959; Sibson, 1975). Because shear tests were performed at a normal stress of 1.0 MPa, a slip rate of 0.76 mm/s and displacements up to 1.4 m, the maximum temperature rise considering the local temperature rise between gouge particles was estimated to be about 14°C, where a frictional coefficient is 0.90, a slip velocity is 0.76 mm/s, a contact radius is 10 μm, a contact indentation strength is 10.9 GPa and a thermal conductivity is 4.3 W/mK (Table 1, Rempel and Weaver, 2008). Additionally, Yang et al. (2019) performed a shear test at a normal stress of 0.5 MPa, equivalent slip rate defined by Shimamoto and Tsutsumi (1994) of 2 mm/s and shear time of 1000 s, which were similar conditions to our study. The maximum temperature rise measured using a thermocouple reached less than 30°C. Therefore, the effect of frictional heating under our experimental conditions can be negligible for the ESR intensity change.
In our shear tests, we confirmed the blackening of starting gouge. The blackening was likely to occur due to brass contaminants mixed from the forcing blocks during shear tests (Figs. 1 and 9) and progressed with increasing displacement by increasing the amount of brass contaminants (Figs. 7 and 8). Hence, the brass contaminants might cause a change in ESR intensities (Fig. 4). In order to investigate the effect of increasing brass contaminants on ESR intensity, we conducted Measurement 2. ESR intensities of E1’ centre, OHC and peroxy centre (-A, -B and -C) decreased with the increasing the weight percentage of brass as well as the decreasing the weight of starting gouge (Fig. 5). There is a proportional relationship between the weight of starting gouge and ESR intensities of those ESR signals (see supplementary Fig. S4), and the relationship is shown by dashed lines in Fig. 5. Intensities for those ESR signals in quartz only sample and mixed sample-1 do not greatly deviate from the weight dependency of ESR intensity. This indicates that decreasing those intensities of mixed sample-1 can be represented by the weight dependency of the gouge. Hence, the effect of brass contaminants on their ESR intensities in sheared gouges is negligible.
In addition, we used #30 carborundum during the preparation for rough surfaces of the forcing blocks. After the polishing, we observed the surfaces using an optical microscope, and the small amount of carborundum remained in the grooves of the surfaces. Therefore, although we could not find carborundum in sheared gouges by XRD analysis or SEM observations, the ESR intensity change is also possible due to carborundum. From the results of Measurement 3, ESR intensities of E1’ centre, OHC and peroxy-A decreased with the decreasing weight of starting gouge and the increasing weight percentage of contaminants. Intensities for those ESR signals in quartz only sample and mixed sample-2 do not greatly deviate from the weight dependency of ESR intensity (Figs. 6a, 6b and 6c). This indicates that the decreasing those intensities in the mixed sample-2 can also depend on the weight dependency of the gouge. On the other hand, ESR intensities of peroxy-B and -C in quartz only sample decreased, and those intensities in mixed sample-2 increased with the increasing weight percentage of contaminants as well as the decreasing weight of gouge. Intensities for those ESR signals in mixed sample-2 deviated from the weight dependency of gouge (Figs. 6d and 6e). This indicates that the increasing those intensities in the mixed sample-2 can also depend on the weight dependency of the carborundum. Hence, carborundum contaminants can affect the increase of their ESR intensity by shear tests. Fig. S5 shows that the ESR spectrum obtained by subtracting that of starting gouge from that of starting gouge with carborundum. The symmetric signal, which was likely to be that of carborundum, was detected in the spectrum. It overlies a part of peroxy centre (-B and -C), while it does not overlie the other part of peroxy centre (-A). Hence, the residual ESR spectrum also supports that the increase in the ESR intensities of peroxy centre-B and -C by shear tests can be caused by carborundum contaminants. ESR intensity of peroxy centre-A is reflected on that of peroxy centre, therefore, we consider that the effect of carborundum contaminants on ESR intensities of E1’ centre, OHC and peroxy centre (-A) is also negligible.
Tanaka (1987) and Yang et al. (2019) showed that the ESR intensity of E1’ centre decreased with increasing displacement, while this study showed that the intensity increased with increasing displacement. As described above, the difference can be caused by the contaminants originated from the forcing blocks. Here, we discuss the mechanism of decreasing ESR intensity by the contaminants in more detail.
The sensitivity of ESR measurements decreases by microwave loss. Microwave loss in ESR measurements is dominant by electric conductivity, dielectric loss, magnetic loss because ESR measurements are performed at a constant frequency and intensities of electric and magnetic fields of the microwave. When the target sample contains materials with high microwave loss, the sensitivity of the ESR spectra of the sample decreases. Therefore, the intensity of ESR signals of target signals (to that of Mn marker) is likely to decrease with increasing the weight of materials with high microwave loss. Tanaka (1987), Yang et al. (2019) and this study conducted shear tests using the stainless steel, titanium alloy and brass forcing blocks, respectively. The contaminants originated from the forcing blocks were likely to be mixed with gouges during shear tests (Section 1). The stainless steel used in Tanaka (1987) is mainly made of iron, hence, sheared gouges were likely to contain the contaminant of iron mainly. Because iron is ferromagnetic materials with high magnetic loss and high electric conductivity, it can cause a decrease of the ESR intensity in Tanaka (1987). Okazaki (2002) and Komotori et al. (2007) reported the formation of passive film (ferroelectric titanium oxide) during low-speed friction for titanium alloy. Similar titanium oxide passive film may be produced, and the wear can be contained in gouge samples after shear tests in Yang et al. (2019). Hence, the contaminant contains the ferroelectric titanium oxide with dielectric loss and electric conductivity affecting the ESR intensity in Yang et al. (2019). The brass used in this study is mainly made of copper and zinc, hence, sheared gouges contain them mainly. The electric conductivity of the contaminants originated from brass is as large as those of iron and titanium oxide to affect the ESR measurements. However, our results of Measurement 2 (Fig. 5) indicated that the effect of the contaminants originated from the brass forcing blocks was negligible if the amount of contaminants was low (e.g., about less than 10 wt%). This is because its magnetic and dielectric losses are much lower than them. We can also consider that there is no effect of contaminants in this study due to the lowest amount of brass wear in the three metals (stainless steel, titanium alloy and brass) because the microwave loss depends on the amount of contaminants. However, the brass is the lowest hardness among them, and its wear is most likely to be generated. Hence, the amount of wear is irrelevant to the reason why the effect of brass is negligible.
Relationship between ESR intensity of E1’ centre and fracture
Previous shear tests by Tanaka (1987), Hataya and Tanaka (1993) and Yang et al. (2019) were conducted under the nearly same conditions as those of our study were conducted. Tanaka (1987) and Hataya and Tanaka (1993) used quartz sands in the size range of φ = 420–840 μm and φ = 75–250 μm, respectively. Yang et al. (2019) used natural quartz sands bought from a company and crushed using a ball mill (φ = 90–250 μm) as starting gouges. Although Tanaka (1987) shows decreasing ESR intensity with increasing displacement (Fig. 10), the result seems to be disturbed by stainless debris mixed from the forcing blocks as described in Hataya and Tanaka (1993). Hataya and Tanaka (1993) also show that ESR intensity increases by a shear test with a displacement of 1.7 m (Fig. 10) without being influenced by contaminants. However, they conducted a shear test only at a specific condition. Moreover, the maximum temperature rise, considering the local temperature rise between gouge particles, was estimated to be about 430°C (Archard, 1959), where a frictional coefficient is 0.65, a slip velocity is 2.83 × 10⁻² m/s, a contact radius is 10 μm, a contact indentation strength is 10.9 GPa and a thermal conductivity is 4.3 W/mK (Table 1, Rempel and Weaver, 2008). This indicates that the heating can affect the change in ESR intensity. Yang et al. (2019) show decreasing ESR intensity with increasing displacement using a rotary shear apparatus (Fig. 10), but they did not investigate the effect of contaminants. A photo of a sheared sample in Fig. 1 of Yang et al. (2019) shows that the blackening progresses with increasing displacement implying that contaminants of titanium alloy may increase with increasing displacement. However, they performed ESR measurements without any processing to remove contaminants. Therefore, the result of Yang et al. (2019) is likely to be affected by contaminants as described in Hataya and Tanaka (1993).
Fig. 10
The relationship between ESR intensity of E1’ centre and displacement is shown in various studies including our study. Red circles and blue squares are this study and Hataya and Tanaka (1993), respectively. On the other hand, blue open triangles and diamonds are Tanaka (1987) and Yang et al. (2019), respectively. Red solid and dot lines indicate linear approximation curves and saturation curve calculated by least squares method, respectively.
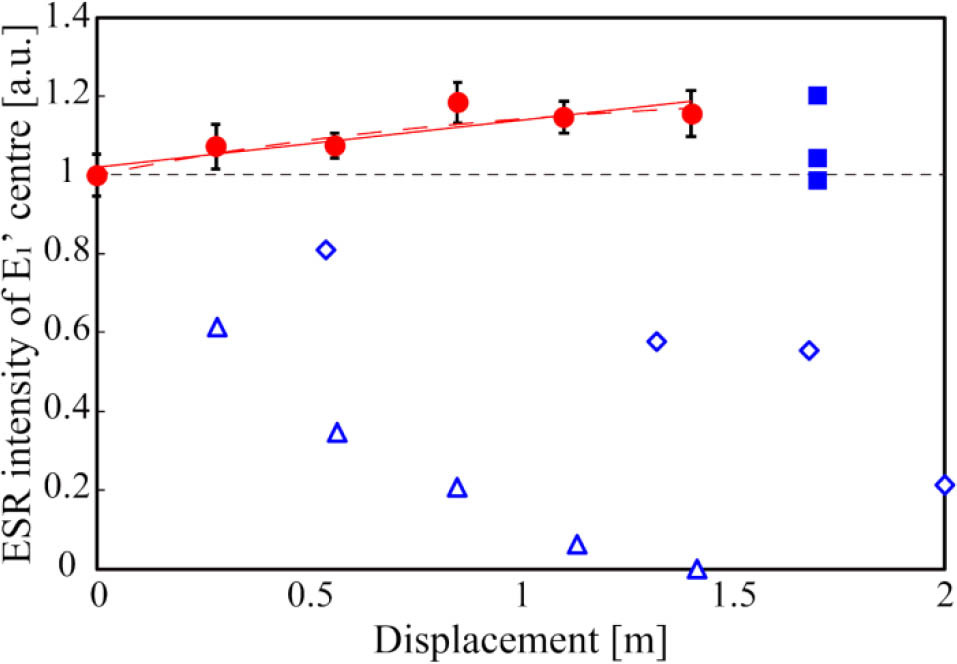
We performed low-velocity shear tests for simulated-quartz gouges, and the results show the relationship between ESR intensity for E1’ centre and displacement following a linear straight line or a saturating exponential curve (Fig. 10). The effects of frictional heating and contaminants on ESR intensity for E1’ centre are negligible, and E1’ centre is presumed to increase by fracture dominant over frictional heating at grain boundary as discussed above and in Section 4 – The factor of ESR intensity change by shearing. It is known that E1’ centre created on the surface of quartz grains by crushing increased with decreasing the grain diameters (e.g. Arends et al., 1963; Fukuchi, 1992; Hasegawa et al., 1995). Their result is consistent with our results on that grain size of quartz gouge reduced, and E1’ centre increased during shear tests (Figs. 4a and 9). Therefore, E1’ centres were produced on the new surfaces formed by fracture (not frictional heating). According to Takeuchi et al., (2006), disordered layers were produced by mechanical damage which means brittle fracture and plastic deformation at crack tips with stress concentration. Hence, E1’ centre is presumed to be produced in the surface disordered layers during mechanical damage by shearing with low frictional heating.
If the E1’ centre is produced on the newly formed surfaces, there should be a strong correlation between ESR intensity for E1’ centre and grain size reduction. Coop et al. (2004) conducted ring shear tests to investigate the development of particle breakage with shear strain for carbonate sands. They found that the soil was broken significant at small displacement and reached a stable grading at which the particle contact stresses would not be sufficient to cause further breakage even at very large displacements. Although this is the case for the carbonate sands, a similar behaviour is likely to occur for quartz sands because this phenomenon has already been observed in the grinding tests for quartz sands (Hasegawa et al., 1995). From these previous studies, we can consider that the mechanism of the relationship between ESR intensity for E1’ centre and displacement as below. If the simulated-quartz gouge is sheared at the stage where the grain size reduction continues, the relationship may follow linear straight line. On the other hand, if the gouge reaches at stable grading, the relationship may follow a saturating exponential curve. According to Coop et al. (2004), the final grading is dependent on both the applied normal stress and the initial grading. In order to reveal the increase in the E1’ centres by fracture with increasing displacement in more detail, we have to perform further shear tests and measure grain size or specific surface area using BET method for the simulated-gouges.
. CONCLUSION
We performed low-velocity shear tests mimicking fault motions at the shallow depth for simulated-quartz gouges and clarify the following:
1) The change in ESR intensity during shear tests were not disturbed by either brass nor carborundum contaminants originated from the forcing blocks.
2) ESR intensity of E1’ centre increased and OHC and peroxy centre kept constant by fracture with the increasing displacement. From comparison with previous studies, we revealed the relationship between ESR intensity for E1’ centre and fracture with various displacements separately from contaminants and frictional heating.
SUPPLEMENTARY MATERIAL
Supplementary material, containing additional figures S1–S5 is available online at http://dx.doi.org/10.2478/geochr-2020-0035.