
. INTRODUCTION
The E1′ centre is one of the best characterized para-magnetic lattice defects in crystalline quartz, which is an unpaired electron at an oxygen vacancy. The currently accepted model of E1′ centre is an unpaired electron at a single silicon sp3 orbital oriented along a bond direction into the vacancy where the silicon relaxes toward the vacancy, while the other silicon on the opposite side with a positive charge relaxes away from the basal plane of its three oxygen neighbours (Rudra and Fowler, 1987). Previous studies suggested that the E1′ centre is not suitable for electron spin resonance (ESR) dating and dosimetry (Zhao et al., 1991; Jin et al., 1991, 1993; Falgueres et al., 1994; Toyoda and Hattori, 2000; Toyoda et al., 2005). However, more recent studies indicated that the ESR signal intensity of heat-treated E1’ centre, after gamma-ray irradiation to 2.5 kGy followed by heating at 300°C for 15 min, was correlated to the age of quartz (Ono et al., 1998; Toyoda and Hattori, 2000; Toyoda and Naruse, 2002; Sun et al., 2007). Thus, on the basis of the correlation between the quartz ESR intensity and its source rock age, the heat-treated E1′ centre could be used to trace sediment provenance (Attanasio et al., 2000; Nagashima et al., 2007, 2011; Sun et al., 2008, 2013; Toyoda, 2011; Yamamoto et al., 2013; Shimada et al., 2013, 2016; Tissoux et al., 2015; Toyoda et al., 2016, Satio et al., 2017). Previous studies have mainly focused on the heat-treated E1′ centre of aeolian sediment, while studies on fluvial and lacustrine sediments are limited. It is still not clear whether the heat-treated E1′ centre is useful for fluvial-lacustrine sediment provenance because of the doubt that the quartz signal intensity in such sediments might have been modified at the time of weathering, therefore not corresponding to that of source rock. In this study, the heating effect on E1′ centre of quartz extracted from fluvial sediments and their source rocks is studied to examine the relationships. The potential use of the heat-treated E1′ centre of quartz in the fluvial sediment provenance tracing is also discussed.
. SAMPLING AND METHOD
Geological settings
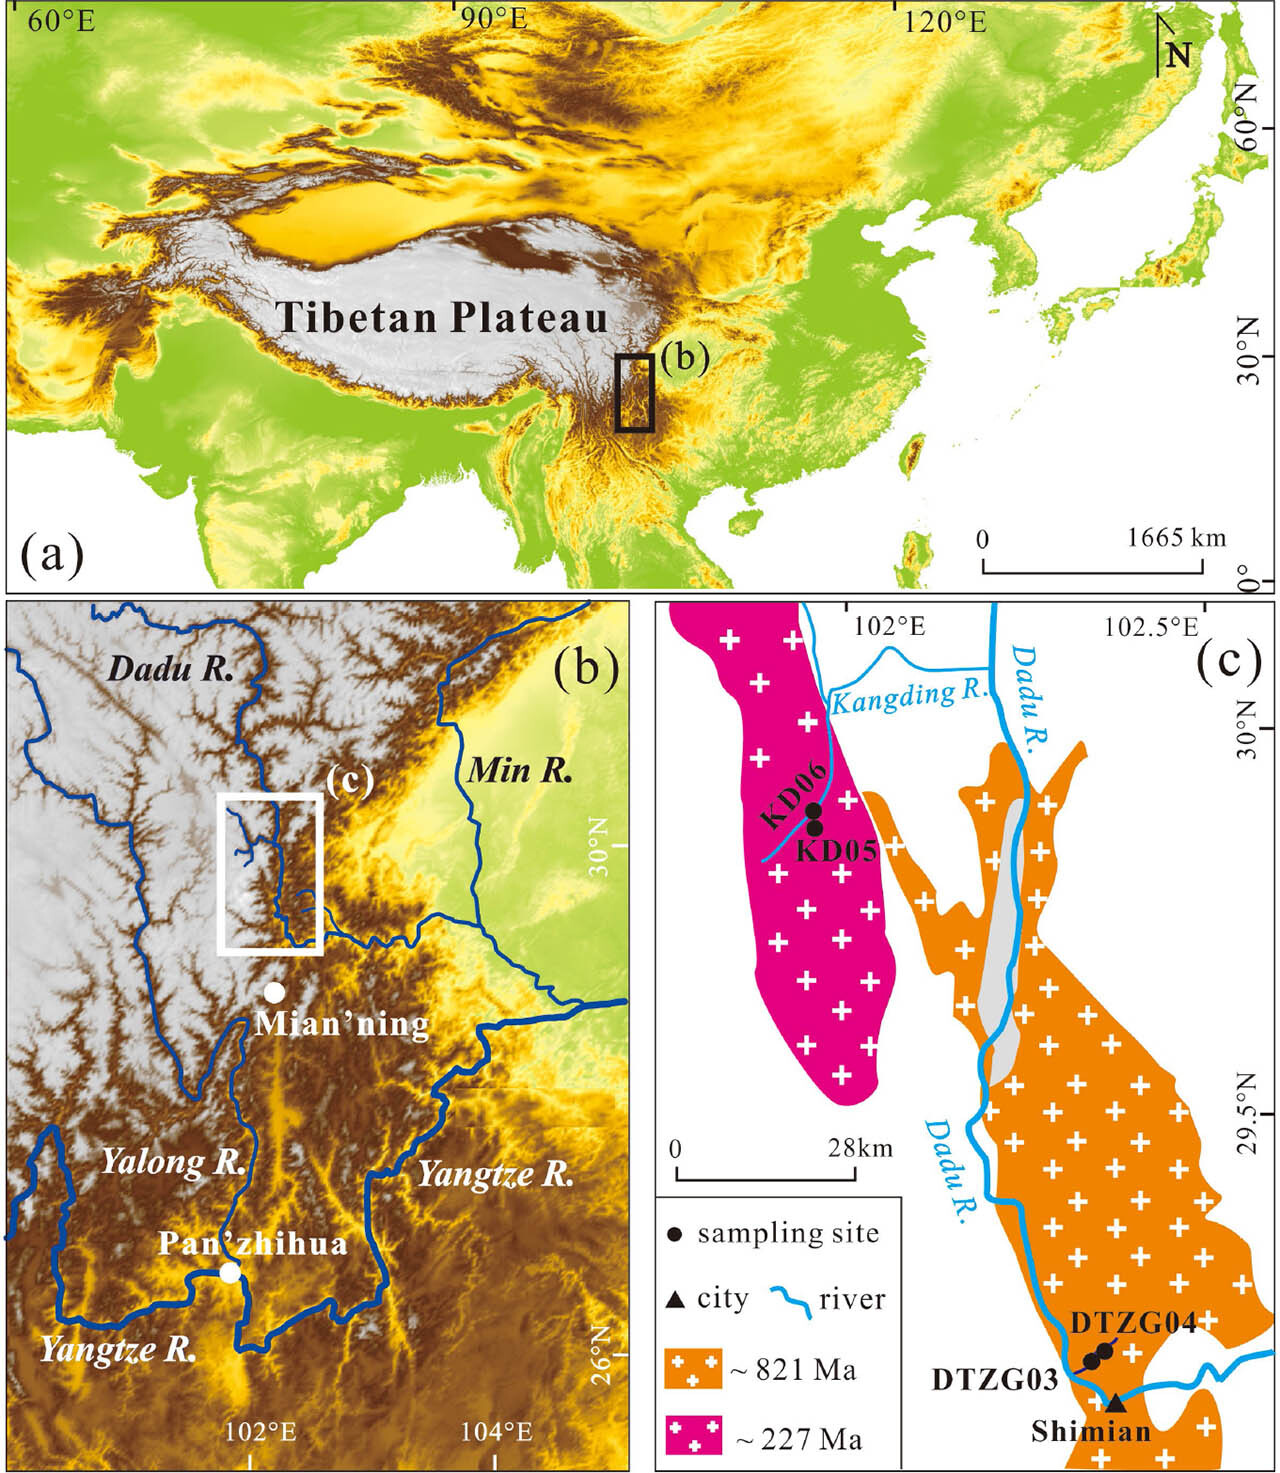
The study area located on the south-eastern Tibetan Plateau with high erosion and deposition rate is particularly suitable for studies designed towards a better understanding modern source to sink transport process (Wei et al., 2017). Sampling sites consist of four small river drainages, Mian’ning River, Kang’ding River, Pan’zhihua River, Diao’tengzi River, as shown in Fig. 1. Each drainage is dominated by single granitic source rocks, and source rocks are S type granites. The ages of the source rocks of Mian’ning River, Kang’ding River, Pan’zhihua River and Diao’tengzi River are 134 Ma, 227 Ma, 783 Ma and 821 Ma, respectively (data derived from China Intrusive Rock Isotope Age Atlas by K-Ar dating method, Ma and Zhou, 2002).
Fig. 1
Map showing study area and geological setting of sampling sites. (a) and (b) show study area located in the eastern Tibetan Plateau. (c) show geological setting and sampling site of Kang’ding River and Diao’tengzi River. The Pan’zhihua River and the Mian’ning River are marked as two black circles on 1–(b). The source rock age data are from China Intrusive Rock Isotope Age Atlas by K-Ar dating method.
Sampling
Previous studies showed that the source rock age could make a significant effect on the signal intensity of the heat-treated E1′ centre in quartz (Toyoda and Hattori, 2000; Toyoda and Naruse, 2002). To better understand the heating effect on diverse quartz of known origins, we collected four surface fluvial sediments, three source rocks and one late Holocene sediment from the four different small river systems draining on the SE Tibetan Plateau. All modern samples were taken from river banks, and sampling depth is from the surface to 1 cm down; the historical sample was taken from a short core down to 0.8 m deep, far away from river surface; source rock samples were directly collected from granites out-crops with a prospecting hammer. More sample details can be found in Table 1. In addition, in order to examine the quartz thermal activation diversity, two granitic samples are collected from different river drainage (Pan’zhihua River and Diao’tengzi River) with different formation ages for the heating effect experiments.
Table 1
Sample information used in this study.
[i] All samples were collected within the river drainage of single granitic lithology. Rock age: formation age of quartz-containing rock, kb is K-Ar dating of biotite, uz is U-Pb dating of zircon, kw is K-Ar dating of whole rock. The quartz origin ages are compiled from the Geological Map of the Isotope Dating of Intrusive Rocks in China (Ma and Zhou, 2002).
Quartz separation
The 100 ~ 200 μm size fraction of eight samples were separated by wet sieving method, as suggested by Liu et al. (2015), in the State Key Laboratory of Earthquake Dynamics, Institute of Geology, China Earthquake Administration (IGCEA), Beijing. The sample pretreatment protocol employed was as described by Liu et al. (2010). Each sample was treated with 30% H2O2 for 24 hours to remove organic material and then washed and cleaned with distilled water. These samples were treated with 10% HCl for 24 hours to remove carbonates and then washed and cleaned with distilled water. Heavy minerals were removed by heavy liquid. Magnetic minerals were removed by mechanical, magnetic selection. The remaining part was etched by 40% HF for 40 minutes to remove feldspars and rinsed with distilled water to neutralize the acid, and then dried at low temperature. After that, the XRD examination was performed to show the quartz content of the samples around 97.19 ~ 99.9%. In order to eliminate the error caused by single aliquot data, each pure quartz sample was divided into two sub-samples, which were then divided into aliquots for later irradiation, heating experiment and ESR measurements.
Gamma-ray dose irradiation
Aliquots of all samples were irradiated with 2.5 kGy by the Gamma-ray dose irradiation (Toyoda et al., 2016), using the 60Co facility at Peking University, with a dose rate of 42.25 Gy/min.
Heating experiment
Different aliquots of irradiated quartz were prepared for different heating temperature treatments, including 0, 50, 115, 165, 210, 255, 275, 290, 300, 310, 330, 350, 400, 500, 600, and 700°C, respectively. Each aliquot was heated for 15 minutes in order to convert the oxygen vacancies into E1′ centre of quartz (Toyoda and Hattori, 2000). The designated temperatures were first reached in the muffle furnace, and then the samples were quickly put into it for heating 15 minutes. The heating experiment was carried out at the 14C dating laboratory at State Key Laboratory of Earthquake Dynamics, Institution of Geology, China Earthquake Administration (IGCEA), Beijing.
ESR signal intensity measurements
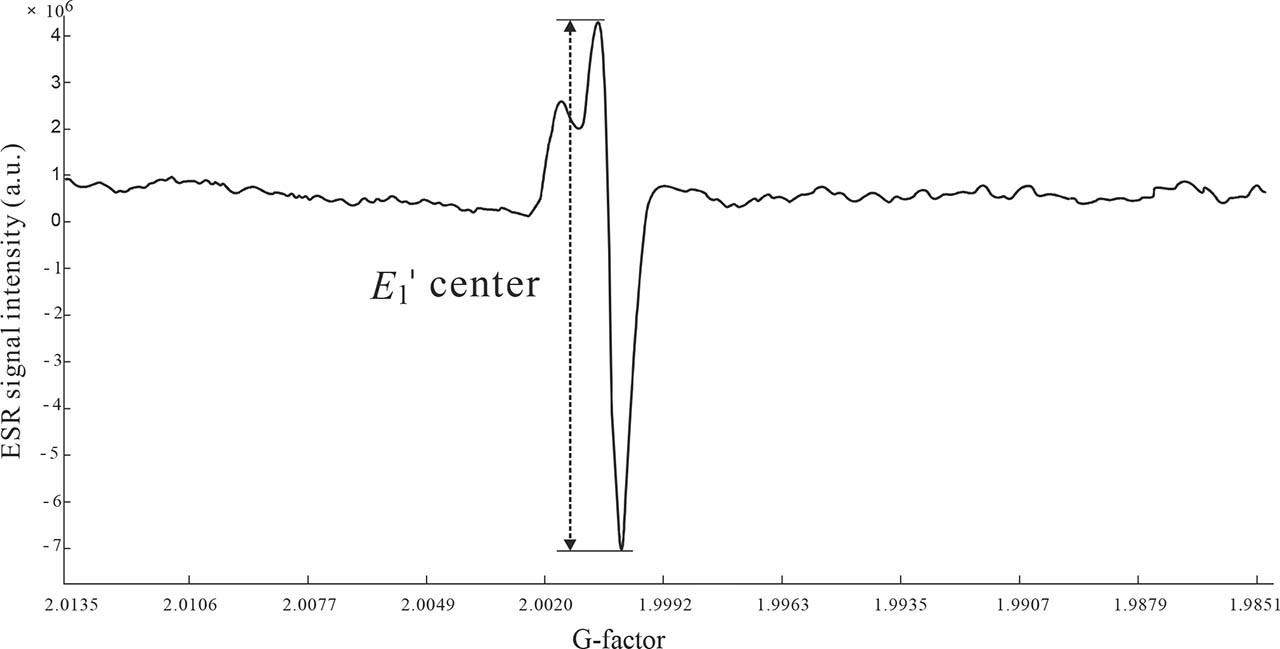
The ESR signal intensity of the heat-treated E1′ centre in quartz was measured with a Bruker EMX spectrometer at State Key Laboratory of Earthquake Dynamics, Institution of Geology, China Earthquake Administration. The measurements were performed at room temperature with a microwave power of 0.01 mW, modulation frequency of 100 kHz and modulation amplitude of 1.00 G, seen in Fig. 2 (Toyoda and Hattori, 2000; Toyoda et al., 2000). Each aliquot was measured three times to estimate the angular dependence after rotating by 120°. The quartz heat-treated E1’ centre magnitude was calculated as the average value of the aliquots signal intensities provided by the two sub-samples. The ESR signal intensities of all samples were normalized by sample weight.
. RESULTS AND DISCUSSIONS
Heating effect on maximum quartz heat-treated E1′ centre
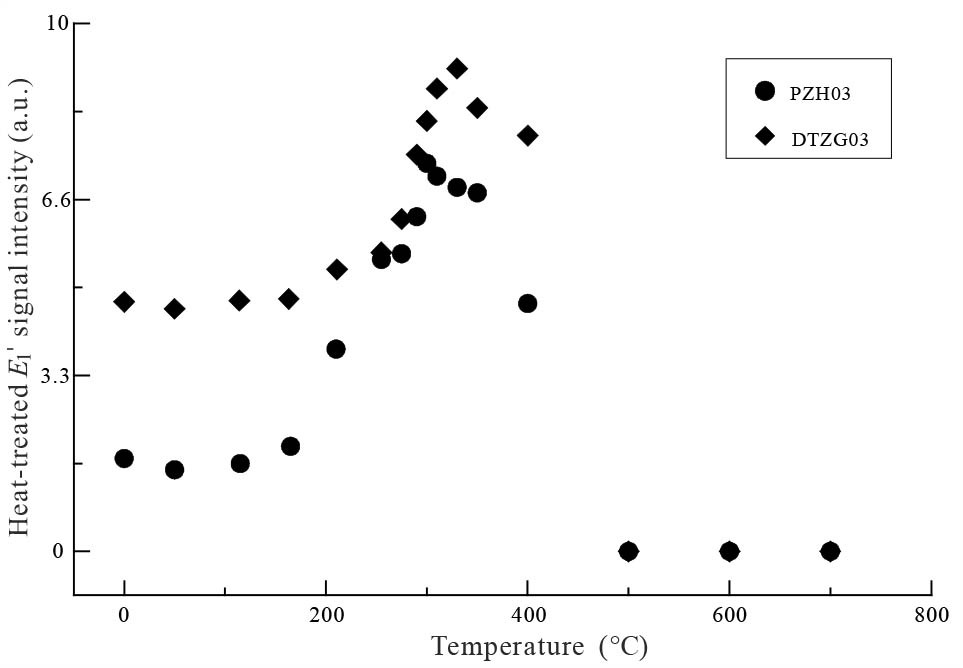
Weeks and Nelson (1960) first reported the intensity increase of the E1′ centre as a result of heating. Effects of heating on the ESR signal intensity in granitic quartz were investigated by Toyoda and Schwarcz (1997). Their experiment results showed that the E1′ signal intensity increased up to 300°C and then decreased until the signal disappeared at 500°C. Hence, they proposed that the E1′ centre could reach maximum value while heating at about 300°C and named it the heat-treated E1′ centre. Following the above experiments, Diao (2003) found that most of the core sediments had the maximum heat-treated E1′ signal intensity at 300°C while a few samples had it at 350°C. He attributed the quartz thermal activation difference to the variously original source rocks. Thus, to detect if the maximum heat-treated E1′ signal intensity of different samples would change at different heating temperature, we selected two samples (PZH03 and DTZG03) collected from different river drainage had them heated from 0°C to 700°C.
Fig. 3 shows that the E1′ signal intensity has slight variation below 200°C, followed by a fast increase and a decrease in the temperature range of 200 ~ 500°C, and disappeared above 500°C. This result is similar to previous works of Toyoda and Schwarcz (1997) and Diao (2003). However, it is worth noting that the PZH03 reaches the maximum heat-treated E1′ centre at 300°C while that of the DTZG03 at 330°C and the error caused by a difference in the heating process is excluded. The similar physical and chemical pretreatment process of samples could not lead to the disparity of the results of the two samples. Thus, the source rock formation history diversity and crystallization differentiation may be the factors which cause the different results. Nevertheless, this needs further investigation.
Fig. 3
The heat-treated E1’ signal intensity response to heating temperatures. The similar changes upon heating indicate that the heat-treated E1’ signal intensity of quartz extracted from fluvial sediment can reach the maximum value at about 300°C for 15 min. However, the maximum heat-treated E1’ signal intensity varies in quartz with different formation ages. For example, PZH03 reaches the maximum value at 300°C while DTZG03 at 330°C. Above about 400°C, the E1’ signal intensity of PZH03 and DTZG03 are zero.
The results of stepwise heating experiments of the two samples demonstrate that the heat-treated E1′ centre of quartz extracted from fluvial sediments will also reach the maximum value at about 300°C. This result is similar to the heating effect on the quartz extracted from granitic source rocks (Toyoda and Schwarcz, 1997) and marine sediments (Diao, 2003). These results indicate that the heat-treated E1′ centre of quartz with variously storing environments can reach the maximum value at about 300°C.
Relationship of ESR signal intensity of quartz between sediment and its source rock
One necessary condition for the quartz heat-treated E1′ centre used as a sediment provenance indicator is its stability after a long erosion-transportation-deposition cycle from source to sink. Thus, the quartz heat-treated E1′ signal intensity correlation between sediment and its source rock is evaluated. Fig. 4 shows that the quartz heat-treated E1′ signal intensity in sediment is similar to those of its source rock in the same drainage system, such as MN05 and MN06, 16KD05 and 16KDO6, 16PZH01 and 16PZH03, 16DTZG03 and 16DTZG04. To better understand the relationship between sediment and its source rock, their numerical difference was calculated using the equation:
where A is the quartz heat-treated E1′ signal intensity in sediment whilst B is the quartz heat-treated E1′ signal intensity in its source rock, Table 2.Fig. 4
Correlation between heat-treated E1’ signal intensity of quartz in source rock and its fluvial sediments heated at 300°C (a) and 330°C (b).
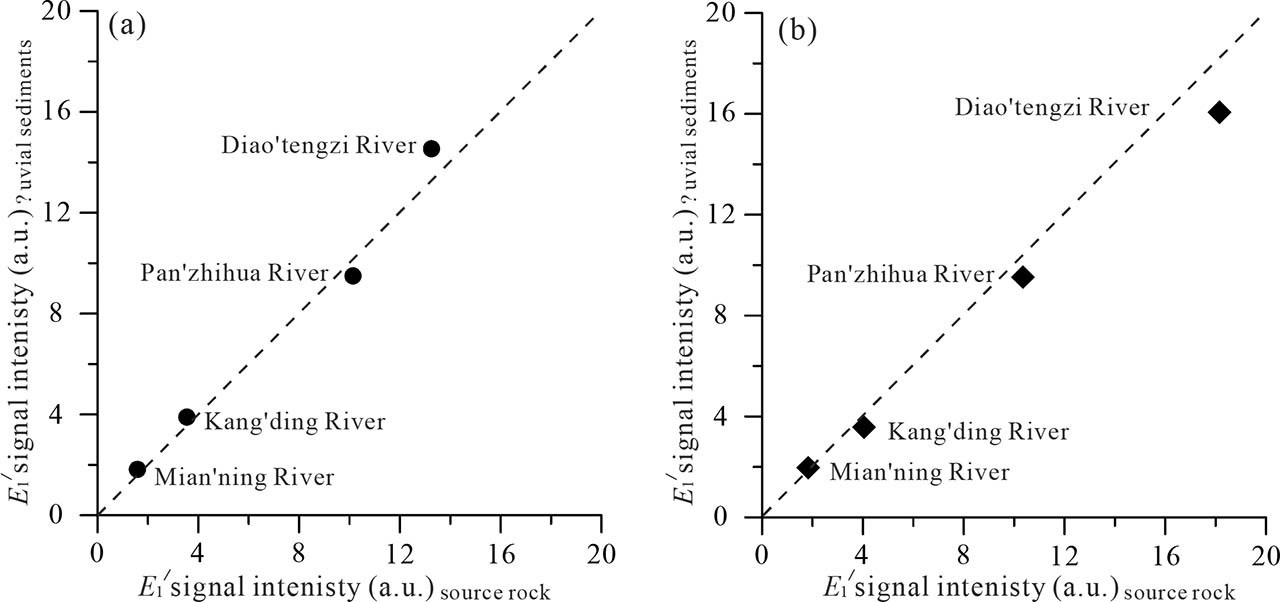
Table 2
Difference of quartz heat-treated E1’ signal intensity between sediment and its source rock.
Correlation between the quartz heat-treated E1′ centre and its source rock age
Odom and Rink (1989) suggested that for the correlation relationship between quartz natural E1′ signal intensity and its formation age in the range of 0.1 Ga ~ 1.4 Ga. Toyoda and Hattori (2000) found that the heat-treated E1′ signal intensity correlates with the age of the source granite in the range of 10 Ma ~ 1 Ga (Toyoda et al., 2016). Based on above studies, Toyoda et al. (2016) proposed that since the quartz heat-treated E1′ centre is correlated with the age of quartz, it can be an effective indicator of age in source rocks. Therefore, the heat-treated E1′ centre of quartz have been considered as a new powerful tool for provenance study (Ono et al., 1998; Attanasio et al., 2000; Duttine et al., 2002; Toyoda and Naruse, 2002; Crook et al., 2002; Nagashima et al., 2007, 2011; Sun et al., 2007, 2008, 2013; Toyoda, 2011; Yamamoto et al., 2013; Shimada et al., 2013; Tissoux et al., 2015; Toyoda et al., 2016; Shimada et al., 2016; Satio et al., 2017). In order to detect the correlation between the heat-treated E1′ signal intensity of fluvial sedimentary quartz and its source rock age, we compared the ESR signal intensities for the fluvial sediments and source rocks when heated at 300°C and 330°C, respectively (Fig. 5).
Fig. 5
Correlation between rock age and its heat-treated E1’ signal intensity. (a) heating temperature is 300°C; (b) heating temperature is 330°C.
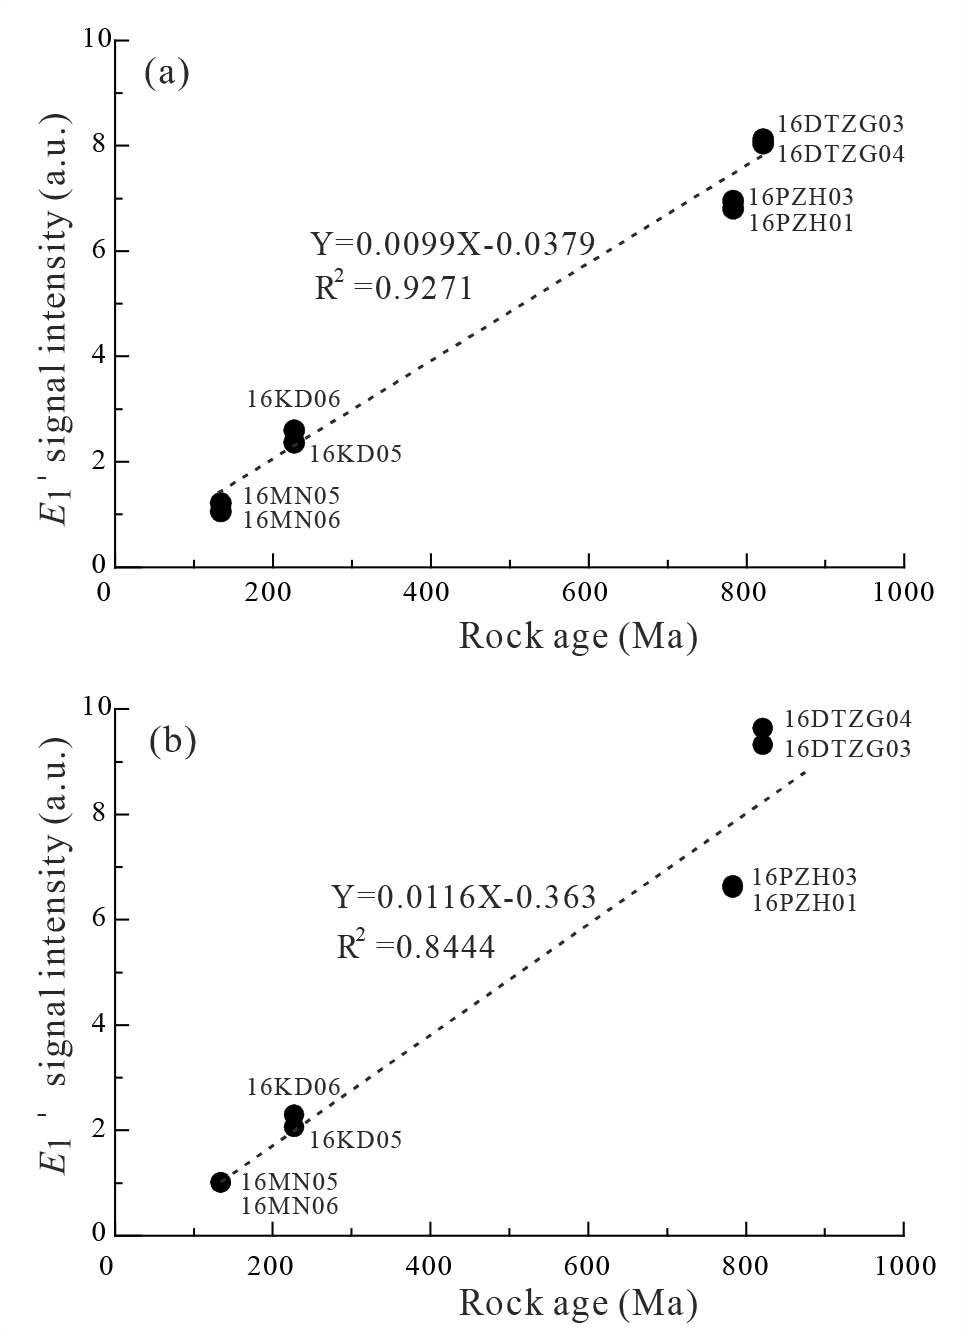
Our results indicate that the quartz heat-treated E1′ signal intensity is proportional to its formation age. The younger quartz with lower heat-treated E1′ signal intensity occupies the lower-left corner of Fig. 5a and Fig. 5b, whereas quartz extracted from older source rocks or sediments show higher heat-treated E1′ signal intensity at the top right corner of Fig. 5a and Fig. 5b. To better understand the correlation between the quartz heat-treated E1′ signal intensity and its formation age, we made a statistical analysis. The regression equations of heating at 300°C is y = 0.0099 x − 0.0379 while that of heating at 330°C is y = 0.0116 x − 0.363. The regression coefficient is R2 = 0.93 and R2 = 0.84, both showing clear linear relationship. The result is consistent with the previous works performed by Toyoda and Hattori (2000). Thus, we confirm that the quartz extracted from fluvial sediments and their source rocks also show significant correlation between its heat-treated E1′ signal intensity at about 300°C and its formation age.
Heat-treated E1′ centre in quartz as a provenance tracer
Previous studies showed that the possible sources and transport path of aeolian dust brought to North Asia, Chinese deserts and Chinese Loess Plateau are well defined with heat-treated E1′ centre signal intensity, together with the quartz crystallinity index (Sun et al., 2007, 2008, 2013; Toyoda et al., 2016). Fig. 5 shows that both heat-treated E1′ centre signal intensity at the two heating temperatures (300°C and 330°C) exhibit small variation within each river drainage but vary significantly among the four river drainages. The similar minor differences between the source rock and its fluvial sediment within each river drainage demonstrate that the heat-treated E1′ signal intensity can directly reflect the formation age of the quartz and would not be affected by the storage environment (stored in source rocks or sediment). Furthermore, the quartz heat-treated E1′ signal intensity of sediment almost equals that of its source rocks, which also imply that the quartz heat-treated E1′ centre would be a stable provenance tracer during the transportation from source to sink. Besides, the differences in the heat-treated E1′ signal intensity are apparent among the four river drainages, no matter when the quartz on heating at 300°C or 330°C. For example, the heat-treated E1′ signal intensities of PZH and DTZG are relatively higher compared to that of the MN and KD. Fig. 5a shows that PZH and DTZG with relatively high values (6.8 ~ 9.1 a.u.) while MN and KD with lower values (1.0 ~ 2.5 a.u.). Fig. 5b shows that PZH and DTZG with relatively high values (6.6 ~ 9.6 a.u.), whereas MN and KD with lower values (1.0 ~ 2.2 a.u.). The ESR signal intensity difference among the four river drainages demonstrate that the heat-treated E1′ centre can vary significantly depending on the formation age of the quartz. Thus, the quartz heat-treated E1′ centre marked with the characteristics that remain stable during transportation from source to sink and have variations depending on its source rock age.
Unlike previous provenance tracers that can directly indicate the source of the sediment, the heat-treated E1′ centre can only represent the quartz formation age, part of the source rock formations. In this case, it is unable to discriminate source rocks of different lithologies with the same quartz formation age. However, the quartz nature E1′ centre, which varies significantly in quartz of igneous, sedimentary and metamorphic source rocks (Wei et al., 2017), combined with the heat-treated E1′ centre would be useful in distinguishing quartz of different origins extracted from different lithological rocks with various formation ages. Because quartz is stable both physically and chemically, it forms the major component of the fluvial sediment, especially in large river sediment. Both of the two parameters discussed above are not affected by the weathering process and very easy to measure.
As the ESR signal parameters of heat-treated and natural E1′ centre we measured are from the same sample, the results are less influenced by the pretreated physical and chemical processes. Moreover, we reduced the uncertainties in heating temperature by using the same heating condition and controlling the accuracy temperature. Thus, compared with other provenance tracers, the heat-treated E1′ centre can effectively represent the quartz formation age, the natural E1′ centre can effectively distinguish the different lithology source rocks. Therefore, a combination of the two ESR signals offers a powerful approach for tracing the sediment quartz originated from different source regions. In conclusion, we propose the heat-treated E1′ centre, combined with other lithology discrimination indicators, can also serve as an effective provenance tracer in river drainage.
. CONCLUSIONS
Responses of the E1′ centre of quartz extracted from fluvial sediment and its source rock to the artificial heating at different temperatures were investigated. It was revealed that the quartz heat-treated E1′ centre of fluvial sediment also could reach the maximum value on heating at about 300°C for 15 min, which is consistent with the previous works. The significant correlation between quartz heat-treated E1′ signal intensity and its formation age showed that the heat-treated E1′ centre could directly reflect the quartz formation age. The statistical analysis indicates that the ESR signal intensity of quartz heat-treated E1′ centre heated at 300°C has better linear correlation with various original formation age of source rocks. In conclusion, this study demonstrates that the heat-treated E1′ signal intensity (oxygen vacancies) can be a stable indicator for provenance research on fluvial sediments.