
. Introduction
Electron spin resonance (ESR) signals, thermoluminescence (TL), and optically stimulated luminescence (OSL) have all been used to date material from the Quaternary (Ikeya et al., 1983; Aitken, 1985, 1998; Ikeya, 1993). Recently, a method has been developed that uses ESR and TL signals as indicators of sediment provenance (Ganzawa et al., 1997). Sediment provenance provides important information related to mountain uplift, environmental change in drainage basins, and crustal movement.
The E1’ center intensity of quartz can be used to investigate the provenance of aeolian dust (Naruse et al., 1997; Toyoda and Naruse, 2002; Nagashima et al., 2007). The heat-treated E1’ center signal intensity, which corresponds to the number of oxygen vacancies in natural volcanic and granitic quartz, is correlated with age, with higher values found in the quartz of older source rocks (Toyoda and Hattori, 2000; Toyoda and Naruse, 2002). The Al, Ti-Li, and E1’ center signal intensities of quartz are useful in determining sediment provenance (Duttine et al., 2002; Shimada and Takada, 2008; Shimada et al., 2013). The Al center is an electron hole trapped at the bond between oxygen atoms and Al impurity atoms (the latter having replaced Si in the quartz crystal; O’Brien, 1955). The Ti-Li center is an electron trapped at Ti, which can also replace Si in the quartz crystal, together with an accompanying Li ion (Wright et al., 1963). As Usami (2010) showed that the ESR signal intensity of the Al center positively correlates with the concentration of Al in quartz (on the order of ppm), the ESR signal intensity of the impurity centers is related to the amount of impurities in the quartz crystals, and so indicates the geochemical and geophysical conditions of quartz crystallization.
As no E1’ center is observed in quartz crystals from young bedrock, the amount of the various impurities in quartz is a useful index for estimating the provenance of sediments of Quaternary volcanic origin (Shimada and Takada, 2008; Shimada et al., 2013). Shimada et al. (2013) showed that the diagram of Al versus Ti-Li centers signal intensities from the same grain size can be used to roughly distinguish Quaternary volcanic sediments from granitic rocks. Tissoux et al. (2015) showed that the method using ESR signals makes it possible to discriminate quartz grains of different geological sources from one another.
In this study, we investigate the relationships among ESR signals of quartz in modern river bed sediments and bedrocks of the Kizu River basin using the dose-saturated signal intensities of the Al and Ti-Li centers. In addition, we use these ESR signal intensities to estimate the mixing ratios of the source materials that make up the river bed sediments.
. Regional Geology and Sampling
Bedrock is broken down by weathering into unconsolidated materials, which are then carried downstream by rivers. In this study, modern river bed sediments and bedrock samples were collected at sites S1–S7and R1– R5, respectively, from the Kizu River basin, western Japan (Fig. 1). The total length of the Kizu River is 89 km, and the basin covers an area of 1663 km2.
Fig. 1
Location map showing sample sites for the present-day river bed sediments and the possible source rocks around the Kizu River, Japan.
R1 – Muro pyroclastic flow deposits;
R2 – Metamudstone with sandstone;
R3 – Ao granite;
R4 – Yagyu granite;
R5 – Shigaraki granite;
S1–S7 – Present-day river bed sediments.
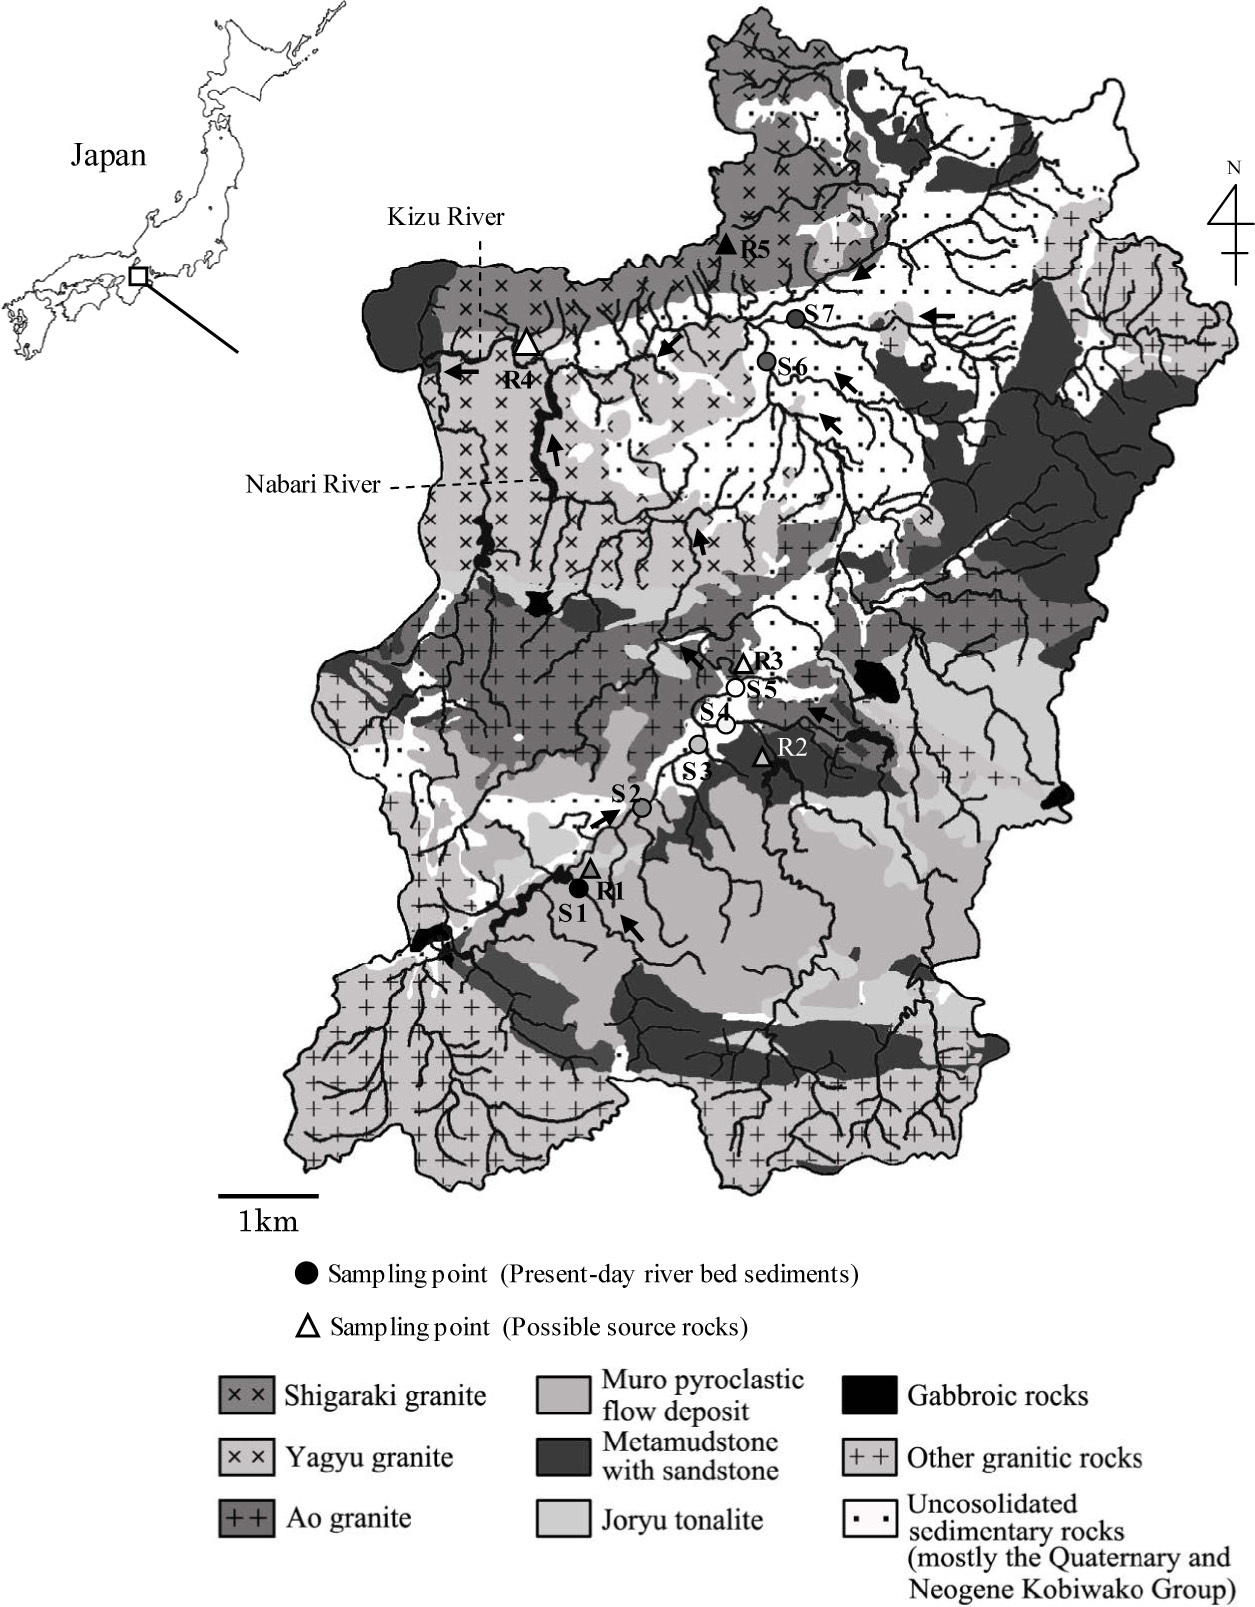
Samples S1–S5 and R1–R3 were collected along the Nabari River, one of the large tributaries of the Kizu River in the southern part of the basin. Samples S6–S7 and R4–R5 were collected along the main course of the Kizu River. Muro pyroclastic flow deposits (sample R1) are widely distributed in the upper (southern) section of the Nabari River and along the main course of the Kizu River. Metamudstone with sandstone (sample R2) from the mid-Paleozoic Tamba Belt is distributed in the upper (southern) and middle reaches of the Nabari River, and along the main course of the Kizu River. Ao granite (sample R3) and Yagyu granite (sample R4) are widely distributed along the middle reaches of the Nabari River and along the main course of the Kizu River, and Shigaraki granite (sample R5) is found in the lower (northern) basin of the Kizu River (Fig. 1). The bedrock in the northern part of the drainage basin includes the Quaternary and Neogene Kobiwako Group, whereas the southern part of the basin comprises the Joryu tonalite and other granitic rocks. Although other rock types are present in the study area, the rock types defined as R1 to R5 are dominant, which suggests that the modern river bed sediments are derived mostly from these basement rocks.
. Samples and Experiments
Sample preparation
Quartz particles in fluvial sediments are moved downstream by the tractive force of the river. Therefore, in this study we used sand-sized quartz grains from river bed sediments of the Kizu River to estimate the composition and sources of these deposits. The samples of crushed rocks and river sediments were sieved to separate out the 500 μm and 1 mm fractions. Magnetic minerals were removed using a magnetic separator. The sieved samples were treated with 6M hydrochloric acid (HCl) overnight, and then with a 1% HF and 1% HNO3 mixture for 12 h, prior to heavy liquid (sodium polytungstate solution) separation. The quartz grains were etched with 46% HF for 1 h to dissolve any contaminating feldspar and then treated with 6M HCl overnight. Finally, the samples were crushed and re-sieved into fractions containing 120 and 250 μm quartz grains.
Gamma ray irradiation
The ESR dose response curves of quartz grains from impurity centers are known to grow with high radiation doses (Yokoyama et al., 1985). Therefore, we used the dose-saturated ESR signal intensities. To obtain the additive dose responses of the signals, subsamples of quartz samples R2, R3, and S4 were divided into 6–9 aliquots. They were then irradiated using a 60Co gamma ray source with doses ranging from 0.2 to 3 kGy and a dose rate of 100 Gy/h at the Takasaki Research Institute of the Japan Atomic Energy Agency. Based on the results from these irradiated samples, all samples were irradiated to a dose of 2.5 kGy at a dose rate of 100 Gy/h to obtain the dose-saturated signal intensities.
ESR measurement
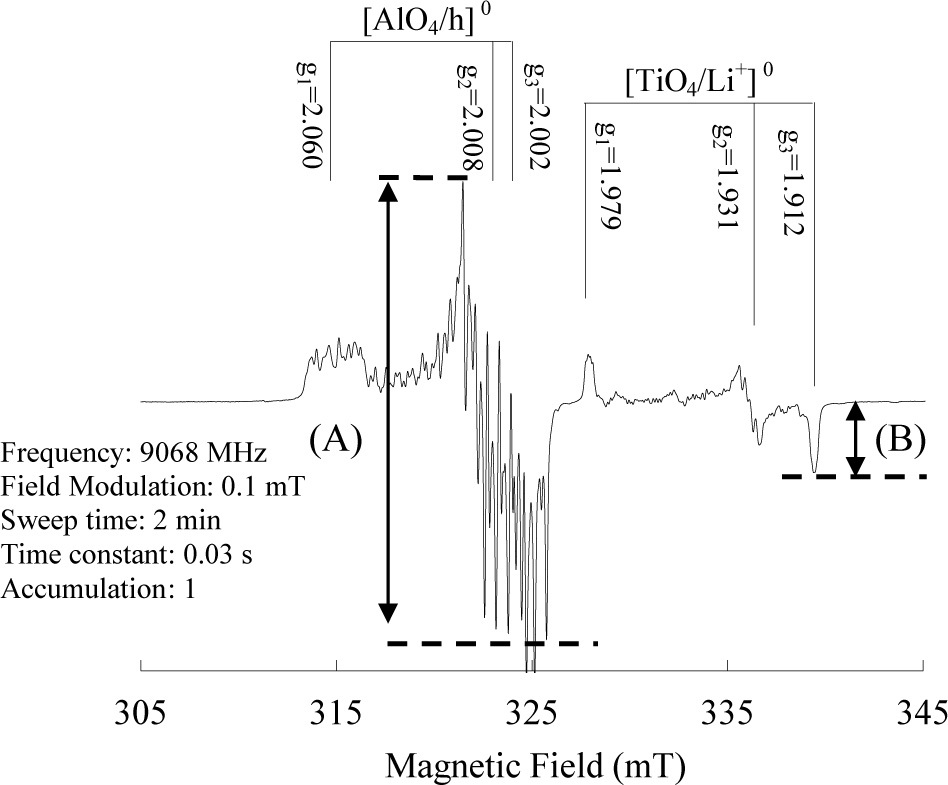
ESR measurements were conducted using a JES-X320 X-band spectrometer (JEOL RESONANCE Inc.) with the Liquid Helium Variable Temperature System (ES-CT470). The Al and Ti-Li center signals from the quartz samples were measured at 77 K (–196°C) using a microwave power of 5 mW, a sweep time of 2 min, a time constant of 0.03 s, an amplitude of field modulation of 0.1 mT, and a modulation frequency of 100 kHz. Fig. 2 shows the ESR spectrum of sample R1 at 77 K. We took the relative height from the top of the first peak to the bottom of the 16th peak of the main hyperfine structures as the Al center intensity (Yokoyama et al., 1985; Toyoda and Falguères, 2003; Shimada and Toyoda, 2004), and the relative height from the baseline to the peak at the bottom of the g = 1.913 point as the Ti-Li center intensity (Toyoda et al., 2000). Given that the peroxy center signal at g = 2.067 overlaps the Al center signal, Toyoda and Falguères (2003) suggested taking the peak height between g = 2.018 and 1.993 as the Al center signal intensity to avoid the contribution from the peroxy center signal. To calculate the g values of the ESR signals, and to further check the sensitivity of the ESR spectrometer, we used the intensity of a standard MnO marker inside the cavity. Each sample was measured five times, and the sample tube was rotated in the cavity to average the angular dependence of the ESR signals. For normalization and sensitivity correction, the average peak intensities were divided by the weight of the sample and by the standard MnO marker signal intensity, which was measured together with the sample.
. Results and Discussion
Gamma ray dose response of ESR signal intensity
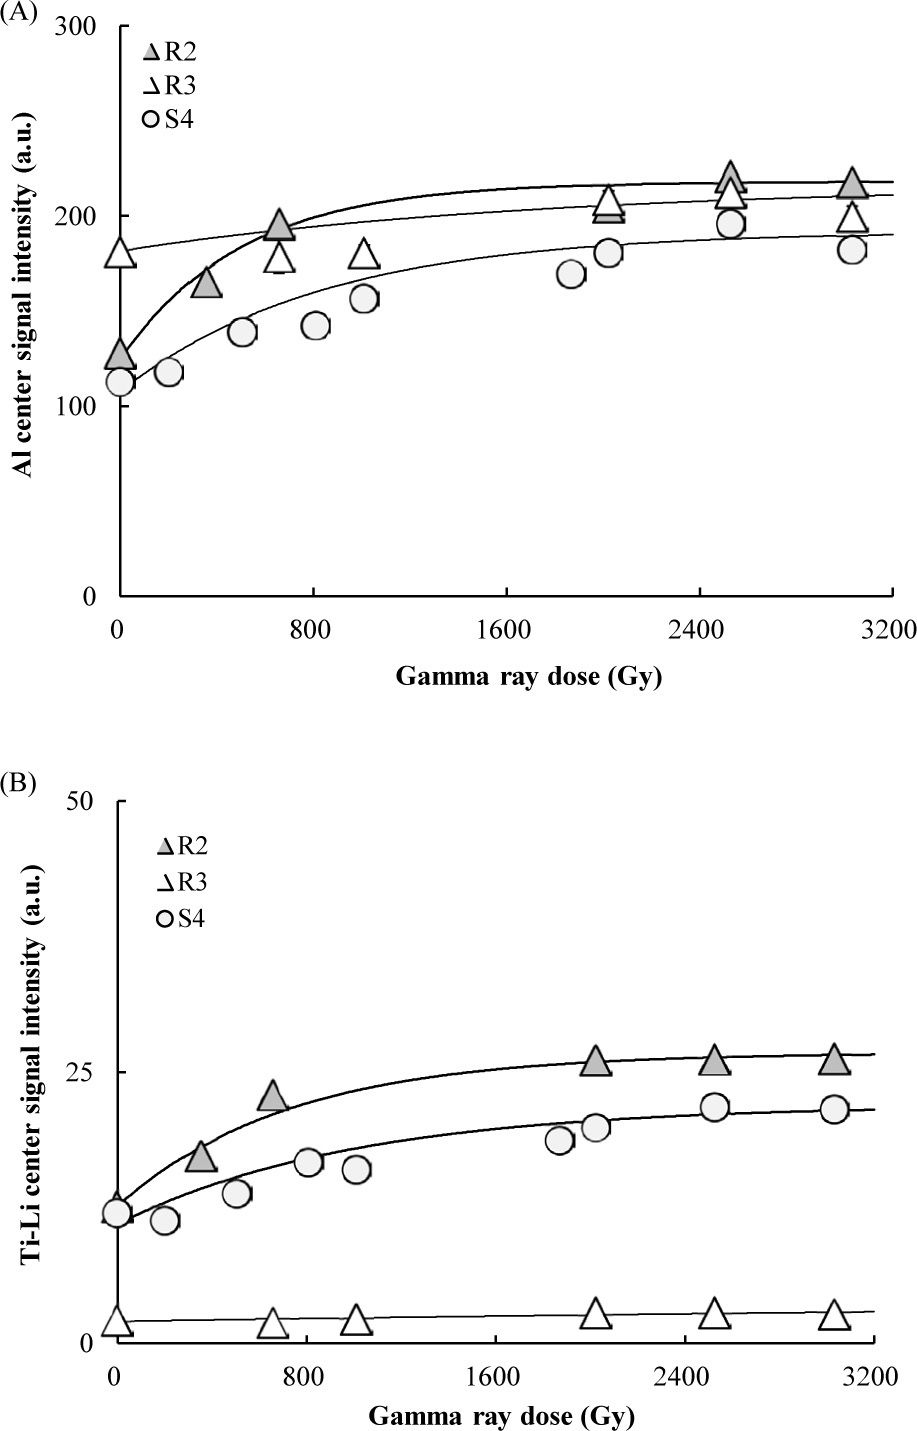
The Al and Ti-Li center signal intensities obtained from the quartz of the metamudstone with sandstone sample R2 and the river sediment sample S4 increased with the gamma ray dose, becoming almost saturated above 2.5 kGy (Fig. 3A, 3B). The intensities obtained from the quartz in the granitic samples (R3) were almost saturated with gamma ray doses above 2 kGy (Fig. 3A, 3B). Different samples may have received different accumulated natural doses that cause the signal intensities to differ; therefore, to erase the effect of different natural radiation doses, we used a dose of 2.5 kGy in order to reach the saturation for all samples.
Variations in ESR signal intensities within the same sample
Each sample was divided into five aliquots and then each aliquot was measured five times to investigate variations in the Al and Ti-Li center signal intensity of the quartz in the same sample. Deviations of the Al and Ti-Li center signal intensity from the quartz from the present-day river bed sediments (S1–S7) and bedrock (R1–R5) samples were between 1% and 6% in a given sample (Table 1). The repeated measurement error for each sample was within ±11%. Therefore, when the difference in the signal intensities between the different samples was larger than this measurement error, we assumed that the samples were indeed different.
Table 1
Sample numbers and names, and ESR signal intensities.
ESR signal intensities in artificially mixed quartz samples
When two sources of quartz with ESR signal intensities a and b are combined with a mixing ratio of x: (1 – x), the ESR signal intensity, c, of the mixed sample can be expressed as follows:
To investigate variations in the Al and Ti-Li center signal intensity of the quartz in the volcanic (R1) and granitic (R5) samples, we tested five mixed samples based on the following x values (i.e., % R1): 100, 75, 50, 25, and 0. The ESR signal intensities varied with the mixing ratios (Fig. 4; Table 2). The ESR signal intensity of a sample consisting of material of two different origins is affected by the signal from both sources. The ESR signal intensities linearly increased or decreased with the mixing ratios of the samples (Fig. 5A, 5B). Therefore, it is possible to estimate the provenance of these sediments by measuring the ESR signal intensities of’ quartz crystals found in the river sediments and related bedrock.
Fig. 4
Change in the Al versus Ti–Li center signal intensities for quartz caused by changing the mixing ratio of the samples (samples R1 and R5; n = 5).
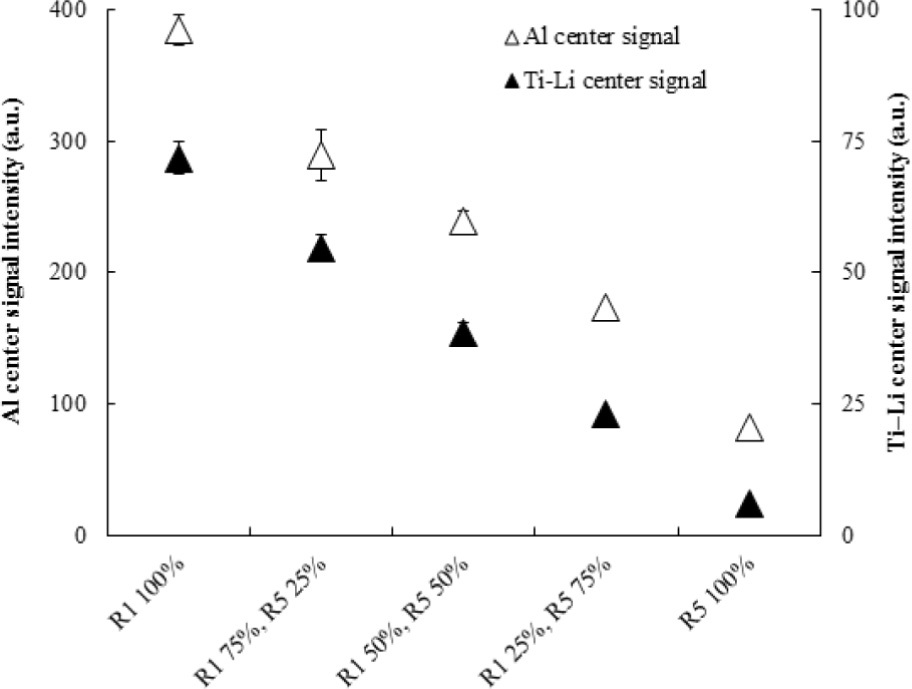
Table 2
ESR signal intensities of artificially mixed samples created by mixing samples R1 and R5 (n = 5).
ESR signal intensities of quartz in the river bed sediments and possible source rocks
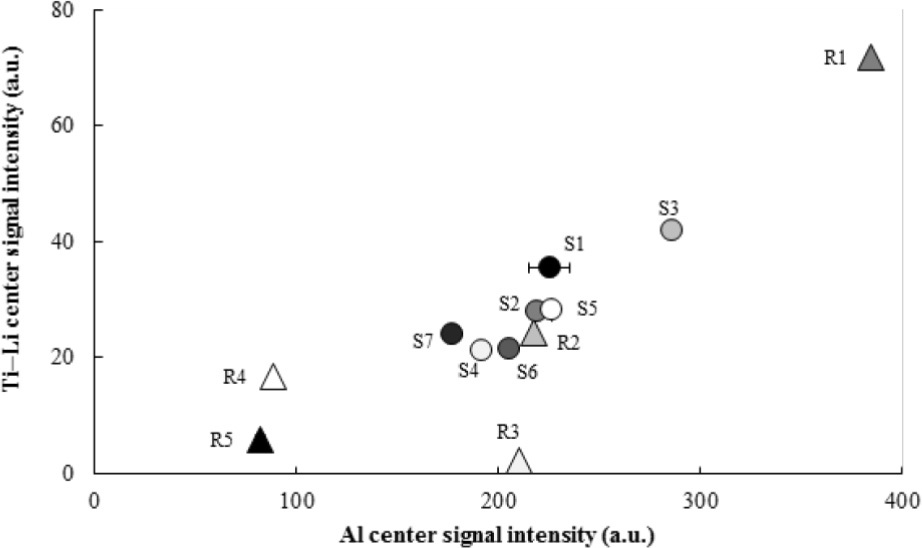
The dose-saturated ESR intensities of samples S1–S7 and R1–R5 are shown in Fig. 5 and Table 1. The Al and Ti-Li center signal intensities of sample R1 (Muro pyro-clastic flow deposits) are the highest among all the samples. The Al and Ti-Li center signal intensities of sample R2 (metamudstone with sandstone) plot between those for R1 (Muro pyroclastic flow deposits) and R3 (Ao granite) or R5 (Shigaraki granite) on the Al versus Ti-Li signal diagram. The Ti-Li center signal intensity of sample R3 (Ao granite) is the lowest among these samples, whereas the Al center signal intensity of sample R5 (Shi-garaki granite) is the lowest of all the samples. The Al and Ti-Li center signal intensities of quartz in the modern river bed sediments plot within the quadrilateral area bounded by R1, R3, R4, and R5 on the Al versus Ti-Li signal diagram (Fig. 5), indicating that the present-day river bed sediments are a mixture of the source rocks within the drainage basin.
Mixing ratios of the present-day river bed sediments
As shown in Fig. 1, the Muro pyroclastic flow deposits (R1) and metamudstone with sandstone (R2) are widely distributed around sampling sites S1 and S2, and in the upstream basin, suggesting that R1 and R2 are the main sources of the quartz deposited at sites S1 and S2. Using Eq. 4.1 and the Al center signal intensities, the mixing ratios are 0.05:0.95 for R1:R2 in sample S1, and 0.01:0.99 for R1:R2 in sample S2 (Table 3). However, using Eq. 4.1 and the Ti-Li center signal intensities, these ratios are 0.23:0.77 for R1:R2 in sample S1, and 0.08:0.92 for R1:R2 in sample S2 (Table 3). The mixing ratios calculated using the Al center signal should be the same as those calculated using the Ti-Li center signal; therefore, the discrepancy between them suggests that the contribution from other source materials is not negligible.
As for samples S3, S4, and S5, there would be additional large contributions from the Ao granite (R3) that crops out in the upstream section of the river above these three sampling sites. When three sources with Al and Ti-Li center signal intensities a and a’, b and b’, and c and c’ mix in the ratio x:y:z, the resultant signal intensity of the Al (d) and Ti-Li (d’) center can be expressed as follows:
Table 3
Mixing ratios of the present-day river bed sediments and ESR signal intensities of the samples.
where
In Table 3, we show the results of these calculations for samples S3–S7.
The mixing ratio R1:R2:R3 for S3 was calculated using Eqs. 2–4 from the ESR signal intensities of samples R1 (Muro pyroclastic flow deposits), R2 (the metamudstone with sandstone), and R3 (Ao granite) as 0.42:0.49:0.09; however, the mixing ratios for S4 and S5 include unrealistic negative values, suggesting a significant contribution from other source materials.
Sample site S5 is located downstream from the junction of two rivers, one of which flows through site S3 and the other through S4 (Fig. 1). The locations of S3, S4, and S5 are almost collinear (see Fig. 5). Therefore, the location of site S5 suggests that the present-day river bed sediments from sites S3 and S4 have mixed to form the deposits sampled at S5. If we use the Al center signal intensities, the estimated mixing ratio of S3:S4 in sample S5 is 0.36:0.64, and using the Ti-Li center signal intensities the mixing ratio is 0.33:0.67. As the two mixing ratios are almost the same, we suggest that the source materials and their mixing ratio are predominant. Thus, it is possible to estimate the mixing ratios of the source rocks and of the present-day river bed sediments by using the ESR signal intensities. The results of present analysis (Fig. 5) would indicate that the ESR signal intensities of river sediments are strongly affected by the nearby rocks (such as S2). However, the locations of S1 to 5 in Fig. 5 are not exactly within the range of the locations of R1 to 3 which are the possible original rock sources analyzed in the present study, but might indicate that there is still another source with higher Ti-Li and lower Al center signal intensities. A possible major rock source would be Joryu tonalite (Fig. 1), which has not yet been analyzed.
As shown in Fig. 1, the metamudstone with sandstone (R2), Ao granite (R3), and Yagyu granite (R4) are distributed around, and upstream from, site S6 suggesting that the quartz deposited at S6 is derived from these source rocks. If we use the Al and Ti-Li center signal intensities, the mixing ratio of R2:R3:R4 for sample S6 is 0.86:0.06:0.08 (Table 3). In a similar way, the metamudstone with sandstone (R2), Yagyu granite (R4), and Shigaraki granite (R5) are distributed around, and upstream from, site S7, suggesting that the quartz deposited at S7 is derived from these source rocks. If we use the ESR signal intensities, the mixing ratio of R2:R4:R5 for sample S7 is 0.68:0.53:–0.21 (Table 3). As the mixing ratio for sample S7 includes an unrealistic negative value, we suggest that the contribution from other source materials is significant.
We made a tentative estimate of the mixing ratios using the ESR Al and Ti-Li center signal intensities from only the 0.5–1.0 mm fraction of the quartz grains in the present-day river sediments; however, to quantitatively estimate the precise provenance of sediments we should consider the composition, grain size distributions, and sorting during transportation of the minerals in the sediments. These tasks will be the subject of a future investigation.
. Conclusions
The dose-saturated ESR signal intensities of quartz grains from samples of present-day river bed sediments in the Kizu River plot overlap with those of possible source bedrocks in a Al versus Ti-Li signal diagram (Fig. 5), indicating that the modern river bed sediments are a mixture of the source materials distributed across the drainage basin. We estimated the mixing ratios of the possible bedrock sources from the ESR signal intensities (Table 3). Consequently, we were able to quantitatively estimate the provenance of the present-day river bed sediments using the dose-saturated Al and Ti-Li center signal intensities of quartz grains recovered from the sediments.