
. Introduction
A well-established high-resolution chronology from southern mid-latitude sites is needed for providing a consistent framework of the inter-hemispheric climate changes. Archives in New Zealand play an important role for palaeoclimate reconstruction in the Southern Hemisphere (Alloway et al., 2007). Loess deposits represent one of the most widespread Quaternary archives in New Zealand, as they are estimated to cover approximately 10% of the land surface (Eden and Hammond, 2003; Yates et al., 2018).
Despite the well-established chronology of the North Island, there are few dating studies on the South Island of New Zealand. It was shown that some of the Quaternary dating methods have partial or no utility for chronological studies on loess-paleosol deposits from South Island. The current situation is that in addition to the fact that radiocarbon dating has a limited age range, previous studies have shown that both organic material and charcoal that is interbedded within loess may be contaminated by younger mobile organic compounds (Goh et al., 1978; Hammond et al., 1991). In later studies, Hormes et al. (2003) concluded that the radiocarbon ages reported by Almond et al. (2007) for Birdlings Flat loess at Ahuriri Quarry, Banks Peninsula, are inconsistent with the optically stimulated luminescence (OSL) ages as well as with the isochrone established by Kawakawa tephra. The variations recorded in magnetic susceptibility on loess paleosol sequences are usually allowing for secure correlations with marine isotope stages (MIS) chronology, as the signal is influenced by the climatic conditions. However, for soils in areas such as the eastern part of the South Island, where the mean annual rainfall is less than 1200 mm, Pillans (1991, 1994) concluded that fluctuations recorded in the magnetic susceptibility are shielded due to iron remobilisation. For Canterbury, the mean annual rainfall is 645 mm. Widespread tephra bed layers can play a crucial role for establishing chronological frameworks, but because of the long distance from the volcanic sources in North Island, South Island is poor in tephra marker horizons, with only two widespread tephra marker layers recognized in the loess deposits: the Aokautere Ash Member of Kawakawa Tephra Formation (22,590 ± 230 yr BP, ca. 26,500 cal. yr BP – Wilson et al., 1988), identified in the upper loess units throughout most of South Island (e.g. Campbell, 1986, Eden et al., 1992; Almond et al., 2007) and the Rangitawa Tephra, dated at ≅340 ka (Kohn et al., 1992; Alloway et al., 1993; Plillans 1996) and detected only by microscopic grain counting (Eden et al., 1992).
The OSL dating method has been successfully applied on quartz and feldspars extracted from various sediments on both the Northern and Southern Hemisphere during the last decades. The precision and the accuracy of the ages obtained have increased due to the development of the single-aliquot regenerative-dose (SAR) protocol on quartz (Murray and Wintle, 2000, 2003), as well as the versions of the protocol developed for feldspars, especially the post-infrared–infrared protocols (pIRIR), pIRIR225 (Buylaert, 2009) and pIRIR290 (Thiel, 2011). However, relatively few luminescence dating studies have been reported on sediments of various origins from South Island, New Zealand (e.g. Berger et al., 2001, 2002; Hormes et al., 2003; Litchfield and Lian 2004; Preusser et al., 2005; Almond et al., 2007; Rowan et al., 2012; Sohbati et al., 2016). For dating relatively young sediments, the preferred natural dosimeter is quartz, due to the higher bleachability of the signal. However, there are a few studies that reported luminescence ages using quartz (e.g. Holdaway et al., 2002; Nichol et al., 2003; Litchfield and Rieser, 2005; Rowan et al., 2012), and there is evidence that quartz from South Island suffers from major problems that limit its application, namely the weak sensitivity of the signal, with the signal apparently arising from many dim grains and the unsatisfactory behaviour in the SAR protocol (Preusseur et al., 2006). The recent developments of the pIRIR protocols based on the SAR procedure have increased the interest in using feldspars. While a number of studies reported the use of the infrared-stimulated luminescence (IRSL) dating method on coarse-grained K-rich feldspars (Preusseur et al., 2005) or on polymineral fine grains (e.g. Berger et al., 2001, 2002; Hormes et al., 2003; Rother et al., 2009; Almond et al., 2001, 2007; Shulmeister et al., 2010), the potential of the pIRIR protocols for dating sediments in South Island was not fully explored. To our knowledge, the only exceptions are the studies conducted by Sohbati et al. (2016) and Borella et al. (2016), which have applied the pIRIR290 method on K-rich feldspars extracted from palaeo-rockfall boulders and loessic deposits south of Christchurch.
The aim of this study is to further explore the luminescence properties of quartz extracted from a loess deposit from Canterbury Plains, in the South Island, and to assess the applicability of two pIRIR stimulated luminescence protocols on polymineral fine grains extracted from the same samples.
. Study Site
Apart from the Ross (2.4–2.6 Ma) and Porika (2.1–2.2 Ma) glaciations, New Zealand has undergone at least five glaciations during the Quaternary (Suggate, 1990). The most extensive deposits of loess are located across the foothills of the Southern Alps and in the lowlands of the Canterbury Plains (Yates et al., 2018). The most developed loess deposits, reaching a thickness of >20 m, are located on the lowlands south of Timaru (south Canterbury) and on Banks Peninsula (Bell and Trangmar, 1987). Based on mineralogical composition, the main source material for loess deposits from Canterbury Plains is eroded from the Southern Alps (Raeside, 1964; Sparrow, 1948; Young, 1964). Using thermoluminescence (TL), Berger et al. (2001) dated loess deposits from the south Canterbury Plains and Banks Peninsula, reporting ages ranging from 246 ± 91 ka (oldest age reported for Barrys Bay) to 21.4 ± 2 ka (youngest age reported for Cust section).
The study site (44.018870°S, 171.882054°E) is located in the southern Canterbury Plains, on the eastern side of central South Island (Fig. 1). Modern Rakaia, Ashburton and Rangitata rivers flow perpendicularly to the eastern coastal cliff in the Canterbury Plains, discharging into the Pacific Ocean. The coastline at the study site consists of a steep cliff, up to m high and comprises poorly sorted and uncemented matrix-supported outwash gravel that is capped by a few metres of loess and modern soil. The cliff is eroded by a series of wide coastal gullies (locally known as dongas). The sampling site is located halfway between Rakaia and Ashburton rivers, on the southern flank of one of these coastal gullies.
Fig 1
The map of the Canterbury Plains. The studied site is represented by filled circle (map source: www.d-maps.com).

For luminescence investigations, five samples were collected from the top section of the flank. The uppermost sample was discarded from the analysis due to its proximity to the modern disturbed surface. The uppermost three samples analysed (NZ 2, NZ 3 and NZ 4) were collected at depths of 30 cm, 50 cm and 70 cm, whereas the last sample (NZ 5) was collected from a depth of 140 cm. According to Berger et al. (2001), they are expected to belong to L1 unit.
. Methodology
. Sample Preparation
Luminescence samples were collected in stainless steel tubes and were prepared under subdued red-light laboratory conditions. The material from the end of each tube was removed and used for gamma spectrometry measurements. The material from the inner part of the tubes was used for 63–90 μm, 90–125 μm, 125–180 μm, 180–250 μm quartz and 4–11 μm polymineral grains’ extraction. Treatments with hydrochloric acid (10% concentration) and hydrogen peroxide (10% concentration followed by 30%) were employed for calcium carbonate and organic matter removal. Finer (<63 μm) and coarser (>63 μm) grains were separated through wet sieving. Polymineral fine grains (4–11 μm) were separated from the finer polymineral fraction obtained after Stoke's law, settling and centrifuging in distilled water (Frechen et al., 1996; Lang et al., 1996). The coarser (63–90 μm, 90–125 μm, 125–180 μm and 180–250 μm) grain fractions were obtained by dry sieving. To isolate the coarse quartz fraction from the polymineral mixture, a density separation using heavy liquid was performed (2.62 and 2.75 g/cm3). To remove any remaining feldspars and the outer alpha-irradiated portion of grains, the quartz-rich fraction was obtained by etching with hydrofluoric acid (40% concentration for 40 min) followed by a rinse with hydrochloric acid (10%) for 60 minutes to dissolve any insoluble fluorides that may have formed. For luminescence measurements polymineral fine grains were mounted on aluminium discs, whereas for coarse quartz stainless steel discs were used.
. Analytical Facilities
All luminescence measurements were carried out using two Risø TL/OSL readers (model DA-20), equipped with a classic or automated detection and stimulation head (DASH) (Lapp et al., 2015). EMI 9235QA and PSM 9107Q-AP-TTL-03 (160–630 nm) photomultipliers were used for luminescence signals detection. Quartz signals were detected using a 7.5-mm-thick Hoya U-340 UV filters, while for polymineral fine grain signals a blue filter combination (Schott BG3 + Corning 7–59, with transmission between 320–460 nm) was used. Beta irradiations were carried out by 90Sr-90Y radioactive sources mounted on the readers and calibrated for both fine and coarse fractions using gamma-irradiated calibration quartz (Hansen et al., 2015).
The natural luminescence signal of the polymineral fine grain aliquots used for bleaching experiments and residual dose measurements was erased by exposing the disks to window light under natural conditions in March (latitude 46° 47′ N).
Raman spectra have been recorded using a Renishaw InVia Reflex Confocal Raman system with a Leica microscope using the 100× (NA 0.9) long working-distance objective. For excitation, a Cobolt DPSS laser emitting at 532 nm was employed. Wavenumbers’ calibration has been achieved using the internal silicon standard. An edge filter was employed for removing the Rayleigh line and the spectra were recorded in the 50–1840 cm−1 range with 0.5 cm−1 resolution. The acquisition conditions were 1s exposure, 1 accumulation and 100% of the output laser power (≅200 mW). A Rencam CCD was employed for signal detection and data acquisition, and processing has been achieved using the WIRE 3.4 and Origin 9.2 software.
. Equivalent Dose Determination
The single-aliquot regenerative-dose optically stimulated luminescence (SAR-OSL) protocol (Murray and Wintle 2000, 2003) was applied on coarse quartz grains. Full details on the protocol are given in Table S1A in Supplementary Material. Optical stimulation was carried out with blue light-emitting diodes for 40 s at 125°C. For analysis, the signal integrated over the first 0.308 s was used after an early background subtraction from 1.69–2.30 s interval, unless otherwise mentioned. A preheat temperature of 220°C for 10 s and a cutheat (ramp heating) of 180°C were employed. At the end of each SAR cycle, a high temperature bleach of 280°C for 40 s was performed. To check the robustness of the SAR protocol, intrinsic tests (recycling and recuperation) were included in every measurement as well as infrared (IR) depletion tests (Duller, 2003).
Equivalent doses measured on polymineral fine grains were carried out by applying two elevated-temperature infrared-stimulation methods based on the SAR procedure and the pIRIR225 (Buylaert et al., 2009; Wacha and Frechen, 2011; Vasiliniuc et al., 2012) (Table S1B in Supplementary Material) and pIRIR290 (Buylaert et al., 2011a, 2012; Thiel et al., 2011) (Table S1C in Supplementary Material) protocols. To reduce the signal susceptible to fading by allowing recombination of near-neighbour trap and centre pairs, a stimulation with IR diodes for 200 s at 50°C was performed after a preheat of 60 s at 250°C in the case of pIRIR225 protocol and 320°C in the case of pIRIR290 protocol, respectively. The signal of interest was recorded during a subsequent IR stimulation for 200 s at 225°C in the case of pIRIR225 protocol and at 290°C in the case of pIRIR290 protocol. The net signal used for analysis was integrated from the initial 2.5 s of stimulation minus a background evaluated from the last 50 s. A high temperature bleach was performed for 100 s at 290°C (pIRIR225 protocol) and 325°C (pIRIR290 protocol) at the end of each cycle of measurements. The size of the test dose was 17 Gy for all measurements.
. Dosimetry
High-resolution gamma spectrometry was applied to determine the radionuclide specific activities using a well-type HPGe detector. For 226Ra-222Rn equilibrium to be reached, the samples were stored for 1 month before measurement. Annual dose rates were determined using the conversion factors tabulated by Guérin et al. (2011). An alpha efficiency factor of 0.08 ± 0.02 was considered for the 4–11 μm polymineral fraction (Rees-Jones, 1995). The time-averaged water content was assumed to be 15% with a relative error of 25%. The water content was chosen to represent the mean water content over the depositional history of the sediments. Similar values for water content were used by Rowan et al. (2012) and Sohbati et al. (2016) for sediments from Canterbury Plains and Banks Peninsula, respectively. The external contribution from beta, gamma and alpha radiation, as well as from the cosmic background radiation, was included in the total dose rates. The cosmic dose rate was estimated as a function of depth, altitude and geomagnetic latitude (Prescott and Hutton, 1994).
. Results And Discussion
. Luminescence Properties – Quartz
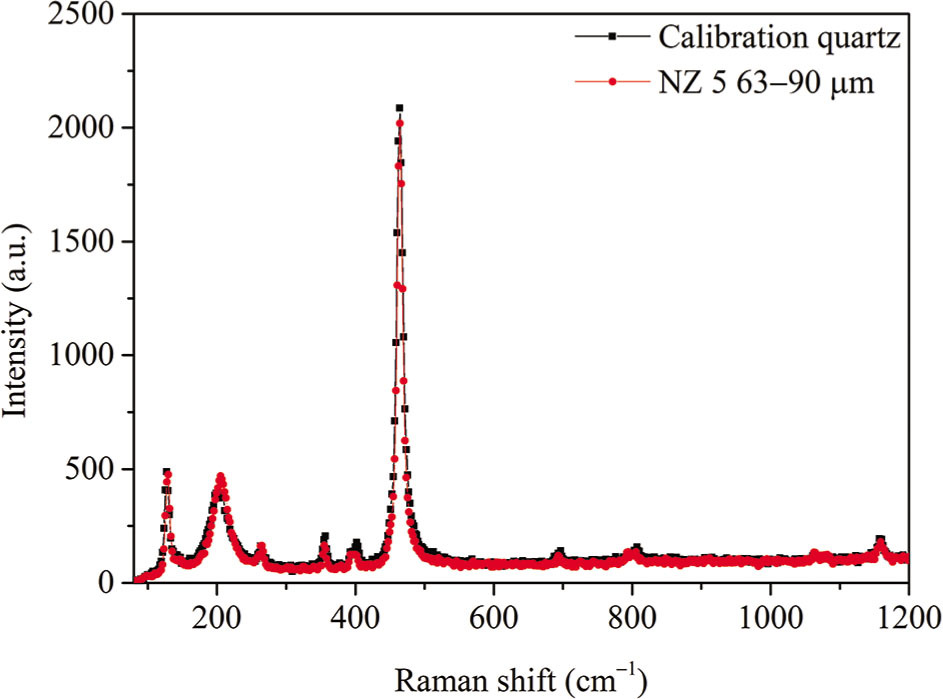
We have checked the purity of the quartz mineral extracts and their crystallinity by conducting RAMAN spectroscopy on sample NZ 5 63–90 μm. Fig. 2 compares the spectrum of the sample to that obtained on calibration quartz. The results confirm that our extracted material is indeed crystalline quartz, according to the characteristic sharp bands observed in all the recorded spectra, similar to the quartz calibration sample. The 15 bands—observed in the Raman spectra recorded with minimal acquisition time (1s) and 1 accumulation—resembled those observed by Krishnan since early Raman studies on quartz that were published (Krishnan, 1945). The observed bands from microcrystals are located at 128 (s), 206 (s), 265 (m), 356 (m), 394 (m), 404 (m), 452 (sh), 464 (vs), 696 (m), 793 (w), 804 (w), 1063 (w), 1082 (w), 1160 (m) and 1230 cm−1 (w).
Fig 2
Comparison of calibration quartz (filled squares) RAMAN spectra with that of the 63–90 μm quartz (filled circles) extracted from sample NZ5.
To check if the quartz extracted from the investigated samples is suitable for OSL dating, the SAR-OSL protocol labelled in Table S1A in Supplementary Material was applied. Fig. 3A shows a typical OSL decay curve for the natural signal, while in Fig. 3B, the decay of the signal measured after a regenerative dose of 100 Gy is compared to that of calibration quartz. Based on the comparison to calibration quartz, it can be observed that the fast component does exist in the OSL signal. However, its intensity is very weak. All investigated grain sizes displayed low sensitivity, with no more than 1500 cts recorded in the first 1.2 s of stimulation in the case of the natural signal (see Table S2 in Supplementary Material). A weak signal could result in obtaining an equivalent dose of low precision, but it should not affect the accuracy of the result. As the signals were found to be above the detection limit, we have attempted to apply the SAR protocol to the various grain sizes of quartz that were available. However, significant sensitivity changes were observed to occur. The response to the administered test dose was found to vary significantly from one cycle to another, the response increasing significantly during measurement cycles as indicated by Fig. 3C. The SAR protocol is not able to correct for sensitivity changes and a well-defined dose response curve could not be constructed; an example of this can be observed in Fig. 3D. Consequently, equivalent doses could not be confidently determined using quartz SAROSL. Another important observation was made while recording the TL signals during the preheat procedures applied in the SAR protocol following laboratory given doses. Unlike the case of well-behaved OSL samples, where well-defined 110°C TL peaks are always observed, the TL signals recorded for these samples displayed weak 110°C TL peaks along with a second peak at 150°C. While the existence of the 150°C TL peak in quartz is well known (see e.g. Chruścińska et al., 1996, Veronese et al. 2004, Preusser et al., 2009) we have never identified it visually so far in samples that are displaying bright OSL signals due to the dominance of the 110°C TL peaks. Fig. 3E presents such a typical example for quartz from New Zealand for a heating rate of 5°C/s.
Fig 3
Representative luminescence behaviour of 63–90 μm quartz extracted from sample NZ 3. (A) the decay curve of natural continuous-wave optically stimulated luminescence (CW-OSL) signal (open squares); (B) comparison between the decay curve of a regenerated dose of 100 Gy (open circles) and the typical decay curve of a calibration quartz (open triangles); data is normalised to the number of counts collected in the first channel of stimulation; (C) variation of the Tx/Tn ratio during SAR cycles; (D) representative sensitivity-corrected dose response curve. The sensitivity corrected natural signal is depicted as a star. Recycling and IR depletion points are represented as an upward triangle and inverse triangle, respectively; (E) TL signal recorded during the preheat to 220°C employed in a typical SAR cycle after irradiation with a regenerative dose of 100 Gy. SAR, single-aliquot regenerative-dose; TL, thermoluminescence.
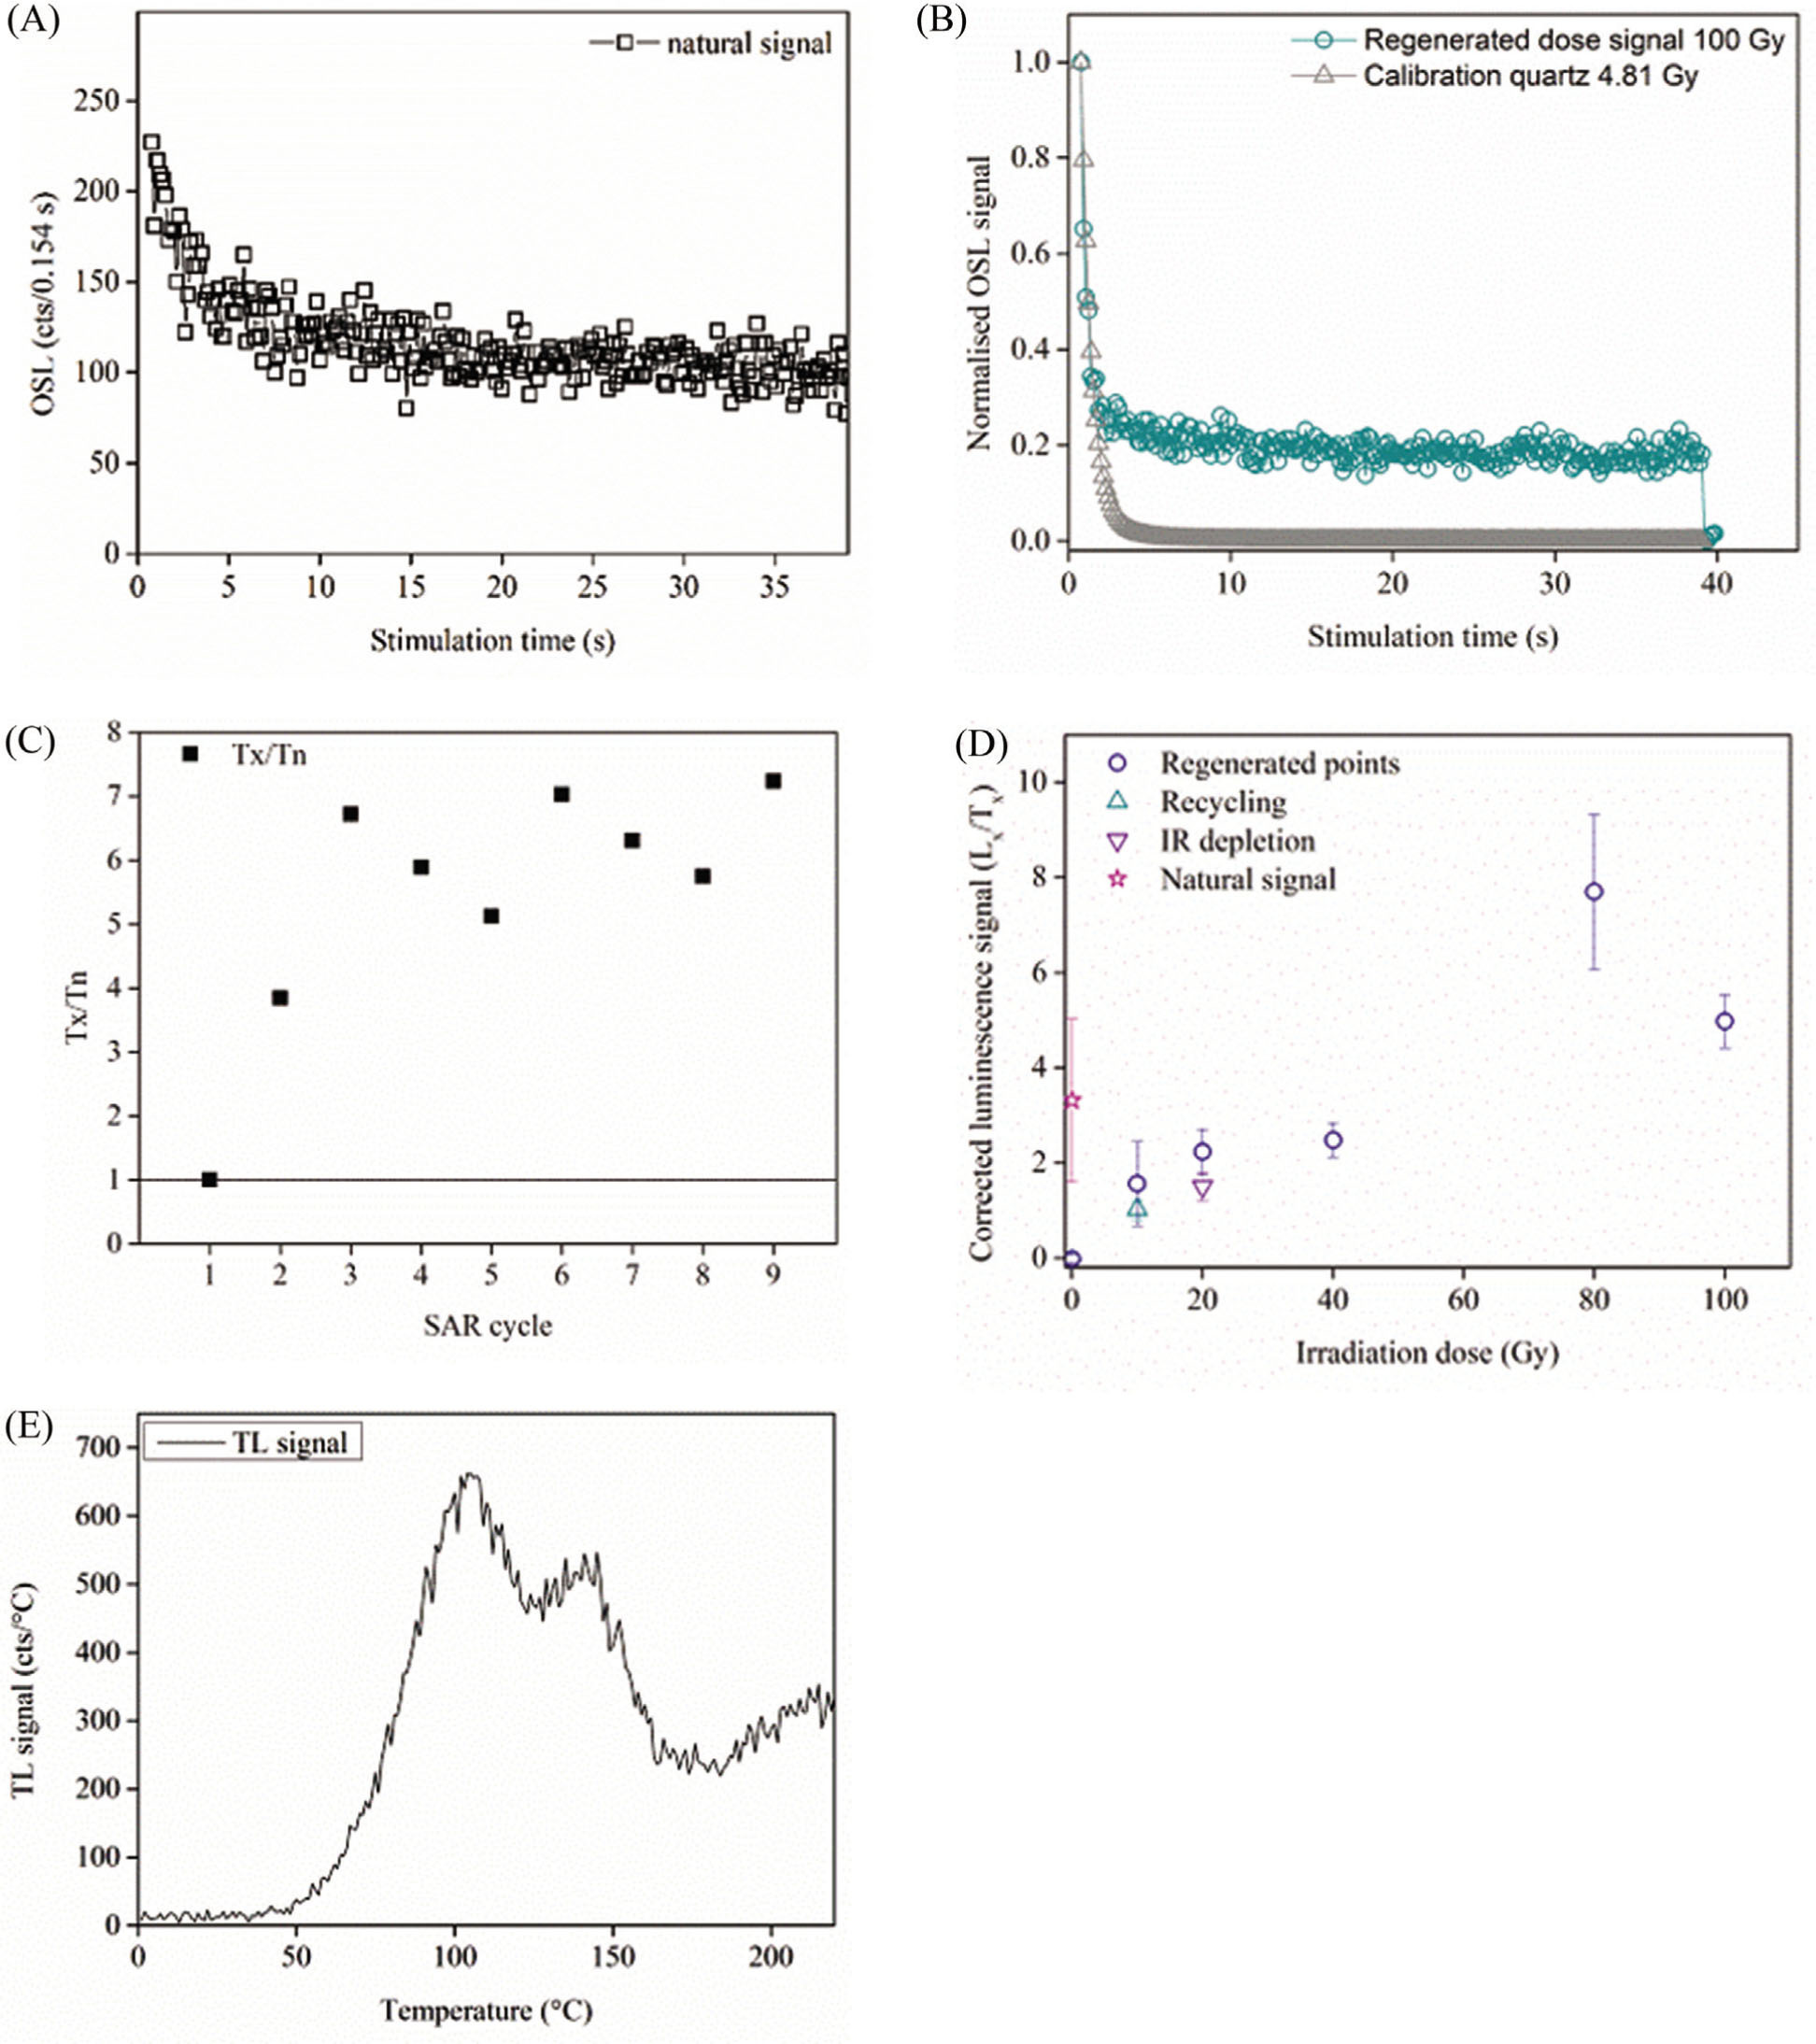
We have further tested the behaviour of sample NZ 3 63–90 μm quartz by performing a dose-recovery test. Three aliquots were bleached with blue diodes twice at room temperature for 100 s with a 10000 s pause in between the two stimulations. A dose of 100 Gy was then administered and measured as unknown, using the SAR protocol as described in Section 3.3. Table 1 summarises the results that were obtained. One can ascertain that an increase in sensitivity occurs and sensitivity changes are not properly corrected by the measurement protocol, as observed form recycling tests. This results in an unsatisfactory recovered-to-given dose ratio.
Table 1
Results of dose recovery tests on NZ 3 63–90 μm quartz.
The failure of the quartz from New Zealand to accurately measure a given dose in the SAR protocol, as well as its poor OSL sensitivity, have been previously reported by Preusser et al. (2006) for sedimentary quartz of metamorphic origin from the forefield of Franz Joseph Glacier in the western part of South Island. The above-mentioned study attributed this behaviour to the short sedimentary history of the grains, as it was reported that sensitisation of the OSL signal was achieved by repeated bleaching/irradiation cycles.
To test whether OSL properties of the samples investigated here can be improved by the application of different irradiation and stimulation steps, we have conducted a dose recovery test on sample NZ 3 63–90 μm under the same conditions as presented above, except that the whole procedure was carried out subsequent to the application of three different treatments:
(i) the repetition of 5 bleach (blue diodes stimulation for 100 s at room temperature)/dose (100 Gy) cycles,
(ii) irradiating the sample with a dose of 100 Gy followed by heating to 500°C five times and
(iii) simply by repeating five times the heat treatment that consistied of a ramp heating to 500°C. The results of the dose recovery test performed following these treatments are presented in Table 2.
Table 2
Results of dose recovery tests after repeated cycles of bleaching and irradiation and heating and irradiation.
Contrary to the findings of Preusser et al. (2006), we have not observed an increase in sensitivity or an improvement in the results of the dose recovery test – in other words, a better behaviour of the material in the SAR protocol in accordance with the following treatment, namely (i) the application of repeated bleach/dose cycles. However, the sensitivity is increased by one order of magnitude following dosing and annealing, with the heat treatment accounting for most of the effect, as can be seen from the results of experiment (ii) where irradiations have not been carried out. Following the application of the annealing to 500°C, the behaviour of the OSL signals in the SAR protocol is improved, with satisfactory recycling and dose recovery tests results (Table 2).
Another important observation is that significant sensitisation of the 110°C TL signals was observed following annealing to 500°C (Fig. S1 and Fig. S2 in Supplementary Material). During experiment (ii) presented above, it was observed that, while the 110°C peak is weak in intensity during the first TL recorded (Fig. S2A in Supplementary Material), once the sample was heated to 500°C, the TL glow-curve shape changes dramatically. In the second TL/dose measurement cycle the 110°C, the TL peak is well represented, and the glow curve is repetitive during subsequent irradiation read-out steps in the annealing process (Fig. S2B in Supplementary Material). In the case of the dose recovery test without previous annealing, a composite 110–150°C peak is observed in the low temperature region during the preheat of the signals (Fig. S2C in Supplementary Material), and the OSL signals are weak in intensity (Fig. S2E in Supplementary Material). If the sample is annealed to 500°C before the dose recovery test, the OSL signals increase by one order of magnitude (Fig. S2F in Supplementary Material) and so does the 110°C TL peak (Fig. S2D in Supplementary Material). Annealing the sample to 500°C results in the sensitisation of both the 110°C TL peak as well as the OSL fast component. While the heat treatment is making the quartz signal comparable to that employed in standard OSL dating, the annealing removes the desirable natural signal, precluding successful dating of the material.
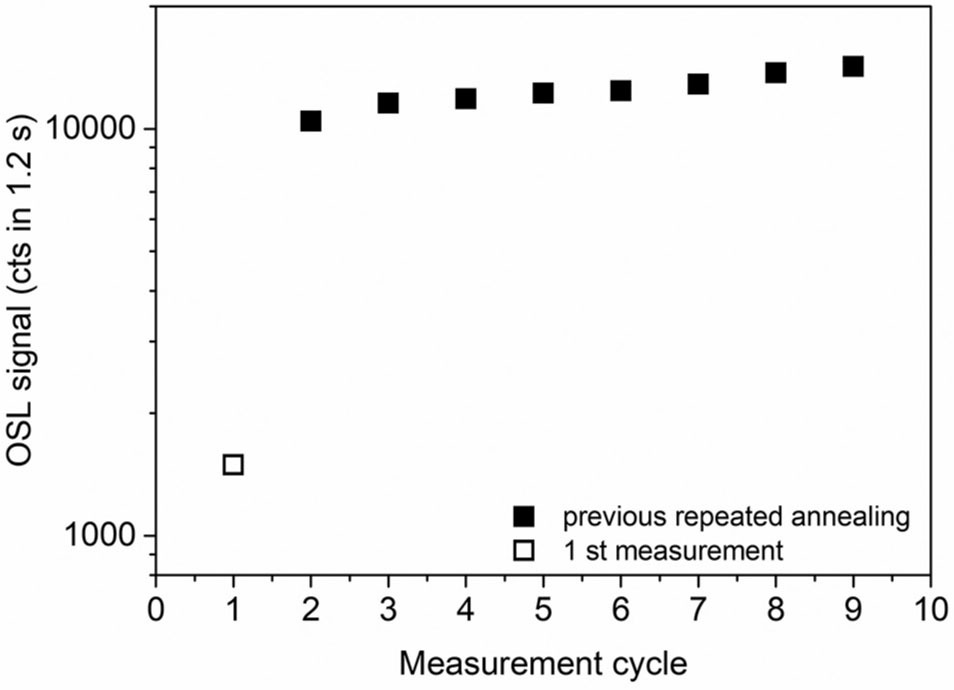
The effect of repeating the annealing cycles on the OSL signal is shown in Fig. 4 for the response of sample NZ 3 63–90 μm quartz to a dose of 100 Gy. The sample was bleached (room-temperature blue-diode stimulation for 100 s, pause of 10000 s, room-temperature blue-diode stimulation for 100 s) and then subjected repeatedly to the following measurement cycle: irradiation (100 Gy), preheat for 10 s to 220°C, OSL measurement (blue diode stimulation at 125°C), annealing (TL measurement) to 500°C. Data presented in Fig. 4 show that the first thermal treatment enhances the sensitivity by one order of magnitude and subsequent annealing treatments do not have a further significant effect.
Fig 4
The OSL signal sensitisation after repeated annealing to 500°C. The luminescence signal intensities were measured after an irradiation to 100 Gy and a preheat to 220°C for 10 s. The OSL signal recorded before the first annealing is presented as an open square whereas the luminescence signals recorded following repeated annealing irradiation cycles are represented as solid squares. OSL, optically stimulated luminescence.
The effect of varying the annealing temperature was tested, as well. Aliquots of sample NZ 3 63–90 μm quartz were bleached and subjected to the following measurement steps: irradiation with 100 Gy, preheat for 10 s at 220°C, OSL measurement (for 40 s at 125°C), anneal to Ta (ramp heating to a temperature between 225°C and 525°C), irradiation with 100 Gy, preheat for 10 s at 220°C, OSL measurement (for 40 s at 125°C). The OSL response after annealing can be compared to the OSL response before the application of the thermal treatment. This was carried out on three aliquots for each anneal temperature employed and the results of the average ratio between the post annealing and pre-annealing signals are presented in Fig. 5.
Fig 5
Sensitivity increase of the OSL signal as function of the annealing temperature. The dotted line represents an exponential dependence. OSL, optically stimulated luminescence.
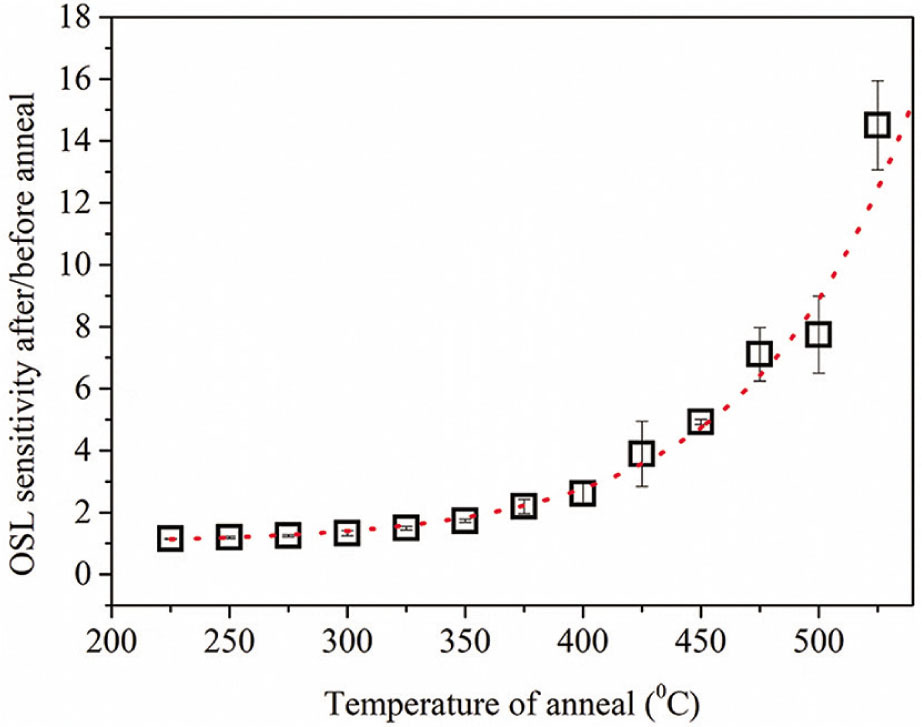
An exponential increase is reported as a function of annealing temperature, significant sensitisation occurring for heating temperatures above ≅350°C. This sensitisation with heating is intriguing, given the fact that the quartz analysed should have an important metamorphic (sub-greenschist) component from the Eastern greywacke basement rocks. For this reason, the crystal should have been subjected to moderate heating 300–100 Ma. Poor OSL properties of metamorphic quartz were also reported by Guralnik et al., 2015, with the authors inferring that only samples from a low-grade metamorphic context (heated to less than ≅380°C) are displaying satisfactory OSL properties.
Sensitisation by heating, and not due to pre-dose activation, was previously reported to occur in partially fired (i.e. annealed only to moderate temperatures) quartz (Yang and McKeever, 1990; Bøtter-Jensen et al., 1995). However, a physical mechanism was not proposed as it was concluded that it is not possible to distinguish between a model that calls for the creation of luminescence centres or one that calls for the removal of non-luminescence centres due to annealing (Bøtter-Jensen et al., 1995). In a later multi spectroscopic study, Schilles et al., 2001 concluded that luminescence is generally sensitised in quartz by heating to 500°C or more by the removal of oxygen vacancy E`centres, which is considered as a luminescence competitor. This mechanism cannot account for the observations made here, as sensitisation is observed also in the 300–400°C temperature range, where a heat treatment following irradiation is known to increase the intensity of E`centres (see e.g. Toyoda and Hattori, 2000).
The dependency presented is suggestive not only of the thermal activation curves presented by Yang and McKeever (1990) for their as-received Arkansas quartz, but also of the annealing temperature dependence of the C band (3.4 eV) for radioluminescence signals reported by Martini et al. (2014) for natural quartz. Consequently, the results presented indicate that the heating process is most likely affecting the luminescence pathway and not the trapping process, by the creation of recombination centres. Investigations for gaining further understanding on these matters by employing electron spin resonance measurements are currently underway.
. Luminescence Properties – Polymineral Grains
. Equivalent doses
Unlike OSL signals of quartz, the IRSL signals of polymineral fine grains displayed a satisfactory behaviour in the SAR protocol. Equivalent doses were obtained by interpolating the natural sensitivity corrected luminescence signal on the dose response curve constructed for each sample using both pIRIR protocols. Fig. 6 shows a representative growth curve for sample NZ 4 using pIRIR225 (Fig. 6A) and the pIRIR290 (Fig. 6B) protocols, respectively. The insets of Fig. 6 present the comparison of decay curves of the natural signals to those measured following regenerative doses.
Fig 6
Representative sensitivity-corrected dose-response curves constructed for one aliquot from sample NZ 4 on polymineral fine (4–11 μm) grains using (A) pIRIR225 and (B) pIRIR290 protocol. The sensitivity corrected natural signals are depicted as stars interpolated on the dose response curves for indicating the equivalent doses. The recycling point is represented as an inverse triangle. Insets show typical decay curves of natural CW-OSL signals (open squares) in comparison to a regenerated signals (open circles) induced by a beta dose approximately equal to the equivalent dose. pIRIR, post-infrared–infrared protocol.
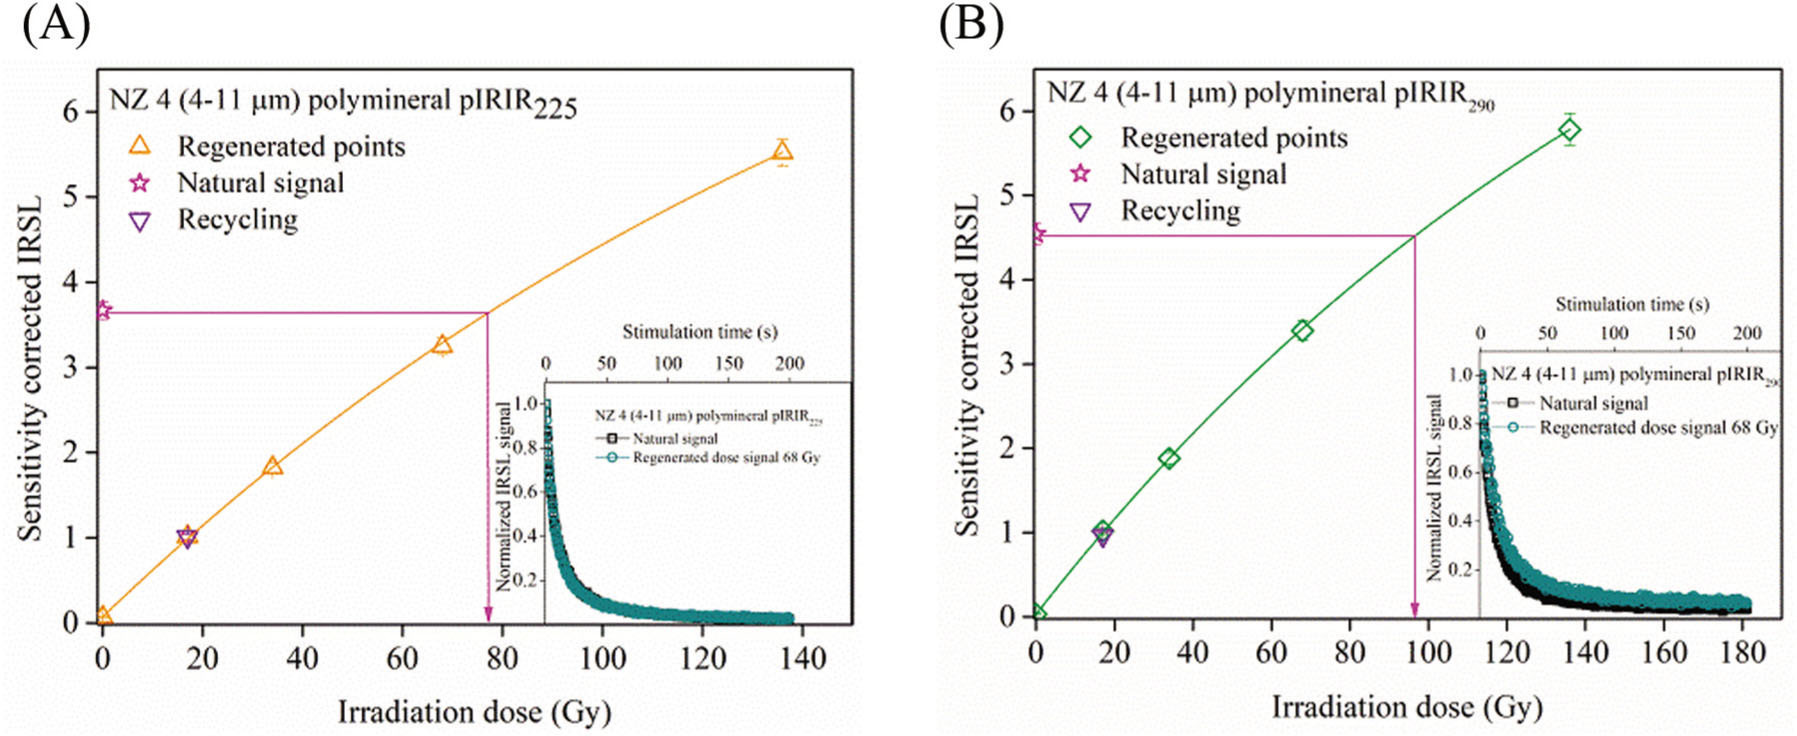
The dose response curves were best fitted by a sum of two saturating exponential functions. The values for the equivalent doses range from 64 ± 2 Gy to 92 ± 23 Gy in the case of pIRIR225 protocol and from 83 ± 3 Gy to 120 ± 6 Gy in the case of pIRIR290 protocol, respectively. The measured equivalent doses along with the results of recycling and recuperation tests for each sample are shown in Table S3 in Supplementary Material.
. Residual signals
It is well known that the post-IR IRSL signals are difficult to bleach, as residual doses of a few grays have been reported even after prolonged exposure to daylight or light in a solar simulator (e.g Buylaert et al., 2011b, 2012; Stevens et al., 2011; Murray et al., 2012, 2014; Yi et al., 2016, 2018; Sohbati et al., 2016; Veres et al., 2018; Avram et al., 2020). Also, by measuring samples of modern dust and samples with an equivalent dose <1 Gy collected from Chinese Loess Plateau, Buylaert et al. (2011b) have reported a residual average dose of 4 Gy for pIRIR225 protocol and 11 Gy when using the pIRIR290 protocol.
To quantify residual values, four fresh aliquots from each sample were exposed to window for 30 days to remove the natural signal and quantify the residual level. Residual doses measured using the pIRIR225 protocol range from 3.3 ± 0.4 Gy to 3.7 ± 0.3 Gy, while the values obtained using the pIRIR290 protocol are from 4.1 ± 0.6 Gy to 13.6 ± 2.5 Gy. The values obtained on each sample are presented in Table S4 in Supplementary Material and plotted against the measured equivalent dose in Fig. S3 in Supplementary Material.
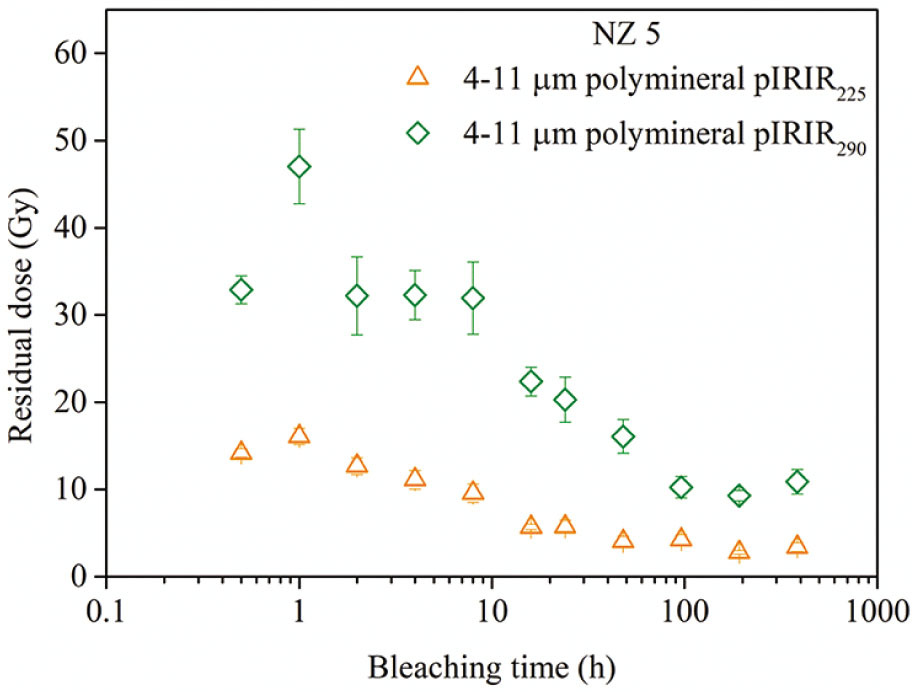
To check whether this is indeed the minimum residual level that can be achieved as function of exposure time, sets of five fresh aliquots of sample NZ5 were exposed to window light for different periods of time (from 0.5 h to 192 h). The results are shown in Fig. 7. In the case of pIRIR225 protocol, a constant residual dose of 3.7 ± 0.5 Gy is achieved after 48 h of exposure, while in the case of the pIRIR290, signals’ residual values reach a constant value of 9.8 ± 0.5 Gy only after a bleaching time of 96 h. These results are in line with the values obtained for the 30-day-experiment.
Fig 7
Residual doses measured using pIRIR225 (upward triangle) and pIRIR290 (diamond) after different bleaching times. The natural signal was bleached under natural conditions under window light. The shortest bleaching time was 0.5 h while the longest was 192 h. pIRIR, post-infrared–infrared protocol.
Several studies have reported that the magnitude of the residual dose is dependent on the equivalent dose (e.g. Sohbati et al., 2012; Buylaert et al., 2012, Yi et al., 2016), suggesting a possible dose dependency of the residual. For the different samples investigated here, the residual doses measured after 30 days of exposure do not differ significantly (Table S4 in Supplementary Material) and neither do the equivalent doses. To investigate whether the residual signal is dose dependent, eight bleached aliquots of samples NZ2, NZ3 and NZ 4 were irradiated with different beta doses of 400 Gy, 800 Gy and 1600 Gy and subsequently exposed to windowlight. After an exposure of 30 days, four aliquots from each sample were measured using pIRIR225 protocol, whereas for the other four aliquots, the pIRIR290 protocol was used. The results are displayed in Fig. 8. An increase of the residual dose with the size of the previously given dose can be observed in the case of both pIRIR225 and pIRIR290 protocols. The magnitude of the residuals range from 5.9 ± 0.7 Gy (for a dose of 400 Gy) to 8.9 ± 1 Gy (for a dose of 1600 Gy) in the case of pIRIR225 and from 13.9 ± 1.2 Gy (for a dose of 400 Gy) to 18.5 ± 1.7 Gy (for a dose of 1600 Gy) in the case of pIRIR290, respectively.
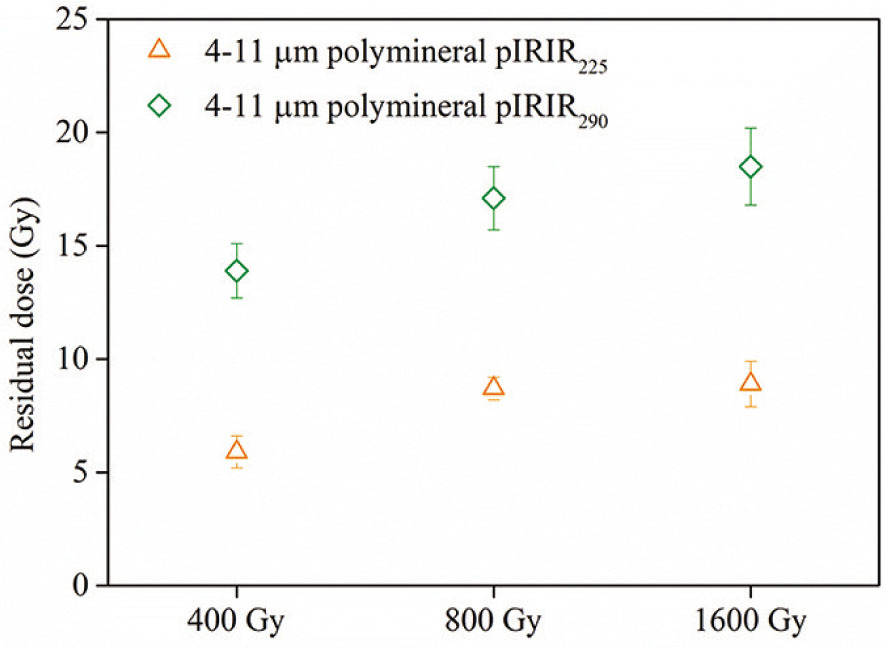
We compare the data obtained for 1600 Gy (8.9 ± 1 Gy for pIRIR225 and 18.5 ± 1.7 Gy for pIRIR290) to the values obtained in the bleaching experiment for the natural signals (corresponding to a measured equivalent dose of ≅60–120 Gy), namely average values on all samples of 3.5 ± 0.2 Gy for pIRIR225 and 9.2 ± 2.0 Gy for pIRIR290, respectively. We conclude that (i) different doses accrued by the mineral grain before the bleaching event should not result in dramatically different residual doses and (ii) performing bleaching experiments on natural samples instead of using a modern analogue should not result in an offset of more than a few Grays. Bleaching corrections should not cause significant inaccuracies unless very young samples are dated. However, since a dose dependence is reported, and since it remains questionable whether the conditions in the laboratory fully reproduce the bleaching process in nature, it is advisable to measure a modern analogue for residual dose estimation, as well. Here, a modern sample was collected from a nearby site (latitude 44.014973° S, longitude 171.891569° E). Following the same methodology, an equivalent dose of 7.5 ± 0.5 Gy was measured using pIRIR225 protocol; on the other hand, using pIRIR290 protocol, a dose of 22.8 ± 1.5 Gy was obtained. Based on the results of the laboratory experiments presented above, we consider these residual doses as maximum values. We have chosen to perform residual corrections using both laboratory obtained values, as well as by the modern analogue approach (Table 3).
Uncertainties were determined following Aitken and Alldred (1972). A 15% water content was assumed with a relative error of 25%. Errors quoted on equivalent doses and specific activities represent random uncertainties. The uncertainties quoted for the ages represent total (random and systematic) errors computed in quadrature. pRIR, post-infrared–infrared protocols.
. Dose recovery
To further check the reliability of the measurement protocol, a dose recovery test (Murray, 1996; Wallinga et al., 2000) was performed on five aliquots from each sample using both pIRIR protocols. The natural signal was bleached by exposing fresh aliquots to window for 1 month. The aliquots were subsequently irradiated with laboratory-known doses, chosen to approximate the measured equivalent dose. The dose recovery ratios were obtained by dividing the measured recovered dose by the value of the given dose. The measured residual doses were subtracted from the recovered dose prior to dose recovery ratio calculation. The results of the dose recovery tests using pIRIR225 and pIRIR290 protocols, respectively, are shown in Fig. 9.
Fig 9
Dose recovery test results for polymineral fine grains using pIRIR225 (open triangles) and pIRIR290 (open diamonds) protocols. The given irradiation dose was chosen to match the equivalent dose of each sample. The solid line indicates the ideal 1:1 dose-recovery ratio while the dashed lines bracket a 10% variation from unity.
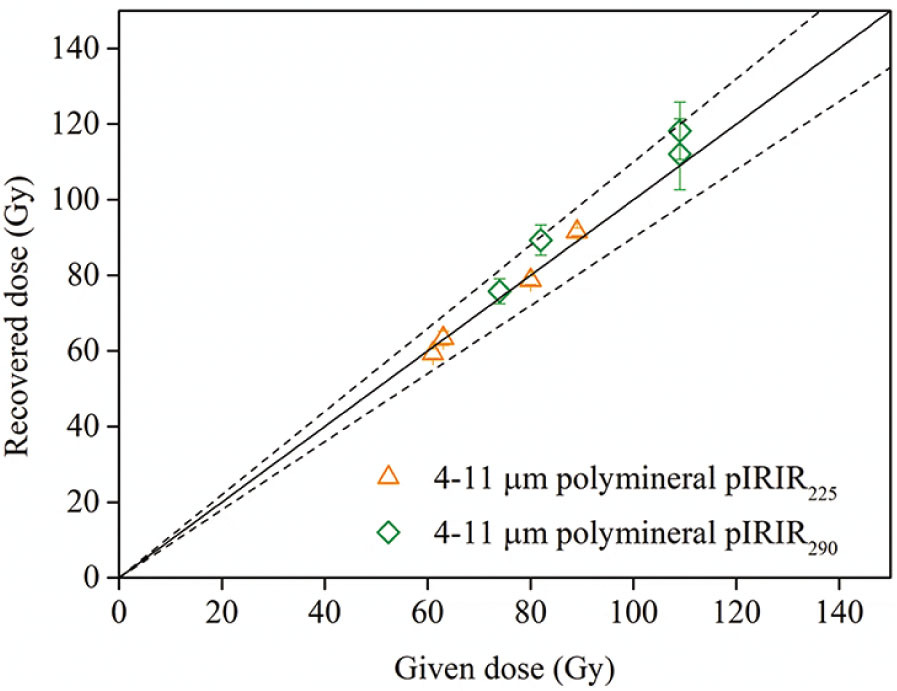
Dose recovery ratios obtained for the pIRIR225 protocol range from 0.97 ± 0.02 (NZ 2) to 1.03 ± 0.01 (NZ 5), while for pIRIR290 they range from 1.02 ± 0.04 (NZ 2) to 1.09 ± 0.05 (NZ 3), suggesting that both pIRIR225 and pIRIR290 protocols can successfully recover the laboratory doses given.
. Anomalous fading tests
The greatest disadvantage of using feldspars as luminescence dosimeters is the loss of the signal during burial time. This loss of the signal is known as anomalous fading and can be usually quantified in terms of fading rates (percentage of the signal lost per decade; Aitken, 1985). Thiel et al. (2011) have reported for the first time a natural pIRIR290 signal in saturation for a sample collected below the B/M boundary and concluded that pIRIR290 signal is a stable signal and the pIRIR290-ages do not need any further fading correction. Similar observations have been made by other researchers for pIRIR290 protocol on both polymineral fine grains and K-feldspars (e.g. Buylaert et al., 2011b; Thomsen et al., 2011; Veres et al., 2018; Avram et al., 2020). Based on laboratory fading experiments, other studies reported fading rates of <1%/decade for pIRIR290 (e.g. Thiel et al., 2011; Stevens et al., 2011; Murray et al., 2014; Balescu et al., 2020) and suggested that such low values are laboratory artefacts and do not reflect the instability of the signal in natural conditions (e.g. Thiel et al., 2011; Buylaert et al., 2012; Avram et al., 2020). Similar low fading rates have been reported on K-feldspars extracted from palaeo-rockfall boulders and loess from Banks Peninsula, South Island, New Zealand (Sohbati et al., 2016).
On the other hand, in the case of pIRIR225 signals, it remains debatable whether the signals are affected by fading. Some studies reported g-values >1%/decade (Buylaert et al., 2009; Zhang et al., 2018) while other works reported fading rates of <1%/decade (Vasiliniuc et al., 2012; Avram et al., 2020). Therefore, the stability of the pIRIR225 signal was checked by an anomalous fading test performed on three 4–11 μm polymineral fine grain aliquots of samples NZ 2, NZ 4 and NZ 5 (Table S5 in Supplementary Material). The fading measurements were carried out on the same aliquots previously used in the dose recovery test. Each 4–11 μm polymineral aliquot was irradiated with a beta dose of 100 Gy. A test dose of 17 Gy was used. Four consecutive prompt reads-out were carried out prior to storage. The aliquots were preheated before storage. The maximum time delay was 38 days (912 h). Three consecutive prompt measurements were employed after the read-out corresponding to the longest storage time (Fig. S4 in Supplementary Material presents individual results obtained on all aliquots). A fading rate <1%/decade was obtained for sample NZ 2 and NZ 5, while for sample NZ 4 a g-value of 2.28 ± 0.44%/decade was obtained. Therefore, the pIRIR225- and pIRIR290-ages presented in this study are not corrected for fading, except for sample NZ 4, for which a fading correction using the R Luminescence-package (Dietze et al., 2013) according to Huntley and Lamothe (2001) method was carried out.
. Luminescence Ages
Luminescence ages obtained based on pIRIR protocols—along with the dosimetry information—are presented in Table 3.
Table 3
Summary of the pIRIR225 and pIRIR290 ages.
| Sample code | Depth (cm) | ED (Gy) | Specific activities (Bq/kg) | Total dose rate (Gy ka−1) | Ages (ka) (1) | Ages (ka) (2) | |||||
|---|---|---|---|---|---|---|---|---|---|---|---|
| pIRIR225 pfg | pIRIR290 pfg | K-40 | Ra-226 | Th-232 | pIRIR225/290 pfg | pIRIR225 pfg | pIRIR290 pfg | pIRIR225 pfg | pIRIR290pfg | ||
| NZ 2 | 30 | 57 ± 2 | 60 ± 4 | 635 ± 17 | 36 ± 1 | 39 ± 1 | 4.2 ± 0.1 | 14 ± 1 | 14 ± 1 | 15 ± 1 | 18 ± 2 |
| NZ 3 | 50 | 59 ± 2 | 63 ± 4 | 607 ± 17 | 27 ± 2 | 24 ± 1 | 3.4 ± 0.1 | 17 ± 1 | 18 ± 2 | 18 ± 2 | 24 ± 2 |
| NZ 4 | 70 | 76 ± 3 | 100 ± 7 | 599 ± 16 | 26 ± 1 | 27 ± 1 | 3.4 ± 0.1 | 25 ± 2(*) | 29 ± 3 | 26 ± 2(*) | 32 ± 3 |
| NZ 5 | 140 | 85 ± 3 | 91 ± 6 | 604 ± 16 | 35 ± 1 | 37 ± 2 | 4.0 ± 0.1 | 22 ± 2 | 25 ± 3 | 23 ± 2 | 28 ± 3 |
Only the ages obtained by residual dose correction using the modern analogue technique are represented as function of depth in Fig. 10. The pIRIR225-ages range from 14 ± 1 ka to 25 ± 2 ka; on the other hand, the pIRIR290-ages are slightly higher than pIRIR225-ages, but still in agreement within errors for all samples. The pIRIR290-ages vary between 14 ± 1 ka and 29 ± 3 ka.
Fig 10
pIRIR225 (open triangles) and pIRIR290 (open diamonds) luminescence-ages plotted as function of depth. pIRIR, post-infrared–infrared protocols.
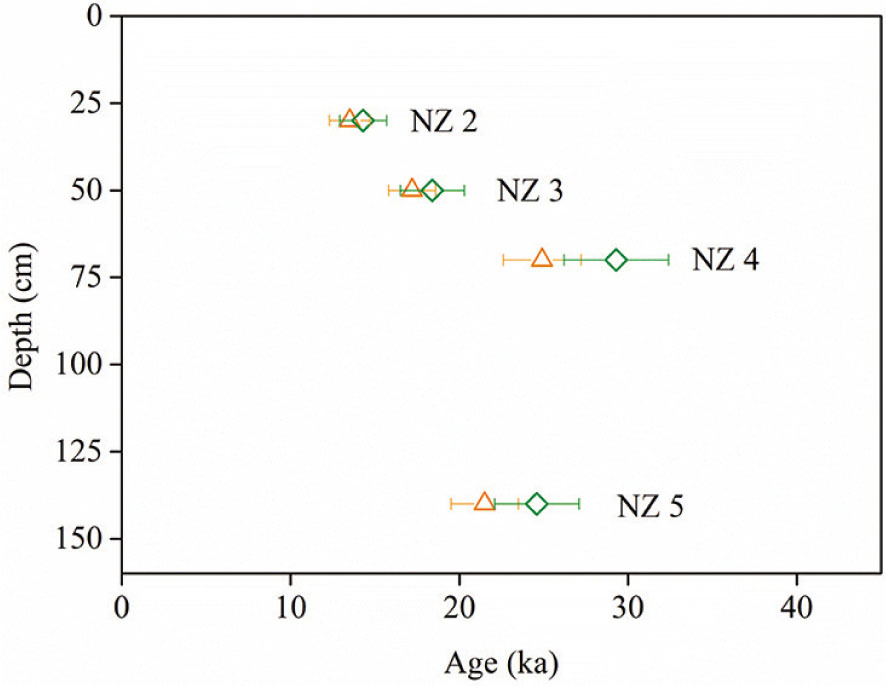
The pIRIR-ages increase down-section, except for an age reversal between the sample NZ 4 and NZ 5. Such age reversals have been previously reported by others in the Canterbury region (e.g. Berger et al., 2001; Almond et al., 2007; Rowan et al., 2012). The ages suggest that loess from this site was deposited during the last glacial maximum of the Otira glaciation that occurred during 18–24 ka (Alloway et al., 2007).
. Summary and Conclusions
The difficulty of obtaining reliable luminescence chronologies for loess in New Zealand South Island is well known. In this context, the applicability of SAR-OSL protocol on quartz as well as the feldspar-SAR–based pIRIR225 and pIRIR290 protocols on polymineral fine grains was investigated on four loess samples collected from the Southern Canterbury Plains. Although the purity and crystallinity of quartz extracts was confirmed by RAMAN spectroscopy, OSL signals displayed low sensitivity and significant sensitivity-change during the measurement cycles. It was shown that sensitisation of the OSL signal as well as that of the 110°C TL peak could be achieved by annealing in the 300–500°C range, likely by the activation of luminescence centres. However, the same effect could not be achieved by repeated irradiation and bleaching cycles as previously suggested. While equivalent doses could not be securely obtained using quartz, the application of pIRIR225 and pIRIR290 methods were successful in achieving the following outcomes, namely: (i) dose recovery tests resulted in satisfactory results for both these protocols, results being consistent to unity at a 95% confidence level; (ii) fading rates of pIRIR225 signals were generally negligible, with measured values of less than 1%; (iii) although pIRIR290 signals are more difficult to bleach than pIRIR225 signals, constant residual values of ≅4 and ≅10 Gy were achieved after exposure under window light exposure for 48 h in the case of pIRIR225 and 96 h in the case of pIRIR290 signals, respectively; and (iv) a dependence of the residual on the previous given dose was observed; however, for a dose as large as 1600 Gy, the residuals obtained for the two methods are ≅9 and ≅19 Gy, respectively. Thus, the equivalent dose of the sample used in the bleaching experiment should not have a significant effect when the residual dose is determined by laboratory experiments. The ages obtained by the application of the two pIRIR protocols are generally in agreement, with values ranging from 14 ± 1 ka to 29 ± 3 ka, suggesting that loess from the investigated site was deposited during the last glacial maximum.