
. Introduction
One of the fundamental assumptions behind luminescence dating is that the luminescence phenomenon generated by natural ionising radiation in minerals used for dating can be effectively reproduced under laboratory conditions using artificial irradiation. Laboratory dosing, by following different protocols, enables the generation of a dose-response function, essential for determining the laboratory equivalent of the naturally absorbed dose. Due to several reasons, such as the size of mineral grains usually used, the range of ionising radiation, the homogeneity and low ionisation density of the radiation field and considering radiation safety issues, most commonly β-sources are utilised in routine thermoluminescence dating (TL)/optically stimulated luminescence (OSL) analysis (Aitken, 1985a; Bøtter-Jensen et al., 2000; Richter et al., 2012, 2013, 2015).
The only condition that has to be met during the use of a β-source for luminescence dating is the removal of the 20–30 μm outer shell of grains by means of chemical etching to exclude the α-contribution to the naturally generated luminescence signal (Fleming, 1979). Though, when preparing and dating coarse grain K-feldspars, this step is sometimes omitted (see e.g. Buechi et al., 2017 or Gao et al., 2020), usually in fear of losing the sample during the process. Nevertheless, etching is desirable because unlike β- or γ-radiation the α-induced luminescence is not proportional to the energy deposited in the crystal lattice; therefore, it is not possible to reproduce the effect of environmental α-radiation by means of β- or γ-sources (Aitken, 1985a; Brennan and Lyons, 1989). In other words, the luminescence induced by α-particles is not a function of the dose they carry, as in the case of β- and γ-radiation, but rather the length of the α-track along which their energy is dissipated (Aitken, 1985a). In addition, the high ionisation density of α-particles causes saturation of electron traps along the α-track so that the majority of produced free electrons are lost for luminescence production. Therefore, especially at low doses, the same energy absorbed from α-radiation generates approximately an order of magnitude less luminescence than in the case of β- and γ-radiation (Aitken, 1985a; Mauz et al., 2006; Kreutzer et al., 2014).
In several applications where fine-grained (typically 4–11 μm) sediments or pottery are the subjects of the analyses, the α-contribution cannot be neglected, since the mean range of α-particles emitted by the isotopes in the 238U and 232Th decay series is up to 20–30 μm at a density of 2.64 g/cm3 (Fleming, 1979; Bell, 1980). This means that α-particles fully penetrate grains, and the chemical etching of grains is not an option to eliminate the problem of determining the sample- and stimulation-dependent scale of α-contribution. In these cases, it is necessary to measure the relationship between luminescence induced by α- and β-/γ-radiation, i.e. to quantify the relative efficiency of α-particles in luminescence production. Since it has been proved that the luminescence output generated by unit α-track length is almost the same for α-particles having at least 2 MeV on leaving the sample (Zimmerman, 1972; Aitken and Bowman, 1975), the so-called a-value approach is applied for the assessment of α-efficiency. An additional condition during the application of the a-value system is that the luminescence induced by unit β-/γ-energy is constant (i.e. linear dose-response) and also independent of the energy of the particle. In this sense, by applying known dose rate monoenergetic α- and β-/γ-irradiation sources of almost any kind, it is possible to determine the efficiency of α-radiation under natural conditions where α- and β-particles of variable energy participate in the generation of luminescence. Practically, the above-mentioned assumptions also mean that for quartz the a-value can be given as the ratio of luminescence intensity generated by the same dose of α- and β-irradiation (Aitken, 1985b).
To assess this ratio, besides the standard 90Sr/90Y β-source, most TL/OSL systems can be also equipped with a 241Am α-source (Singhvi and Aitken, 1978). A crucial point of a-value determination is, however, the calibration of these sources, i.e. the assessment of their dose rate. The calibration of β-sources and related errors has been addressed by several papers (Göksu et al., 1995; Kadereit and Kreutzer, 2013; Guérin and Valladas, 2014; Bos et al., 2006; Tribolo et al., 2019). Due to their advantageous properties concerning signal stability and measurement reproducibility, the calibration of β-sources is usually carried out by using either coarse grain (180–250 μm) or fine grain (4–11 μm) ‘calibration quartz’ (Hansen et al., 2015). Consequently, a considerable effort has been made to describe their luminescence characteristics (Hansen et al., 2018).
However, the calibration of α-sources can be more complicated. One approach is primary calibration—described by Zimmerman (1971) and then refined by Aitken and Bowman (1975). Primary calibration is based on the fact that track length can be calculated from the number of incident α-particles measured by a surface barrier detector. Based on a detailed description of Aitken (1985a), the procedure can be summarised as follows. Calibration starts with the irradiation of a fine grain phosphor sample in vacuum by a weak α-source, using a considerable separation (>5 cm) between source and sample to ensure that particles arrive perpendicularly to the sample. Then, the sample is replaced by an aperture and a surface barrier detector so the number of incident particles can be measured at the same geometry and irradiation time. After measuring the luminescence response of the phosphor to the delivered α-dose and determining track length per unit volume from the number of incident particles measured by the detector, it is possible to calculate the sensitivity of the phosphor to unit track length. By knowing this relationship, the total track length delivered to the same phosphor sample but placed among routine measurement parameters (usually stronger source or closer position) can be determined by measuring the luminescence response to the dose received for this second time. As the total track length deposited in identically mounted sample material can be taken rather constant, luminescence per unit track length becomes measurable in the case of unknown samples with the same geometry as well.
If the luminescence in response to unit β-dose is also determined, the a-value can be calculated using the formula given by Aitken and Bowman (1975):
where ξs is luminescence per unit α-track length, ν is the volume of the sample and χβ is luminescence per unit absorbed β-dose. The numerical factor in the equation is representing the energy loss of a 3.7 MeV α-particle in quartz (2.6 g/cm3) (Aitken, 1985b). By introducing a parameter termed source strength (S), which can be calculated from the activity of the source and source-sample distance, it is also possible to calculate the dose rate to the sample from the value of track length (Aitken, 1985a).Although the α-source calibration in terms of generated track length does not seem to be complicated by using the procedure above, it still requires special instrumentation as far as the flux of an α-source has to be measured (Ogata et al., 2017). Therefore, especially in the case of luminescence readers with built-in sources, it is more convenient to calibrate the system against a known dose rate α-source. In this case, luminescence generated per unit α-dose can be directly related to that generated by unit β-dose to determine the efficiency of α-radiation, similarly to the k-value system (Zimmerman, 1972). This type of cross-calibration requires either the plotting of dose points generated by the unknown and known sources on a joint dose-response curve or the performance of dose recovery measurements.
The previous approach was followed for cross-calibration by Richter et al. (2003) using a polymineral fine grain (4–11 μm) sample having a linear α-dose growth curve. They applied infrared stimulated luminescence (IRSL) stimulation and a multiple aliquot additive dose (MAAD) protocol where five dose points were generated by the source under calibration and plotted together with one known dose point of a primary source. A similar approach, using the multiple aliquot regeneration (MAR) protocol, is described in Schmidt et al. (2018), also in the case of polymineral samples and using IRSL. In the same paper, but for another α-source under calibration, a fine grain quartz sample and the single aliquot regeneration (SAR) protocol were applied by performing dose recovery measurements on aliquots irradiated by a source with primary calibration.
Consequently, there is no uniform way of cross-calibration at the moment. The main objective of the present paper is therefore to compare different α-source cross-calibration procedures, using both quartz and polymineral fine grain samples and testing both MAR and SAR protocols. In the meantime, an attempt is made to provide novel information concerning the α-dose-related luminescence characteristics of the RISØ calibration quartz, in hope that it can be applied later more widely in the cross-calibration of α-sources.
. Samples and instrumentation
For the cross-calibration, three samples were used. Two of the samples, OSZ1107 and OSZ1614, were previously subjected to luminescence dating at the Szeged Luminescence Dating Laboratory. The first one is an alluvial loess sample from Southern Vojvodina, the second is a silty floodplain sediment collected along the Tisza River. They were chosen partly because after the routine dating process an adequate amount of them remained and partly because they performed properly concerning tests on dose reproducibility, i.e. based on seven aliquots, their β-dose recovery ratio was 0.99 ± 0.01 and 1.02 ± 0.01, respectively, and they also met SAR criteria (recycling ratio: 1.03 ± 0.01 and 0.99 ± 0.01; recuperation 0.36 ± 0.04% and 1.11 ± 0.08%). Both samples were subjected to conventional sample preparation procedures (Aitken, 1998; Mauz et al., 2002; Sipos et al., 2016) at the Szeged Luminescence Dating Laboratory. The grain size fraction below 11 μm was separated using an Atterberg cylinder, the fraction above 4 μm by centrifuging (rpm: 500; time: 120 s). Both samples were treated with 10% HCl and H2O2 several times to remove carbonates and organic material. Sample OSZ1614 was left then polymineral, while in the case of sample OSZ1107, an additional 1-week H2SiF6 etching was applied to isolate the quartz fraction. Besides the two fluvial samples, a portion of the fine-grain RISØ calibration quartz (Batch, 108) was used in the procedure. The preparation of the calibration quartz is summarised in Hansen et al. (2015), who achieved the desired grain size (4–11 μm) by grinding <40 μm quartz extracts that were previously etched in HF. All three samples were deposited on aluminium discs (2 mg/disc) by acetone settling in the Szeged laboratory.
The calibration process was performed with two calibrated instruments situated in the Bayreuth Luminescence Dating Laboratory: a Littlemore 721/B type six-seater irradiation facility
Throughout the tests, optical stimulation was applied either using blue (470 nm) or IR (870 nm) LEDs (Bøtter-Jensen et al., 2010). Both RISØ readers are equipped with EMI 9235QB15 photomultipliers. Detection was made through either a U-340 filter (quartz) or the combination of BG39 and CN-7-59 filters (polymineral). The measurements were carried out by using MAR, SAR (Murray and Wintle, 2003) and post-IR IRSL (pIRIR) (Thomsen et al., 2008; Thiel et al., 2011) protocols. Acquired luminescence data were analysed using the software analyst (v.4.31.9; Duller, 2015). A 1.5% instrumental error was applied in general, and all errors were propagated through the calculations in a Gaussian manner.
. Experimental procedures
The cross-calibration was completed using three types of approaches. First, a MAR procedure was applied (Fig. 1A) on the quartz extract of sample OSZ1107 and the polymineral part of sample OSZ1614. Aliquots were bleached using a 2700 K Osram Duluxstar 24 W compact light for 24 h (Schmidt et al., 2018). After bleaching, two sets of aliquots were irradiated in Bayreuth with a 67 ± 6 Gy and a 104 ± 10 Gy α-dose, respectively, using the Littlemore irradiation facility. At Szeged, five sets of aliquots were irradiated with evenly increasing regeneration α-doses, applying zero dose in the case of the first set. Irradiation times roughly bracketing the Bayreuth α-doses were calculated by performing a β-dose recovery test in Szeged on quartz aliquots (sample OSZ1107) previously irradiated with an α-dose (Mauz et al., 2006) and assuming an a-value of 0.04 ± 0.02 (Rees-Jones, 1995). By multiplying this a-value with the measured equivalent β-dose, the α-dose administered per unit time, that is, the preliminary dose rate (0.05 ± 0.02 Gy/s) of the α-source in Szeged, was estimated.
Fig 1
Flowchart of procedures applied in the case of different cross-calibration approaches used in the study. (A) MAR measurements on α-irradiated aliquots from both laboratories. (B) α dose recovery of known α-doses using SAR. (C) α dose recovery of a known γ-dose using SAR. MAR, Multiple aliquot regeneration; SAR, Single aliquot regeneration.
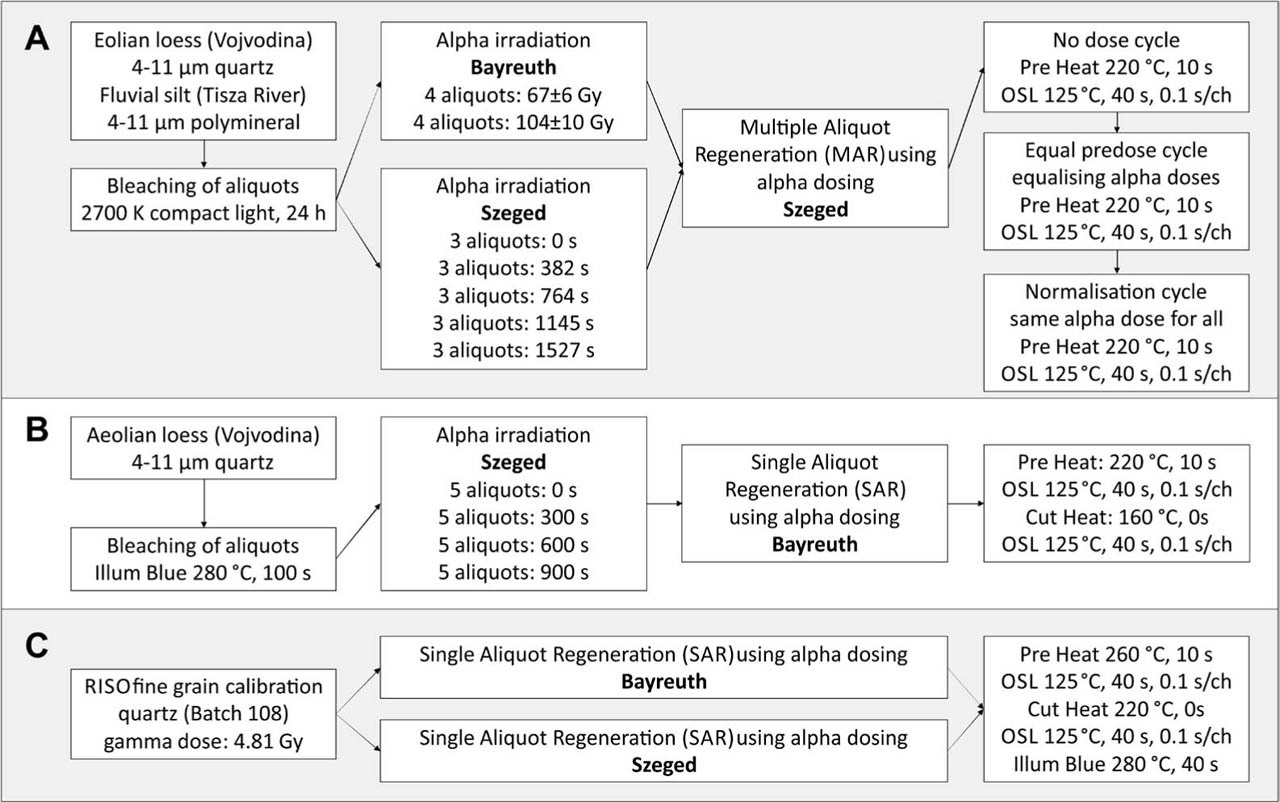
Following the irradiation of MAR doses, the OSL and pIRIR responses were measured in Szeged. In terms of the polymineral samples, a one-month delay was inserted in between the preheat and the subsequent pIRIR measurements to bring the aliquots irradiated in Bayreuth or Szeged to a similar level of fading. After OSL and pIRIR measurements, all aliquots were irradiated to equalise their radiation history (equal predose technique; Franklin and Hornyak, 1992) and bleached again. The sequence was closed by the third cycle of irradiation, but this time, an identical α-dose was administered to each aliquot to normalise the luminescence response of the first measurement (Fig. 1A).
The second approach (Fig. 1B) was applied only for sample OSZ1107. Bleaching, conducted in the same way as described above, was followed by α-irradiation in Szeged on four sets of aliquots, one receiving a zero dose this time as well. Irradiation times were in the range of those used for the MAR measurements. Aliquots were then subjected to a SAR measurement on the Bayreuth RISØ reader applying the built-in α-source for irradiating both regeneration and test doses. Preheat (220°C) and cutheat (160°C) temperatures were set based on the tests made during the routine dating of the sample.
The third type of calibration also applied SAR dose recovery measurements (Fig. 1C), but this time a 4.81 ± 0.14 Gy γ-dose administered to the RISØ fine-grain calibration quartz by a 137Cs point source at the Danish State Institute for Radiation Hygiene [more details on the source and irradiation procedure in Hansen et al. (2015)] was recovered on both the Bayreuth and the Szeged RISØ reader using their built-in α-sources. Preheat and cutheat temperatures indicated in Hansen et al. (2015) were used throughout the test.
. Results of the different cross-calibration procedures
By performing the cross-calibration tests, the dose rate of the α-source at the Szeged Luminescence dating laboratory was evaluated finally in five ways: (1) quartz MAR (sample 1107); (2) polymineral MAR using pIRIR50,290 first temperature (sample 1614); (3) polymineral MAR using pIRIR50,290 second temperature (sample 1614); (4) α-SAR dose recovery of α-doses (sample 1107) and (5) α-SAR dose recovery of a γ-dose (RISØ Batch 108).
The dose-response curves of MAR measurements are shown in Fig. 2. The relative error of normalised luminescence responses, calculated as the standard error (SE) of three measurements, was the lowest in the case of the quartz sample with a mean value of 2.9%. The scatter of normalised intensities was higher in the case of pIRIR measurements, that is, the mean relative SE was 8.5 and 4.7% concerning IR50 and IR290 data, and if the residual was subtracted from the intensities, relative SEs reached up to 38 and 41%, respectively. Nevertheless, even in the case of the polymineral MAR measurements, linear dose-response curves with high R2 values could be fitted to the dose points (Fig. 2B and C). As expected, the residual dose after bleaching was low in the case of the quartz and much higher in the case of the polymineral sample. Not surprisingly, the pIRIR290 intensity change in response to increasing doses was low; however, the sensitivity of the quartz sample was remarkably high in comparison to the IR50 sensitivity of the polymineral sample. Hence, higher sensitivity presumably contributed to the low scatter of errors in the case of sample 1107. The issue of sensitivity also affected the scatter of intensity values received in response to the doses administered by the Littlemore irradiation facility in Bayreuth (Fig. 2).
Fig 2
MAR dose-response curves generated by the Szeged RISØ α-source with unknown dose rate and the normalised OSL/IRSL of calibration doses administered by the known dose rate Bayreuth Littlemore α-source. (A) quartz sample OSL, (B) polymineral sample first temperature IR50 and (C) polymineral sample pIRIR290. MAR, multiple aliquot regeneration; OSL, optically stimulated luminescence; pIRIR, Post-IR IRSL.
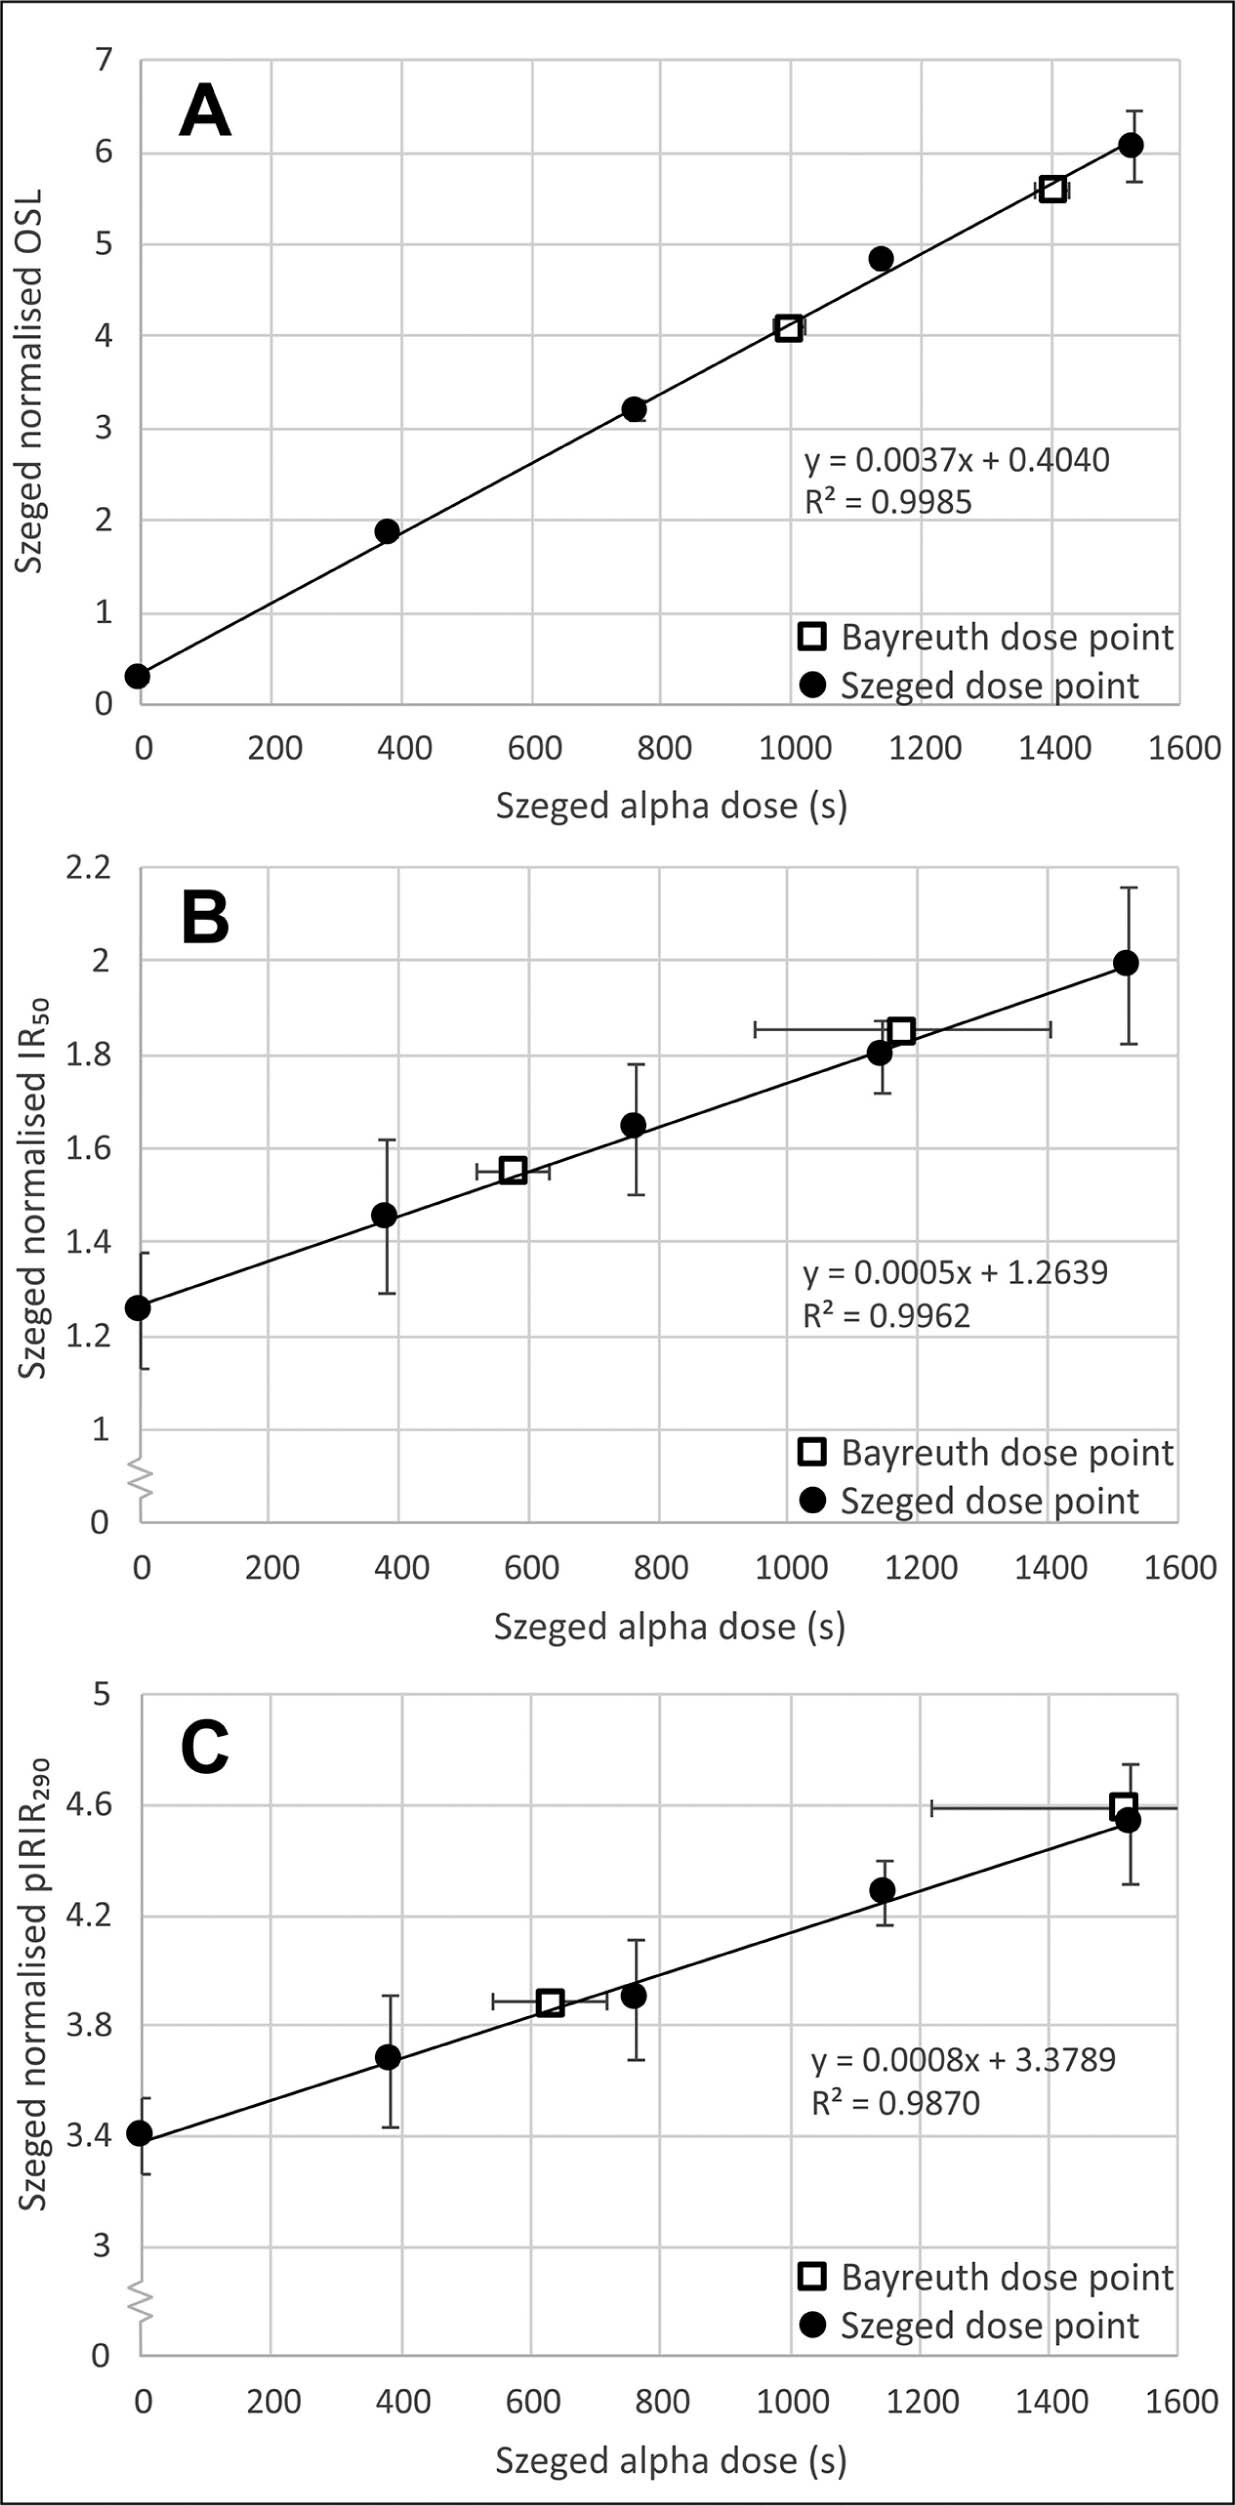
The dose rate of the Szeged α-source was determined first by calculating time equivalent Szeged doses from normalised luminescence intensities of Bayreuth doses using the equation of the linear function fitted to the Szeged dose points, then by taking the ratio of Bayreuth and corresponding Szeged doses and multiplying them with the dose rate of the Littlemore α-source in Bayreuth (Table 1). The highest precision was achieved in the case of quartz measurements (0.071 ± 0.002 Gy/s). The pIRIR290 derived α-dose rate was close to the quartz value (0.085 ± 0.010 Gy/s); in the meantime, the dose rate calculated from the first temperature IR50 values was significantly higher (0.109 ± 0.012 Gy/s).
Table 1
Szeged a-source dose rates determined by different calibration procedures.
[i]
OSLBAY:
Normalised luminescence intensities measured on aliquots irradiated at Bayreuth.
DαSZE(s):
Time equivalent Szeged α-dose.
DαBAY(s):
Time equivalent Bayreuth α-dose.
D*αSZE:
Dose rate of Szeged α-source (Gy/s).
D*αBAY:
Dose rate of Bayreuth α-source (Gy/s).
b:
y-intercept of a linear function.
m:
slope of a linear function.
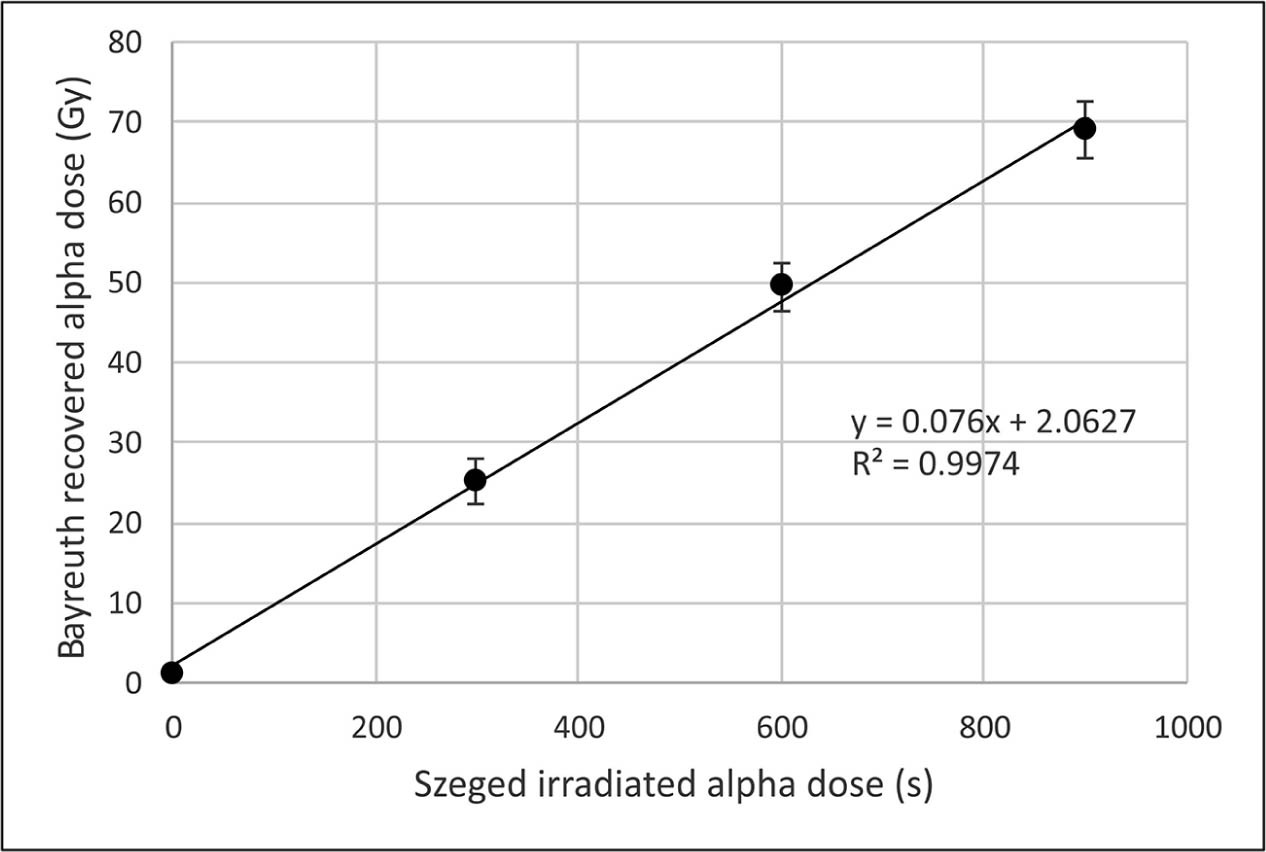
The α-SAR dose recovery of previously administered, incrementally increasing α-doses yielded robust results concerning the quartz sample investigated (Fig. 3). A low residual and a low scatter were experienced concerning the dose points (mean relative SE if residuals are subtracted: 7.4%), and a linear function with a high R2 value could be fitted to the calibration points. The dose rate (0.076 ± 0.004 Gy/s), calculated from the equation of the linear function, was within the error of the value determined through MAR measurements on the same sample (Table 1).
Fig 3
Alpha SAR dose recovery of previously administered, incrementally increasing α-doses. Irradiation was made with the unknown dose rate Szeged α-source, while measurements were made at Bayreuth. SAR, Single aliquot regeneration.
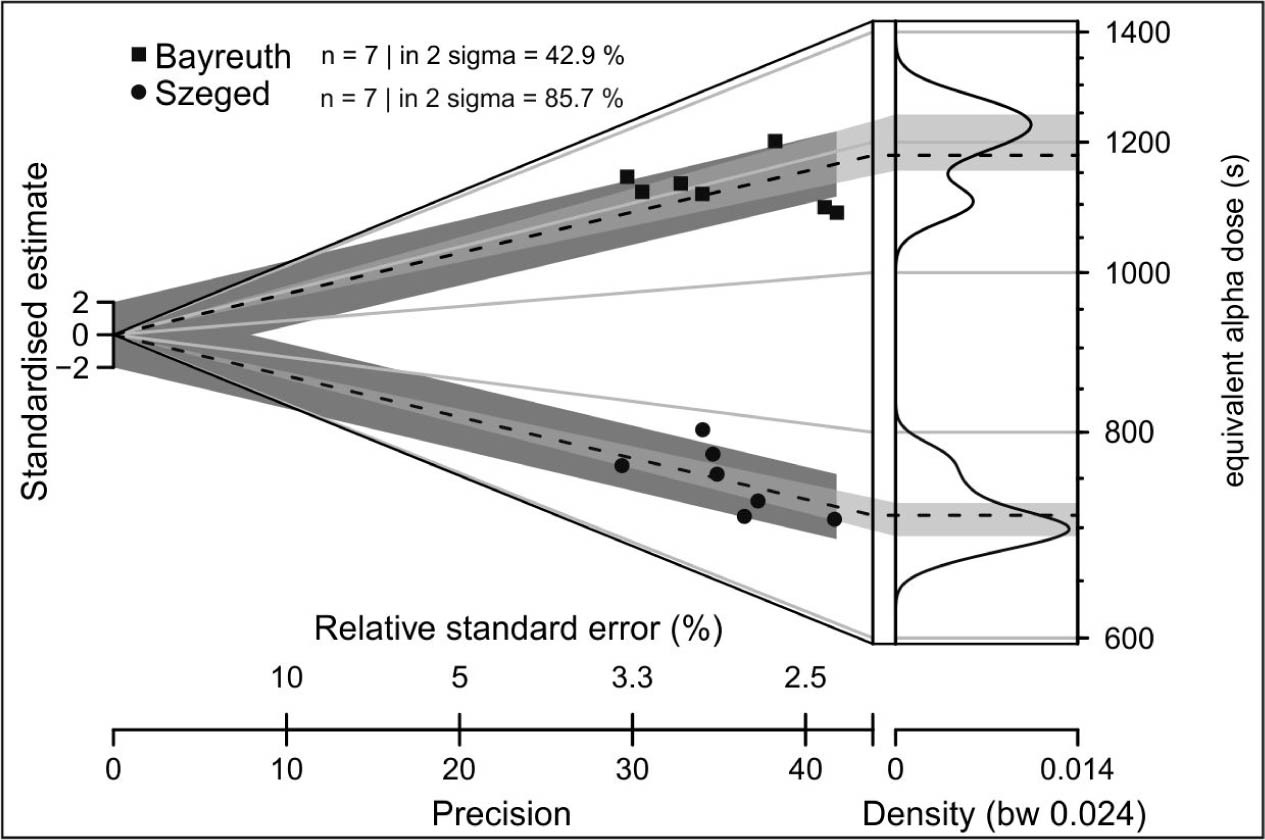
The result of the third approach, that is, recovering a known γ-dose by the two RISØ α-sources, are shown in Fig. 4. The dose rate was calculated by dividing mean equivalent α-doses expressed in time (Bayreuth: 714 ± 12 s; Szeged: 1193 ± 25 s; ratio: 0.060) and multiplying it with the known dose rate of the Bayreuth α-source. The value received (0.086 ± 0.005 Gy/s) proved to be almost identical to the dose rate calculated from the MAR pIRIR290 measurement of the polymineral sample (Table 1).
Fig 4
Abanico plot (Dietze et al., 2016) of equivalent α-doses of the 4.81 Gy γ-dose carried by the RISØ calibration quartz, measured by the two readers at Szeged and Bayreuth.
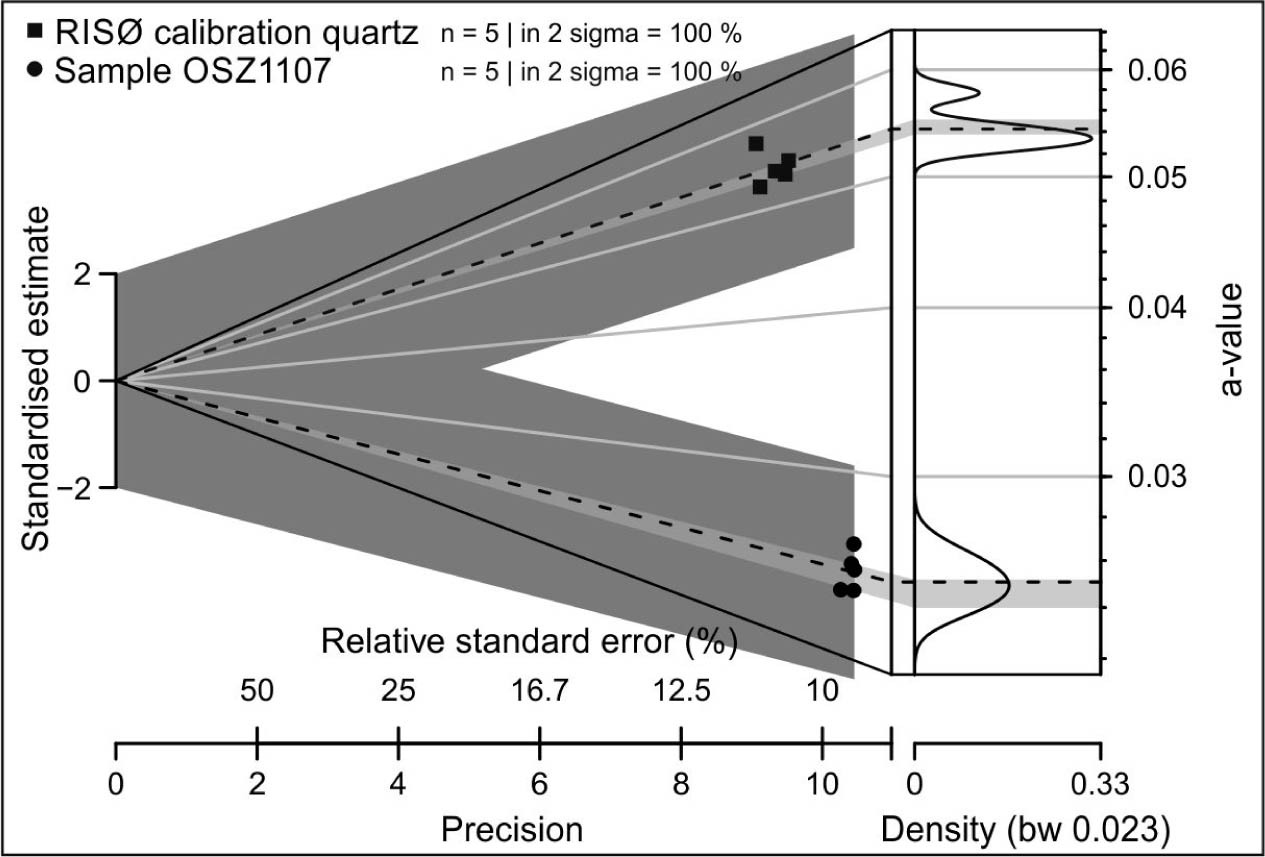
For the later comparison of the results received from the two different quartz samples, the a-value of both was calculated using the α-dose rates just determined (Fig. 5). Using sample-specific α-dose rates, the a-value of the RISØ calibration quartz turned out to be 0.050 ± 0.003, whereas that of sample OSZ1107 became 0.027 ± 0.001, underlining the fact that even in the case of quartz samples the a-value can show considerable variations. Nevertheless, both values reported here are in the range of values (0.023–0.053) measured in the more extensive study of Mauz et al. (2006).
Fig 5
Abanico plot (Dietze et al., 2016) of a-values concerning the RISØ calibration quartz and sample OSZ1107. Both datasets were measured at Szeged. The a-values are calculated by using the dose rate value determined by using the specific sample.
. Which calibration result should be used?
After performing different types of cross-calibration, the question always arises which of them should be applied for the calibration of our unknown α-source. As it can be seen from the results, some of the procedures yielded very similar results, although on the other hand, significant differences were also experienced (Table 1). For instance, there is >30% difference between IR50 MAR and OSL MAR results. If the mean and the SE of each calibration result is taken, then a value of 0.085 ± 0.007 Gy/s is obtained. However, the IR50 value measured as part of the pIRIR290 protocol suffers from two problems. F remains quasi-linear, even though a significant delay was applied between irradiations and measurements, α-dosing in Bayreuth was made somewhat earlier than in Szeged, thus the fading of the IR signal could be more significant in the case of the aliquots irradiated in Bayreuth, leading to the calculation of a higher dose rate in the end. Second, as it was seen, the IR50 signal had low sensitivity and the fitted linear function had a very low slope along with comparatively high uncertainty. For the abovementioned reasons, we considered the IR50 MAR cross-calibration unreliable.
After rejecting the IR50 value two distinct groups of results remained, one is represented by the MAR and SAR dose recovery measurement of the same quartz sample, the other by the pIRIR290 MAR measurement of the polymineral sample and the SAR dose recovery measurement of the RISØ calibration quartz (Table 1).
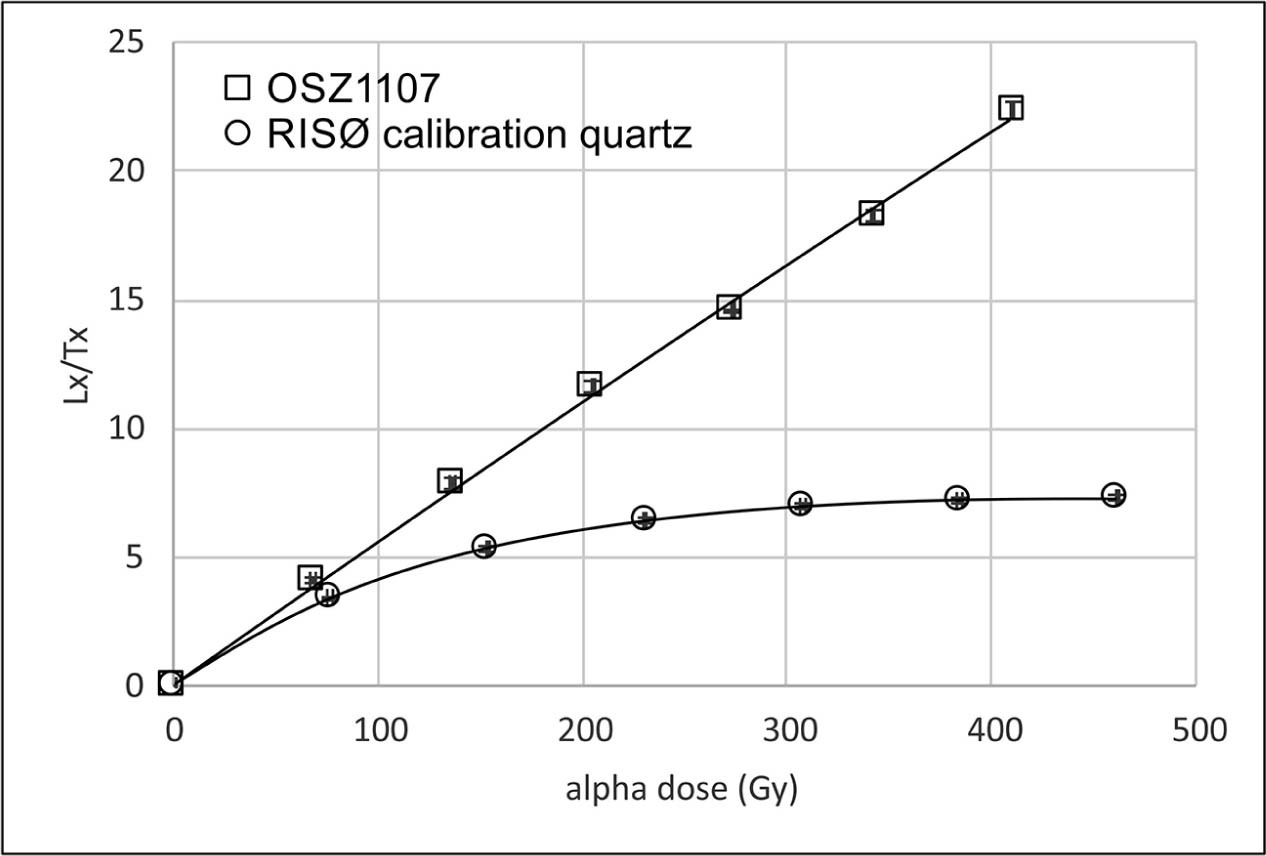
To investigate the behaviour of quartz samples with regard to α-radiation and their reliability as dosimeters, a dose-response curve was generated in the dose range of the cross-calibration procedures and beyond (>400 Gy, Fig. 6). The growth curve of sample OSZ1107 remains quasi-linear up to 460 Gy, similarly to the findings of Mauz et al. (2006). On the other hand, the α-dose-response curve of the RISØ calibration quartz saturates surprisingly early, that is, the 2D0 value was only 233 Gy (Fig. 6). It is true, however, that the 4.81 Gy γ-dose used for the cross-measurements equals approximately a 60 Gy α-dose, which is below the saturation level. The sensitivity of the calibration quartz, similarly to repeated β-regeneration (Hansen et al., 2015), remained fairly uniform in terms of repeated α-doses as well.
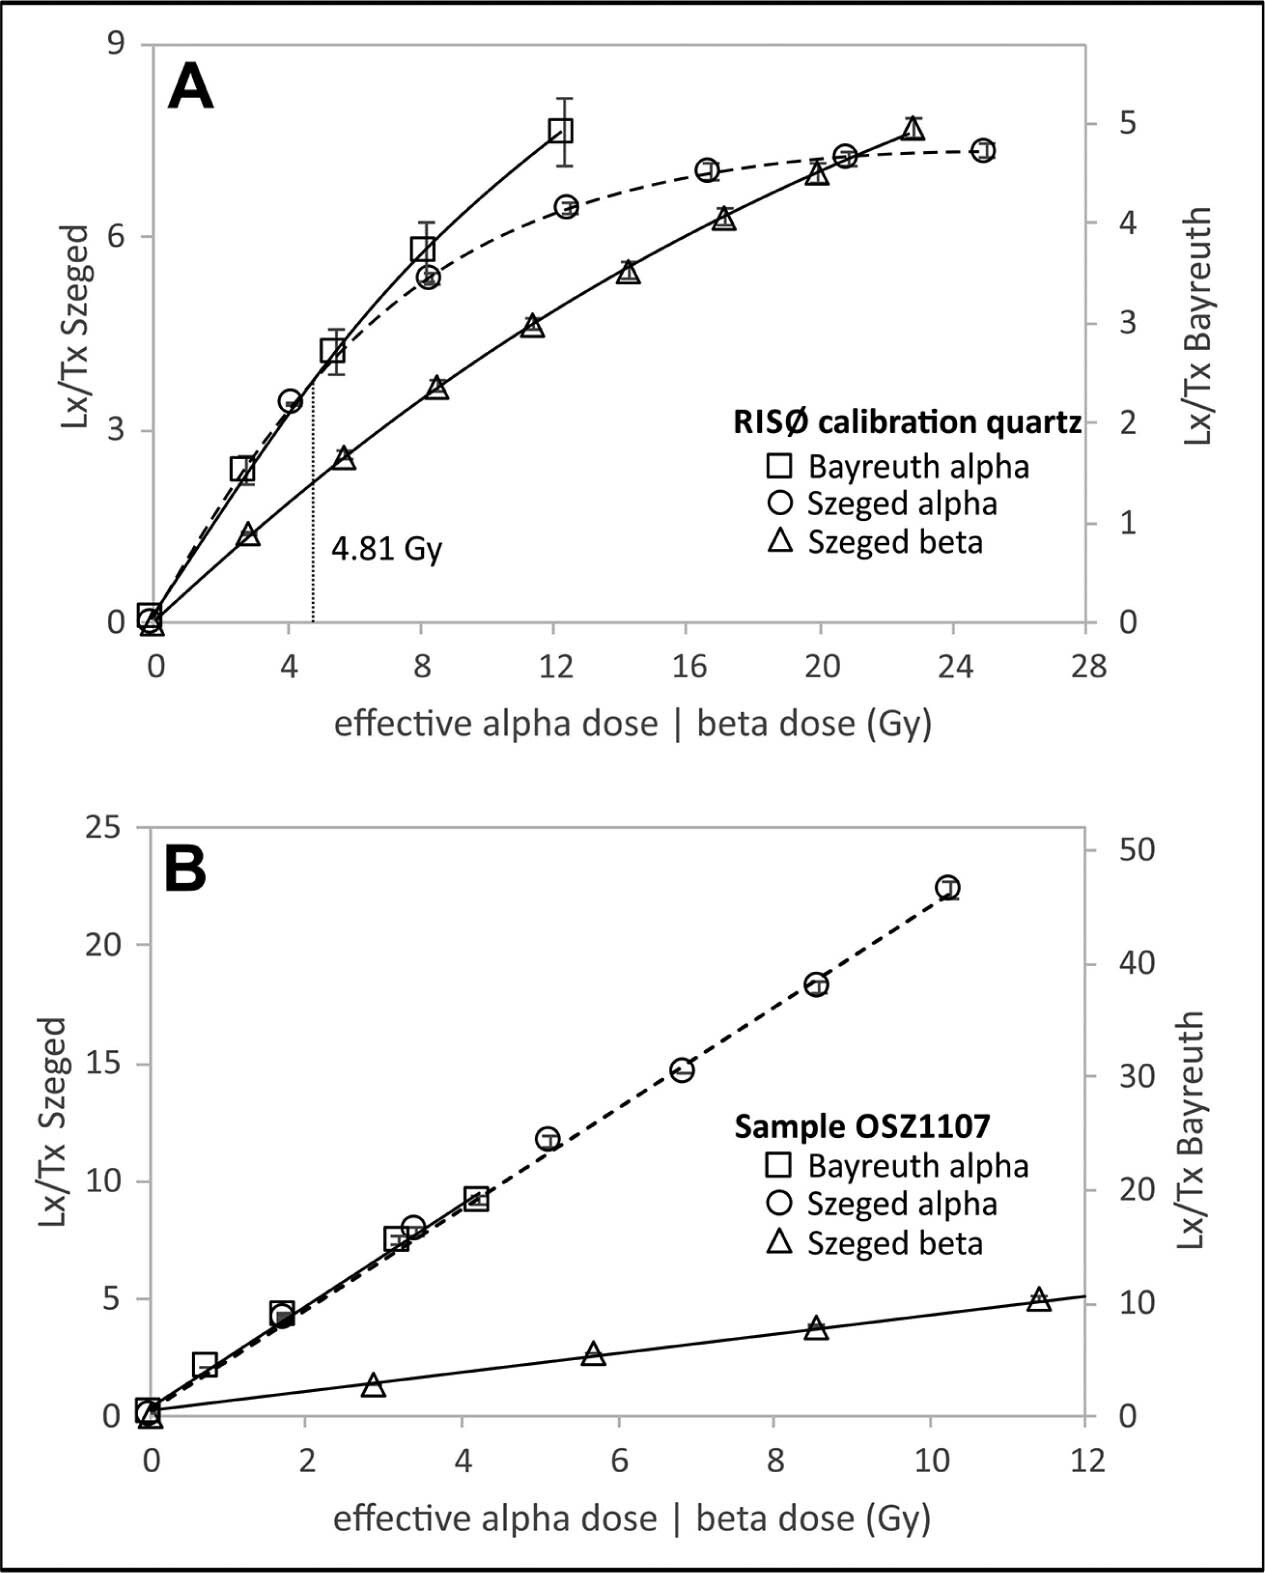
Nevertheless, it was noted during data analysis that the shape of the α-dose-response curves considerably varies, and this variation was also manifested when comparing mean α-dose-response curves from the two laboratories (Fig. 7A). This deviation could indeed lead to an erroneous cross-calibration, as the previously administered γ-dose would be recovered differently at the two readers not only because of the different dose rate of α-sources but also because of the different shape of α-dose-response curves. One could claim that the experienced deviation might be caused by slight inconsistencies in the measurement conditions (e.g. different regeneration doses, different levels of vacuum, etc.). To decide whether the problem above, which would anyway also affect the results of MAR-based cross-calibration, is relevant or not, a similar comparison of α-dose-response curves was made for sample OSZ1107 (Fig. 7B). In this case, α-dose-response curves, along with the β growth curve, exhibit a practically identical, linear shape, suggesting that the deviation experienced in terms of the RISØ calibration quartz might be accounted for reasons related to sample behaviour rather than differences in measurement parameters. It has to be stressed that the recovered γ-dose (4.81 Gy) falls in the linear part of both mean α-dose-response curves (Fig. 7A). Thus, even though at higher doses the RISØ calibration quartz seems to be less reliable concerning α-dosing, at the present calibration dose range there is no reason to discard the results obtained by this procedure.
Fig 7
Comparison of α- and β-dose-response curves measured at the two laboratories concerning (A) the RISØ calibration quartz and (B) sample OSZ1107. Effective α-dose stands for the β-dose equivalent of the α-dose administered, the conversion is made using the sample-specific a-value.
Similar to IR50 MAR results, pIRIR290 MAR values also show a great scatter, but due to the slightly higher slope of the function (Fig. 3) and the fact that the pIRIR signal is less affected by anomalous fading (Thomsen et al., 2008; Thiel et al., 2011), thus having a negligible effect on the results, we decided to consider the result achieved by this procedure as well. Consequently, the mean dose rate calculated for the Szeged α-source became 0.080 ± 0.004 Gy/s. This modifies the measured a-value of the RISØ calibration quartz to 0.054 ± 0.003.
As a final check for the comparability of the cross-calibration procedures, the effect of the two end-members of calibration results was assessed on typical dose rate values. An aeolian loess sample from the Novo Orahovo loess section was chosen for this purpose as both of its quartz and polymineral fraction have been subjected to a-value measurements during dating (Sipos et al., in prep.), carried out at the same time as the cross-calibration. The a-value of both fractions was calculated by applying 0.071 ± 0.002 Gy/s and 0.086 ± 0.005 Gy/s α-source dose rates (Table 2). The concentration of U-nat, Th and K in the sample was 2.79 ± 0.03 ppm, 8.43 ± 0.15 ppm and 1.23 ± 0.05%, respectively. The ratio of wet α-dose rates calculated with the different a-values was 0.83 equally for the quartz and the polymineral fraction. When total environmental dose rates are compared, the ratio increases to 0.98 and 0.97, meaning that there is 2–3% difference between the results (Table 2). If we also consider that the errors of both α and total dose rate values overlap, and the significance of this difference decreases further when the age is calculated, it is reasonable to claim that at the usual uncertainty attributed to luminescence ages, it has a negligible effect which α-source dose rate value is used for determining the a-value.
Table 2
Environmental dose rates for the quartz and polymineral fraction of the same loess sample, calculated by applying the lowest and highest a-source dose rate received during the cross-calibration process.
. Conclusion
In the present study, five calibration procedures were tested, using different samples, different protocols and different α-sources to cross-calibrate the built-in α-source of a RISØ TL/OSL DA-20 luminescence reader to conduct reliable fine-grain luminescence dating later. Regardless of the applied procedure, the calculated α-dose rates with one exception gave similar results, thus the calibration process can be regarded as successful, and the dose rate of the α-source under calibration was determined to be 0.080 ± 0.004 Gy/s.
Moreover, the established relationships allow drawing some general conclusions as well. Although comparable results were obtained when using quartz OSL and polymineral pIRIR290 measurements, the issue of fading and the high level of residual doses decrease significantly the precision and possibly, also the accuracy of polymineral MAR IR50 measurements. However, the application of the pIRIR290 signal can be a feasible option if lower residuals are achieved and bright samples are applied. Quartz, on the other hand, seemed to be a more reliable material for cross-calibration if the results of a natural Aeolian sample are considered: different bleaching procedures, and the use of different known dose rate α-sources and protocols ended up in almost identical results.
Even though the α-source dose rates, determined by the different procedures, are practically interchangeable at the uncertainty values of luminescence dating, it is highly recommended to use more samples and/or more protocols during the calibration process. This way it is at least possible to compare the precision of results and to increase the reliability of the dose rate finally applied.
Within our multi-procedure approach, the performance of the fine-grain RISØ calibration quartz as a potential material for α-source cross-calibration could also be assessed. Compared to a natural fine grain quartz extract, the calibration material, artificially ground, shows a remarkably early signal saturation in response to α-dosing and the shape of α- and β-dose-response curves become different at relatively low doses. However, the 4.81 Gy β-equivalent γ-dose carried by the calibration quartz falls slightly within the quasi-linear part of both dose-response curves. Although no γ-dose-response curve could be generated for the sample, it seems that weaker than present γ-dosing would be more feasible for α-source calibration purposes in the future. Finally, if the a-value of the fine-grain RISØ calibration quartz would be determined in more laboratories, preferentially with primary α-sources, then the mean value would provide a simpler way to calibrate built-in α-sources with unknown dose rate.