
. Introduction
Cave sediments are often preserved from erosion when surface sediments are completely removed. Therefore, caves can work similarly to traps in terms of sediment retention. Secondary carbonates (i.e., speleothems) are the most interesting cave sediments in the context of paleoenvironmental reconstructions. Speleothems are chemically precipitated in caves from seepage water and are deposited either through the degassing of carbon dioxide in the deep, static parts of a cave or through evaporation in the dynamic regions of a cave (Schwarcz, 1986). Basically, there are four reasons why speleothem research is appealing: (I) speleothem profiles provide good records of the continental environment, which are hardly overwhelmed by other materials (e.g., lake sediments); (II) preserved records are usually continuous and long-lasting; (III) isotopic methods offer the possibility of the precise dating of speleothems; and (IV) the chemical composition of calcite reflects, with several assumptions, the chemical composition of the water from which it precipitated. The composition of water reflects environmental conditions near the cave, such as average rainfall and mean annual temperature. Calcareous speleothems have been used successfully to reconstruct past climate change by using calcite fabrics (Frisia, 2015), deriving paleotemperature through the use of trace elements (Fairchild and Treble, 2009), and obviously, using oxygen and carbon stable isotope compositions, which have been widely used (e.g., Baker et al., 2011; McDermott et al., 2011; Rudzka et al., 2011; Schimpf et al., 2011; Landwehr et al., 2011). The isotopic composition of speleothems is a useful proxy for understanding climate change. δ18O values from speleothem calcites reflect the isotopic composition of seepage water and indirectly reflect the cave temperature during calcite deposition. Therefore, δ18O is typically utilized as a temperature and precipitation proxy. In temperate climate zones, changes in δ13C values reflect the changes in vegetation intensity and soil activity. The enrichment of lighter isotopes (12C) is an indicator of improved soil development and more intense vegetation (Feng et al., 1999). The combination of precise dating and high-resolution analysis of oxygen and carbon isotopic compositions in speleothem calcites has been a tool for climate reconstructions, e.g., determining the time, duration and internal structure of climatic events or reconstructing monsoon intensity or the NAO index (Baker et al., 1993, Frisia et al., 2003, Roberts et al., 1998, Hu et al., 2008, Yuan et al., 2004, Wang et al., 2001, 2005).
The quality of paleoenvironmental reconstructions depends on the accuracy of the proxies used for the reconstruction and the accuracy of the studied chronology. High resolution and precise chronologies are relatively easy to complete for young speleothems. In speleothem science, the 230Th/U method is usually the best way to obtain precise chronologies. For older periods (i.e., older than 0.5 Ma), dating becomes a serious challenge. Theoretically, older material could be dated with the U-Pb method. However, this method requires relatively high uranium content (minimum of a few ppm), whereas typical speleothems from Poland (and all of Central Europe) have uranium concentrations below 0.1 ppm. Another possibility for assessing temporal patterns in speleothem material is paleomagnetic analysis. This method can only be applied for long records that contain a minimum of a few paleomagnetic events, but often only a single event can be recognized (e.g., the Brunhes-Matuyama boundary). Therefore, even records with quality environmental proxies can have geochemical limitations, which eliminate classic dating methods. Hence, looking for an alternative dating method is an important goal in all paleoenvironmental studies.
In this paper, we present the results of studies on speleothem material from Głęboka Cave (Kraków-Częstochowa Upland, Poland). The results of the 230Th/U analysis indicated that this material falls outside of the method age limit (i.e., older than 500 ka). Therefore, oxygen isotopic stratigraphy (OIS) is suggested as an alternative tool to create a chronology of the studied flowstone. The most extensive use of oxygen isotopes has been in deep-sea cores during the Cenozoic period, especially for Quaternary sediments, where data from calcite microfossils, notable foraminifera, recorded temperature fluctuations and growing and decaying ice-sheet volumes has allowed for the recognition of oxygen isotope stages. It has been possible to identify and correlate oxygen isotope stages across the globe (Imbrie et al., 1984). Based on intensive and detailed studies, global oxygen isotopic curves have been developed as a proxy of paleoclimatic changes (Lisiecki and Raymo, 2005). The correlation between the oxygen isotopic record with (or without) a problematic chronology and the global oxygen curve may allow for an estimated chronology of the studied record.
In summary, the main goal for this work is the improved estimation of studied flowstone chronologies. Oxygen isotopic stratigraphy is tested as an alternative dating method. The second goal is a regional paleoenvironmental interpretation of the obtained records (including δ18O and δ13C records) and the results of the petrographic observations.
. Materials
Głęboka Cave is located in southern Poland in the Kraków-Częstochowa Upland and is the largest known cave formed of karst from a natural reserve (Mt. Zborów; Fig. 1). Its length is 190 m, and the height difference between the farthest points of the cave is 22.4 m. Głęboka Cave is relatively rich in cave sediments. The cave consists of four major parts: the Entrance Corridor, the Southern Chamber, a Chamber with a Lowered ceiling and the Chamber behind Esso. Almost all lower levels of the cave are filled with fine-grained and sandy sediments. These sediments are covered in places by a thick layer of flowstone. The thickest and most intact flowstone remains in the southern part of the Southern Chamber (asterisk in Fig. 1B). A 48 cm continuous flowstone profile is selected in the studies presented in this paper.
Fig. 1
Location of the study site. A – location of the Głęboka Cave (black circle) in the southwestern region of Poland (Krajewski and Matyszkiewicz (2009), modified); B – plan view of the Głęboka Cave, which shows the location (asterisk) where the flowstones were collected, cave map and profile (B) after Sznober and Tyc (2010), simplified.
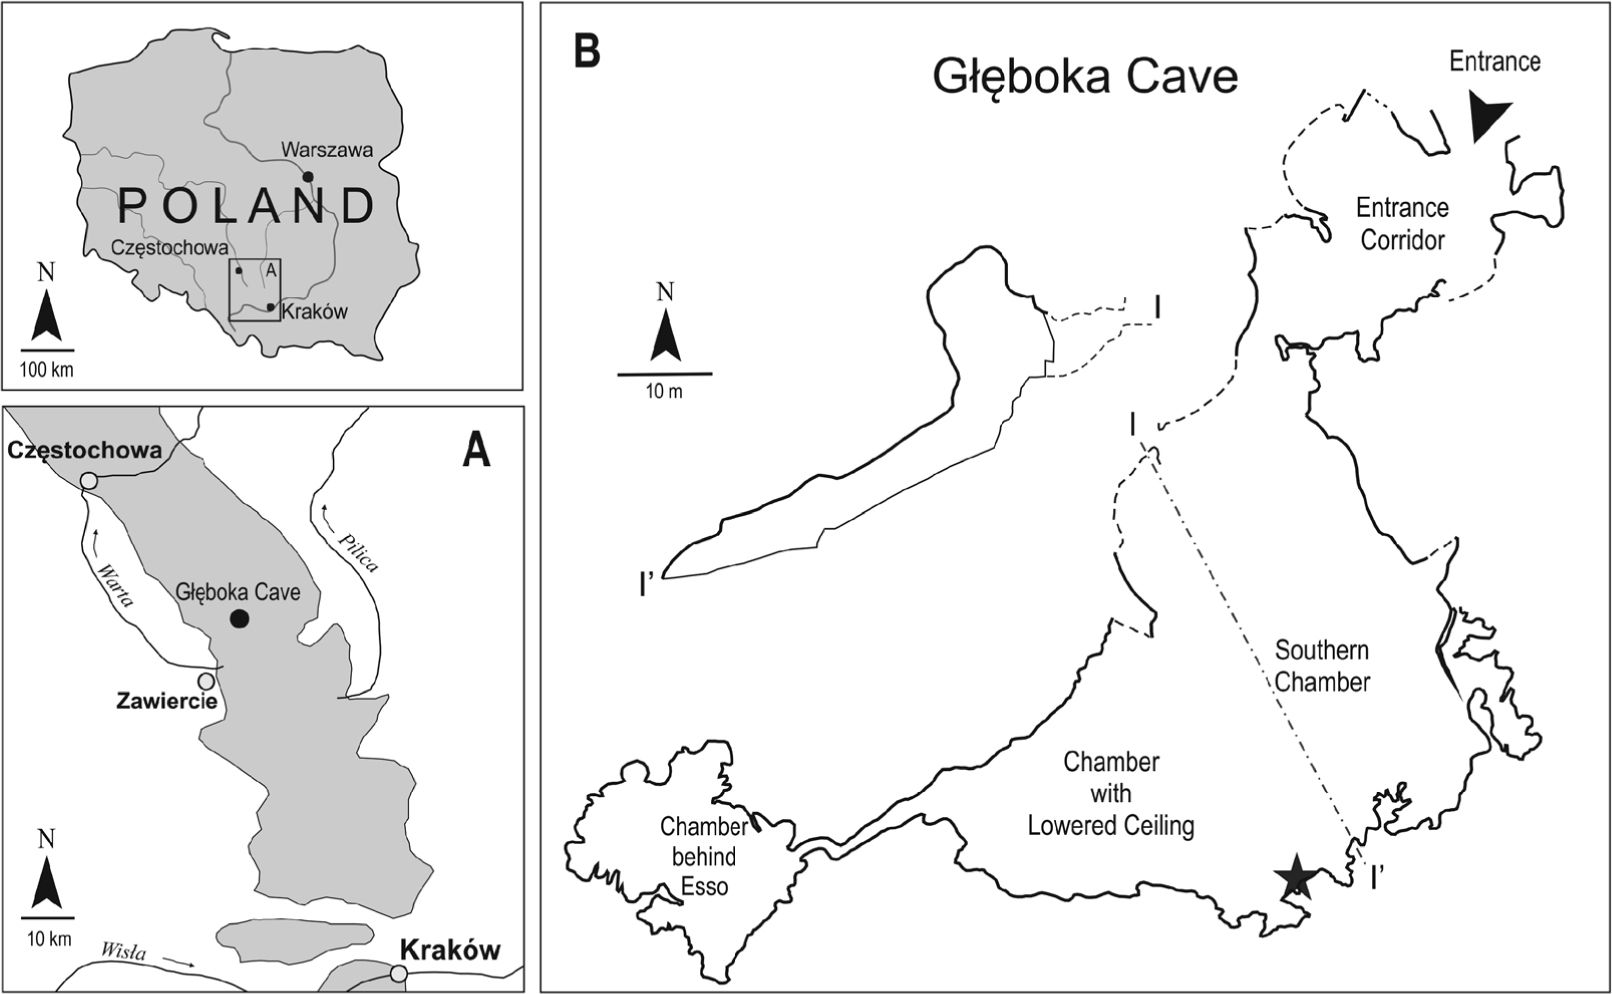
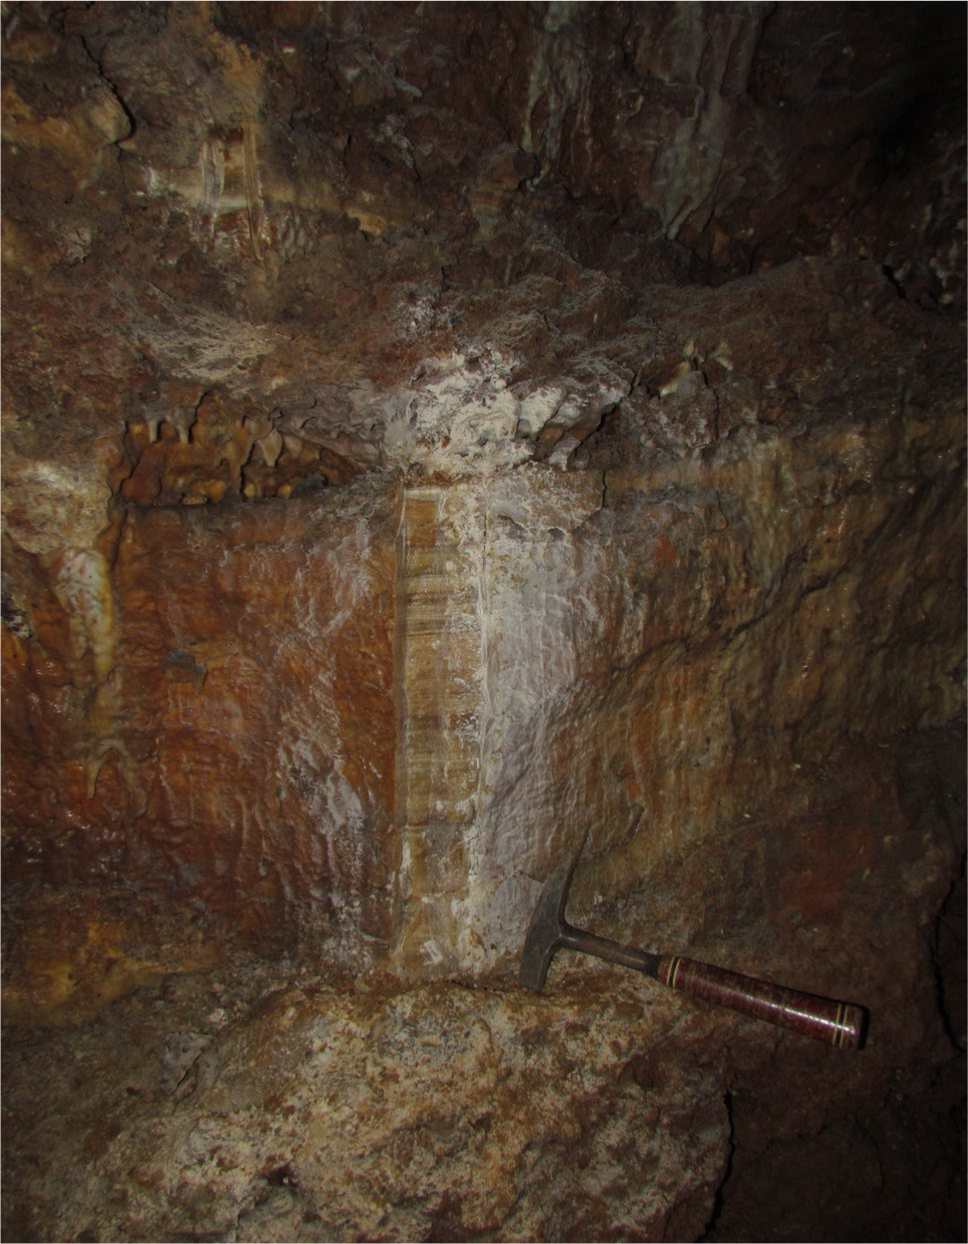
The sampled flowstone is located 16–16.5 m below the cave entrance, however over the profile of calcite flowstones there is more than 20 m of limestone. Currently there are no crystallizing flowstones in the cave; only small stalactites are forming. The cave is currently more than 50 m above the groundwater level. A photo of the entire flowstone and its setting is presented on Fig. 2.
The studied flowstone consists of four parts, which are separated by surfaces with discontinuities that are underlined with layers of detrital material (Fig. 3). The discontinuities in these surfaces occur at depths of 14 mm (H1), 52 mm, 56 mm (H2A and B), and 344 mm (H3). Macroscopic observations are able to distinguish several parts of the continuous calcites, which differ in colour, detrital material mixtures, porosity and others calcite crystal features (Fig. 3).
Fig. 3
Microscopic description of the studied flowstone. 1 – Discontinuities in the surfaces; 2 – Layers selected for the detailed microscopic studies.
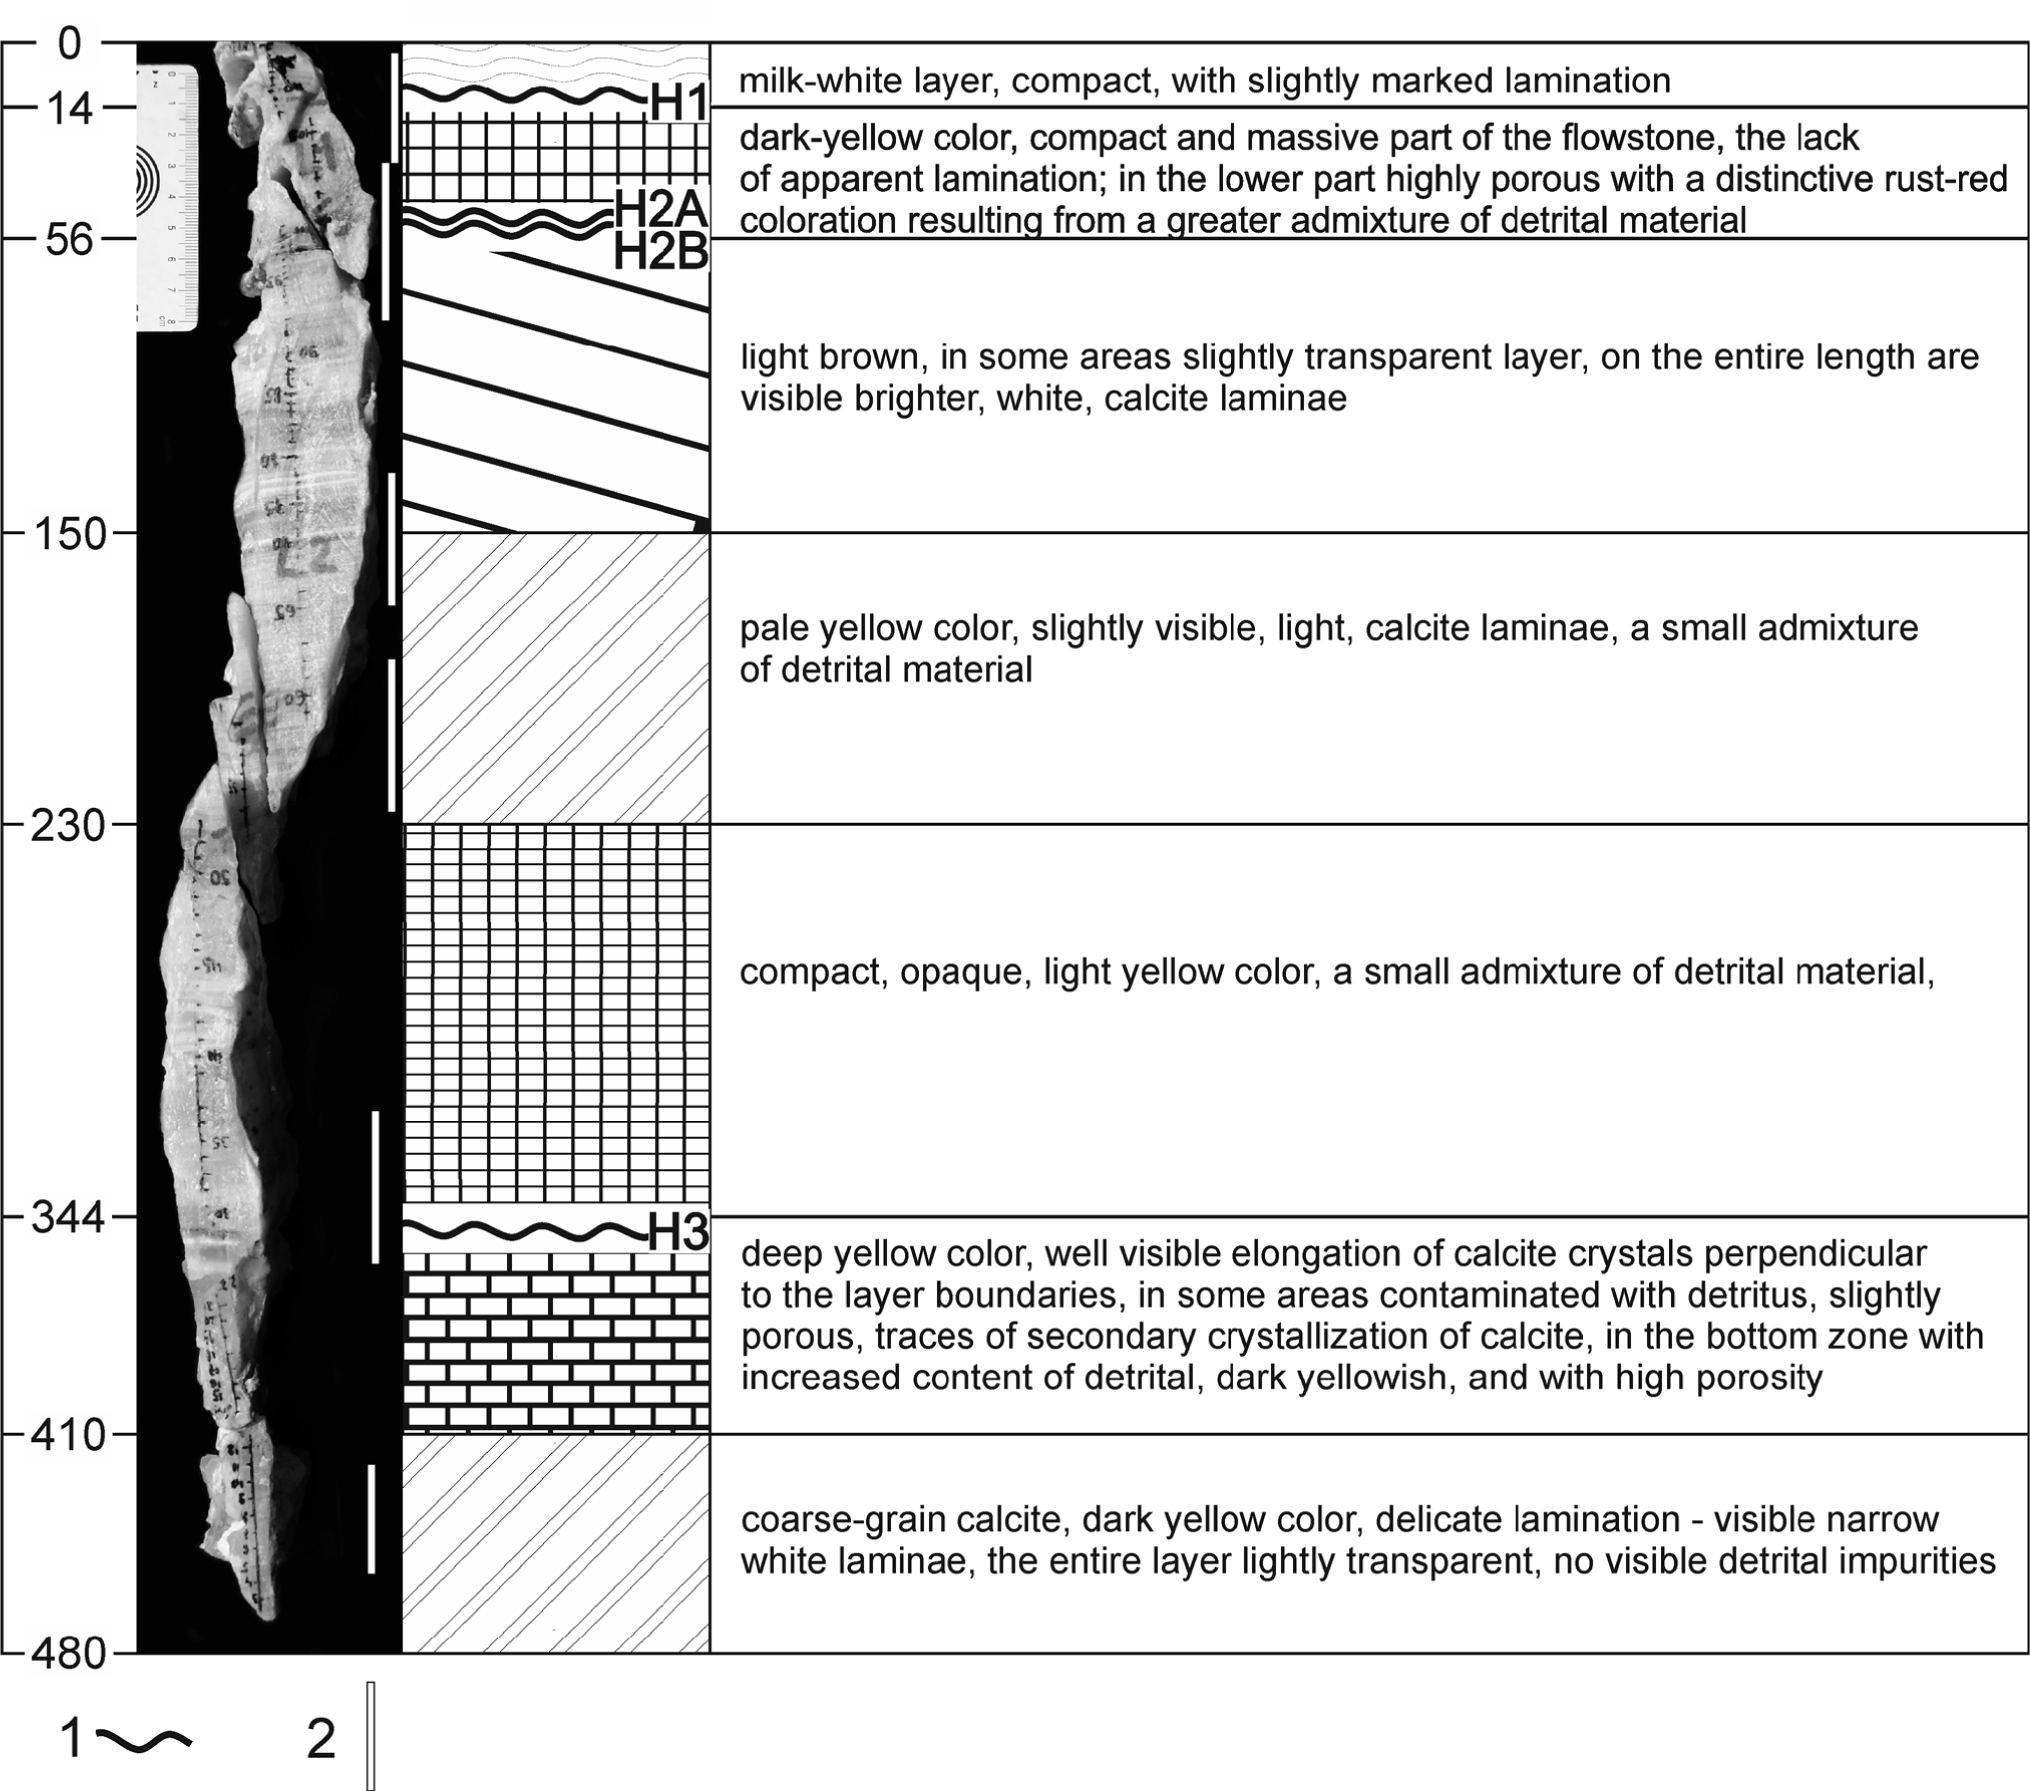
The upper part of the flowstone (depth of 0–56 mm) consists of two layers, which are separated by discontinuities in the surfaces. The lower discontinuities (H2) have two breaks (H2A and H2B), which are separated by a 2–4 mm thick layer of mixtures, including detrital and calcite materials. These two layers are built from different calcite fabrics: almost pure calcite and more detritally-contaminated calcite. The middle, thickest part of the flowstone, which is located between the H2 and H3 discontinuities (56–344 mm depth), has been divided into three slightly different zones, which are mainly based on the colour, transparency and occurrence of lamination. In the lowest part of the flowstone (below the H3 discontinuity), two different zones are distinguished based on the calcite crystal purity and the flowstone porosity.
. Methods
Microfacies analysis
Six thin sections were cut parallel to the growth direction from locations with visible discontinuities during deposition, and those that differed in the macroscopic characteristic of calcite were used to determine the microscopic description. The main goal of the microscopic observation was to study growth mechanisms and microscopic features such as banding, fabric type, microdiscontinuities and inclusions. The microscopic observations were obtained using the Nikon Eclipse LV100POL microscope from the Institute of Geological Sciences at the Polish Academy of Sciences (Warsaw, Poland). The analysis and characterization of the speleothem fabrics were based on the methodology proposed by Turgeon and Lundberg (2001)1 and Frisia (2015). Based on the microscopic observations, a microstratigraphic log was constructed for selected parts of the flowstone; its construction used a series of codes to identify fabrics similar to those proposed by Muñoz-García et al. (2016) and Frisia (2015). The applied code scheme begins under very stable conditions and is represented by columnar compact (C), which is followed by columnar compact with laminae (Cl), columnar open (Co), columnar elongated (Ce), and columnar microcrystalline (Cm). The log concludes with columnar with possible dissolutions and hiatuses (Cd), which indicates the presence of the most unstable stage and corrosion and destruction conditions in the flowstone.
U-series dating
Series of 0.5–1.7 g calcite samples were drilled along the growing layers. The average thickness of the drilled sample was 2 mm. After the thermal decomposition of organic matter, the samples were spiked with a 233U-236U-229Th spike before further chemical treatment. The calcite sample was dissolved in nitric acid. Uranium and thorium were separated from the carbonate matrix using a chromatography method with TRU Resin. Standard samples and blank samples were prepared simultaneously for every series in the studied samples. Mass abundances of 236U, 233U, 234U, 238U, 229Th, 230Th and 232Th were measured by a double-focusing sector field ICP mass spectrometer (Element 2, Thermo Finnigan MAT) in an ICP-MS laboratory at the Institute of Geology (Czech Academy of Sciences, Prague, Czech Republic). The measurement results were corrected to account for background and chemical blanks. The final results were reported as isotopic ratios. U-series ages were iteratively calculated from the 230Th/234U and 234U/238U activity ratios using the following decay constants (yr–1): λ238 = (1.55125 ± 0.0017) ·10–10 (Jaffey et al., 1971), λ234 = (2.826 ± 0.0056) ·10–6 (Cheng et al., 2000), λ32 = (4.95 ± 0.035) ·10–11 (Holden, 1990), and λ230 = (9.1577 ± 0.028) ·10–6 (Cheng et al., 2000).
Oxygen and carbon stable isotope compositions
Samples for the δ18O and δ13C analyses were acquired at a 4.5 mm resolution. The analyses were carried out at the Laboratory for Isotope Dating and Environmental Research at the Institute of Geological Sciences, Polish Academy of Sciences (Warsaw, Poland). Oxygen and carbon stable isotope compositions were determined using a Thermo Kiel IV carbonate device connected to a Finnigan Delta Plus IRMS spectrometer in a dual inlet system. CO2 from calcite was extracted using orthophosphoric acid (density: 1.94 g/dm3) at 70°C. International standard NBS 19 was analysed in every ten samples. The isotope ratios were reported as delta (δ) values and expressed relative to the Vienna Pee Dee Belemnite standard. Measurement precisions of 0.07%o and 0.03%o were identified for oxygen and carbon, respectively (at 1 standard deviation).
Isotopic record correlations
For age estimation, we used the OIS method. OIS is based on the correlation between the local δ18O record and the global reference δ18O record (Imbrie et al., 1984). As a reference δ18O record with an established chronology, we used the global LR04 δ18O record (Lisiecki and Raymo, 2005). The LR04 curve was built as a combined record from 57 various and globally distributed foraminifera records. The LRO4 record is considered to be a record that reflects global changes in the δ18O composition of marine water. It also meets all of the necessary conditions for a reference curve: it is complete and detailed, it includes the desired time interval, it is controlled by the same factors, and it is reliably prepared. Before the correlations were calculated, data from both records were normalized. Normalization eliminates the effect of amplitude changes and the effect of data value shifts. Both of these effects are connected with local paleoenvironmental conditions. The next problem is the various reactions of caves and oceans to global changes, which are revealed by the same factors. During glaciation, ocean water becomes enriched in heavy oxygen isotopes, while meteoric water is enriched in light oxygen isotopes. For speleothems, the δ18O composition of meteoric water is an important factor. Therefore, we can expect that δ18O signals in the Głęboka Cave will have a negative correlation with marine signals. To solve this problem, we inverted the Głęboka Cave δ18O record for intercorrelation purposes. Correlation was accomplished using the modified GenCorr software (Pawlak and Hercman, 2016). GenCorr seeks an optimal correlation (i.e., the greatest similarity) between two or more records using different correlation procedures depending on the a priori age information. The basic procedure assumes that there is no knowledge of the record ages and therefore attempts to calculate correlations in a completely free mode. In contrast, comprehensive age information calculated using an age-depth model (with a continuous chronology) allows for the identification of optimal correlations within the limits of the model’s confidence bands. However, in most typical situations, only partial information about the age of a record is available (e.g., few dating results). This type of information may be used as a chronological benchmark during the correlation process. Three types of benchmarks are implemented in GenCorr: (i) fixed benchmarks, which are known ages at specified points in the profile; (ii) age information at specified points (e.g., dating results), which is described by a probability distribution (e.g., normal, uniform or skewed distribution); and (iii) age information that is described by an age limit (e.g., older than 0.5 Ma). The age assigned for a fixed benchmark remains constant throughout the entire correlation procedure, while the ages for non-fixed benchmarks may change according to their distributions. Calculations for points located between benchmarks are required to meet only the following basic assumptions: (i) the ages are in accordance with the ages for the benchmarks and (ii) the results agree with their stratigraphic positions.
Using a genetic algorithm as a tool for correlation is one typical example of an AI technique that solves optimization problems. The final results depend on the initial populations and parameters of the genetic algorithm. The goal of the correlation process is to identify the most similar position in the studied records (i.e., identify the global optimum). To minimize the local optimum problem, it is recommended to perform several independent correlations using a random initial population, as the results choose the group of individual results with the best heuristic value (Pawlak and Hercman, 2016).
. Results
Calcite fabrics
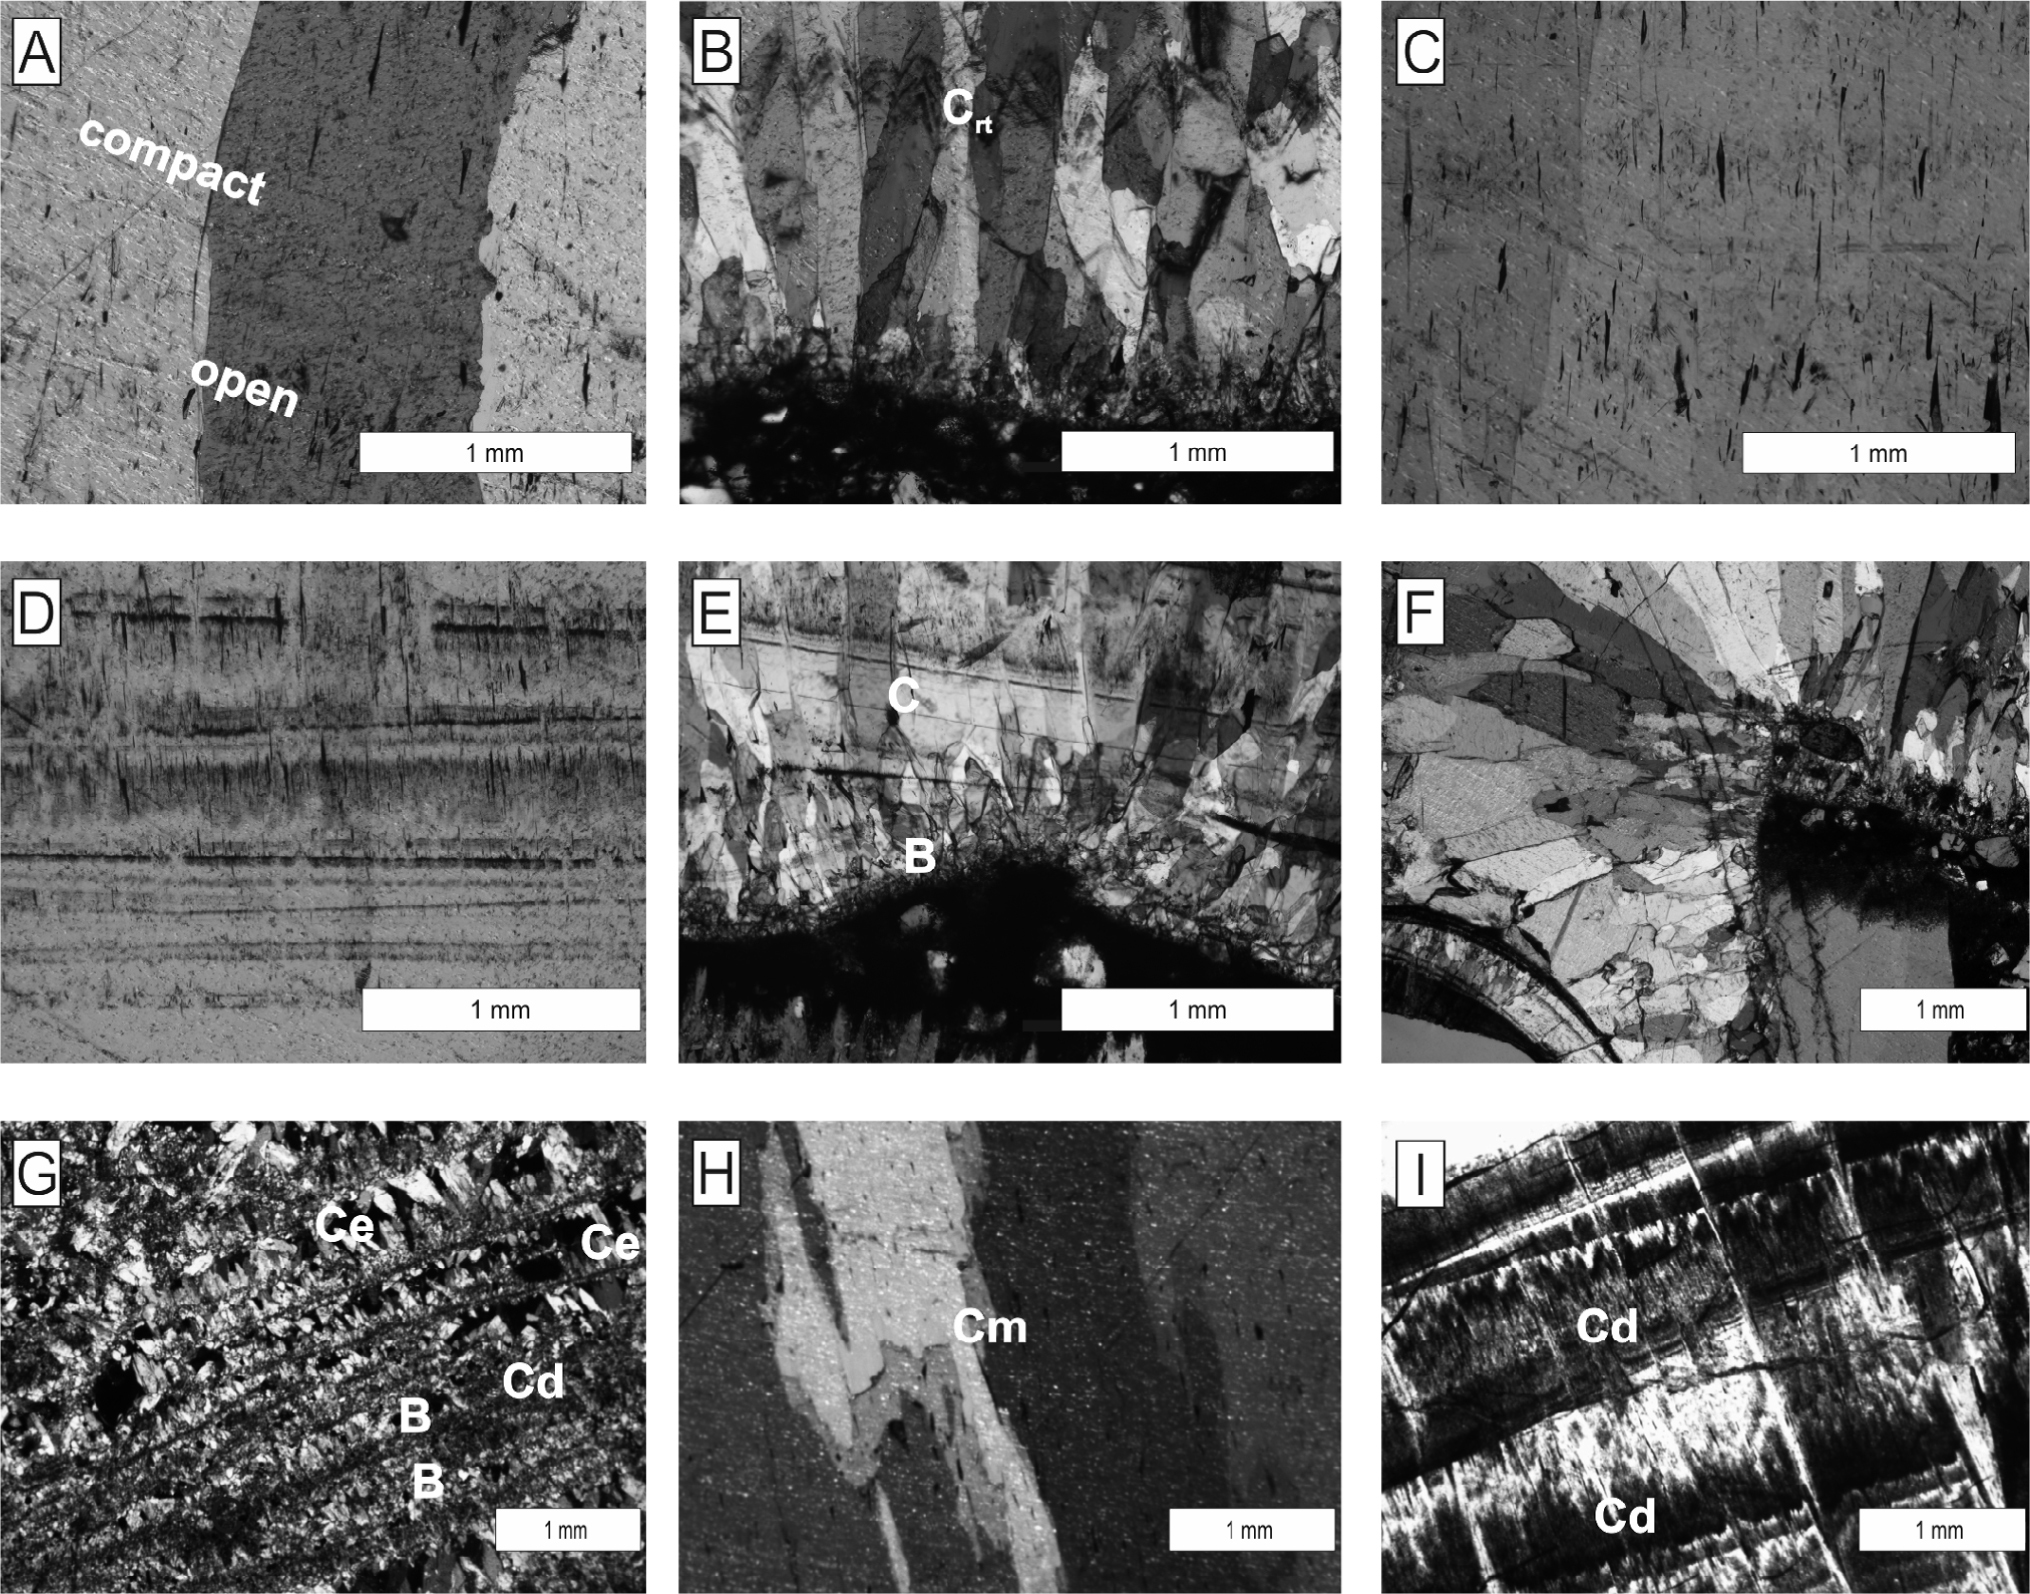
A microscopic analysis of the calcite crystal appearances and the identification of the original texture features of the studied material shows that approximately 90% of the observed flowstone is composed of elongated calcite crystals, which range from 0.2 mm to 3 mm wide and 2 mm to 30 mm long. Overall, the elongated crystals are perpendicular to the growth surface in each layer. Typically, the crystals are flush with each other; they are subparallel with one another and extinguish light at the same angle for the entire length of the crystals during microscopic observation (Fig. 4A). The surfaces of the crystals are usually jagged or serrated (i.e., characteristic protruding rhombohedral terminations; Fig. 4B). The colour of the crystals varies between clear, pale yellow and brown. The detrital material builds only thin, dark laminae. Other parts of the crystal are almost free of detrital material. Inclusions are visible within the crystals, which have extensions that are subparallel to the direction of crystal growth surface (Fig. 4C). The characteristics mentioned above are similar to those described in the works of Frisia (2015), Turgeon and Lundberg (2001), and Dziadzio et al. (1993), which indicates that columnar fabrics are also highlighted in those works. The described material often contains zones that are characterized by the occurrence of alternating white and brown laminae of different thicknesses. These laminae form sets, which are located within larger, flatter terminated calcite crystals (Fig. 4D). The brown colour of the laminae is caused by the higher content of detrital material, while the white laminae are composed mainly of pure calcite. These features are similar to those described for laminated fabrics (Dziadzio et al., 1993) or columnar compact fabrics with visible lamination (Frisia, 2015).
Fig. 4
Photomicrographs for different types of calcite fabrics observed in thin sections. A – Columnar fabric (compact and open); B – Columnar with hiatuses, columnar fabrics and protruding rhombohedral terminations (Crt) underlined with a higher content of detrital material; C – Columnar fabric with a faint lamination, which has a visible characteristic elongation of the inclusions parallel to the direction of the calcite crystal growth; D – Columnar compact fabric with faint and flat laminae; E – A large discontinuous surface with a blocky crystal fabric that gradually transforms into a columnar fabric; F – A degradation surface that is also visualized by the change in the direction of crystal growth; G – Initial crystalline stage, which precipitates after discontinuity surface with transitional basal crystals; H – Columnar fabric of the microcrystalline type; I – Dark layers (i.e., condensed dark laminae) with possible dissolutions and/or hiatuses.
During petrographic observations, the occurrence of several types of columnar fabrics was observed: elongated – competitive growth with the incomplete coalescence of crystals and a length to width ratio greater than 6:1, which sometimes shows lateral overgrowth; compact – when the crystals form a compact aggregate, and the intercrystalline porosity is not discernible; open – characterized by the presence of linear inclusions or pores; microcrystalline – composed of highly irregular intercrystalline boundaries, has a uniform extinction, and is punctuated by inter- and intracrystalline microporosity (Frisia, 2015).
Other characteristic zones are related to discontinuities in the surfaces. Those zones contain darker layers that are enriched with detrital material. They are often accompanied by visible signs of corrosion in older layers. These layers are essential for the formation of small calcite crystals, which are shaped by small blocks surrounded by quartz, micas and clay materials. Initially, many small crystals grow in different directions gradually with distance from the nucleation surface, then the size of the crystal increases significantly, and their orientation becomes optically uniform (Fig. 4E). This means that the crystals grew in accordance with the rule of competitive growth.
Additionally, large degradation surfaces appeared in external regions that had several thin sections; this is where the destruction and subsequent overgrowth of younger crystals occurred, which formed in different directions than the original crystals (Fig. 4F).
As mentioned previously, a microstratigraphic log was constructed for several parts of the flowstone using series of codes to identify fabrics similar to those proposed by Muñoz-García et al. (2016) and Frisia (2015). According to these authors, columnar compact fabric, (C) – 1, corresponds to the formation of crystals under a stable growth regime and a warm climate with a persistent water film, which enables the undisturbed crystallization of large, well-formed crystals. Next in the profile is columnar compact with laminae, (Cl) – 2, which often alternates with columnar compact fabrics; its occurrence is probably associated with seasonal changes in local environmental conditions. During the dry seasons, a smaller amount of detrital material is available, and the crystallization of pure calcite occurs, while during the wet seasons, an increase in meteoric water flow causes a higher clay material content. The observed flat terminations of the crystals formed from a very thin film of water. The flat terminations of the crystals facilitate the capture of clay materials. Further along in the log is the columnar open, (Co) – 3, which forms from a thicker film of fluid than that of compact fabrics and with faster water supply and less efficient degassing (Frisia, 2015). Another type is the columnar elongated, (Ce) – 4, which is usually formed under rather stable conditions, when water delivery rate does not change significantly, but higher Mg/Ca ratios in the drip water than in the previous columnar fabrics. The occurrence of this fabric can be indicative of interglacial periods, when high flows would prompt degassing, increase the precipitation rate and promote the incomplete coalescence of crystals and the development of linear inclusions (Turgeon and Lundberg, 2001). The fifth fabric is columnar microcrystalline, (Cm) – 5, which has highly irregular intercrystalline boundaries, a uniform extinction, and is punctuated by inter- and intracrystalline microporosity. Columnar microcrystalline is typical in stalagmites in temperate regions that are characterized by significant seasonal contrasts in temperature, vegetation activity and autumnal rainfall. Its development also requires seasonal changes in cave ventilation, as a less efficient exchange between cave and atmospheric air occurs when the inflow of colloidal particles from the soil is greater. The coding scale presented in our work ends with a columnar fabric that has possible dissolutions, hiatuses and zones related to discontinuities and detrital layers, (Cd) – 6, which indicates the presence of the most unstable stage and corrosion and destruction conditions in the flowstone.
As a result of the calcite fabric analysis, it was possible to prepare brief descriptions of the conditions that could lead to the formation of these layers (Frisia, 2015; Turgeon and Lundberg, 2001) and the observed depths of their occurrences in the flowstone (Table 1). The presented profile is not complete because only 6 thin sections were prepared to document the most typical fragments of the flowstone, and some transitions had macro-scopically different calcite fragments.
Table 1
Results of microstratigraphic logging for calcite fabrics in flowstone from the Głęboka Cave.
U-series results
For two samples (277 and 278, Table 2), the 230Th/232Th activity ratios were below 20, indicating significant allogenic thorium contamination. These samples were taken near layers that were visibly enriched in detrital materials, which was probably the source of detrital thorium.
Table 2
Results of U-series dating from the Głęboka Cave flowstone. The reported errors are 2σ.
The U content in all samples, except for the two contaminated samples, was relatively low (below 0.1 ppm), which was typical for speleothems from the Kraków-Częstochowa Upland. Only two samples (333 and 334, Table 2), which were located in the upper part of the flowstone profile (depths of 107 and 74 mm, respectively; Table 2), had ages within the method limit, but they had large uncertainties. The other samples had 230Th/234U activity ratios near 1, which suggests that the samples exceeded the age limit of the U-series method (>500 ka). Furthermore, the 234U/238U activity ratios for those samples (except the lowest one) remained in an isotopic disequilibrium state. This suggests that the measured sample ages were not older than 1.2 Ma. In summary, the results of the U-series dating only suggested that the studied flowstone crystallized in a time interval between 0.5 and 1.2 Ma, and only the basal layer may be older than 1.2 Ma.
Oxygen and carbon isotopic compositions
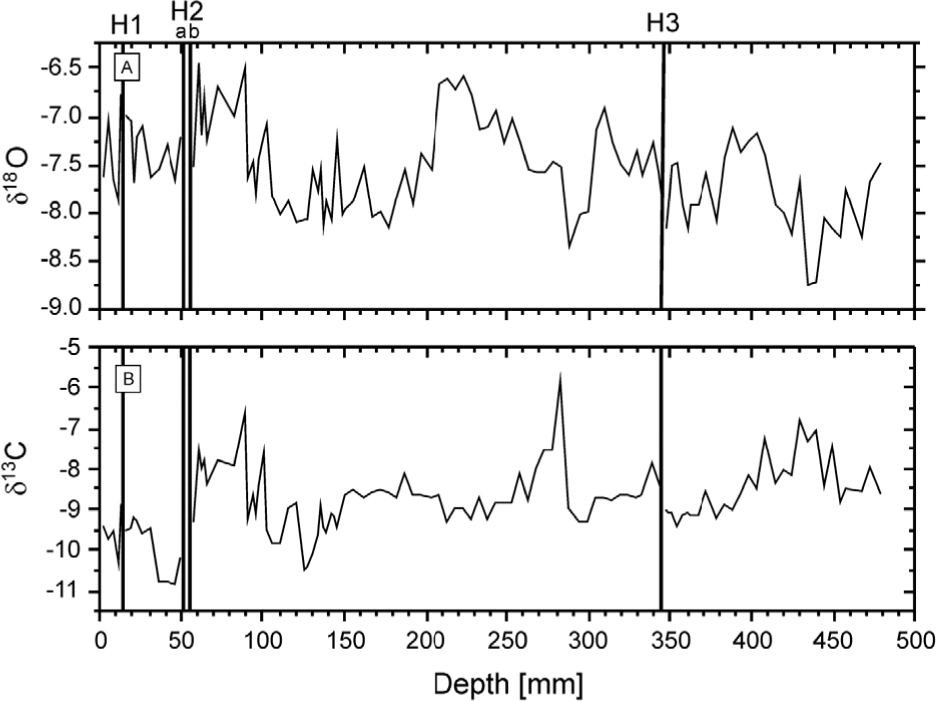
A total of 116 samples have been analyzed for the oxygen and carbon isotopic compositions, and as a result, we obtained the δ18O and δ13C records (Fig. 5). The isotopic composition records show significant changes during flowstone sedimentation. The δ18O values differ from –8.74 to –6.45%o, while the δ13C values differ from –10.80 to –5.88%. The flowstone from the Głęboka Cave was divided into four sections and three discontinuity zones. The δ18O record has the strongest variability in the H3 zone, where its amplitude is 0.8%, while the H2 and H1 zone variability is ca. 0.5%. In contrast, a visible shift in the δ13C record shows the strongest value in the H2 discontinuity (0.8%); for the H1 and H3 discontinuities, the amplitude of δ13C is ca. 0.6%.
Chronology estimation based on the oxygen stratigraphy method
The age of the studied flowstone is outside of the U-series limit. Speleothems from the Kraków-Częstochowa Upland are characterized by a low uranium content, which is why there are problems with the application of the uranium-lead method regarding dating.
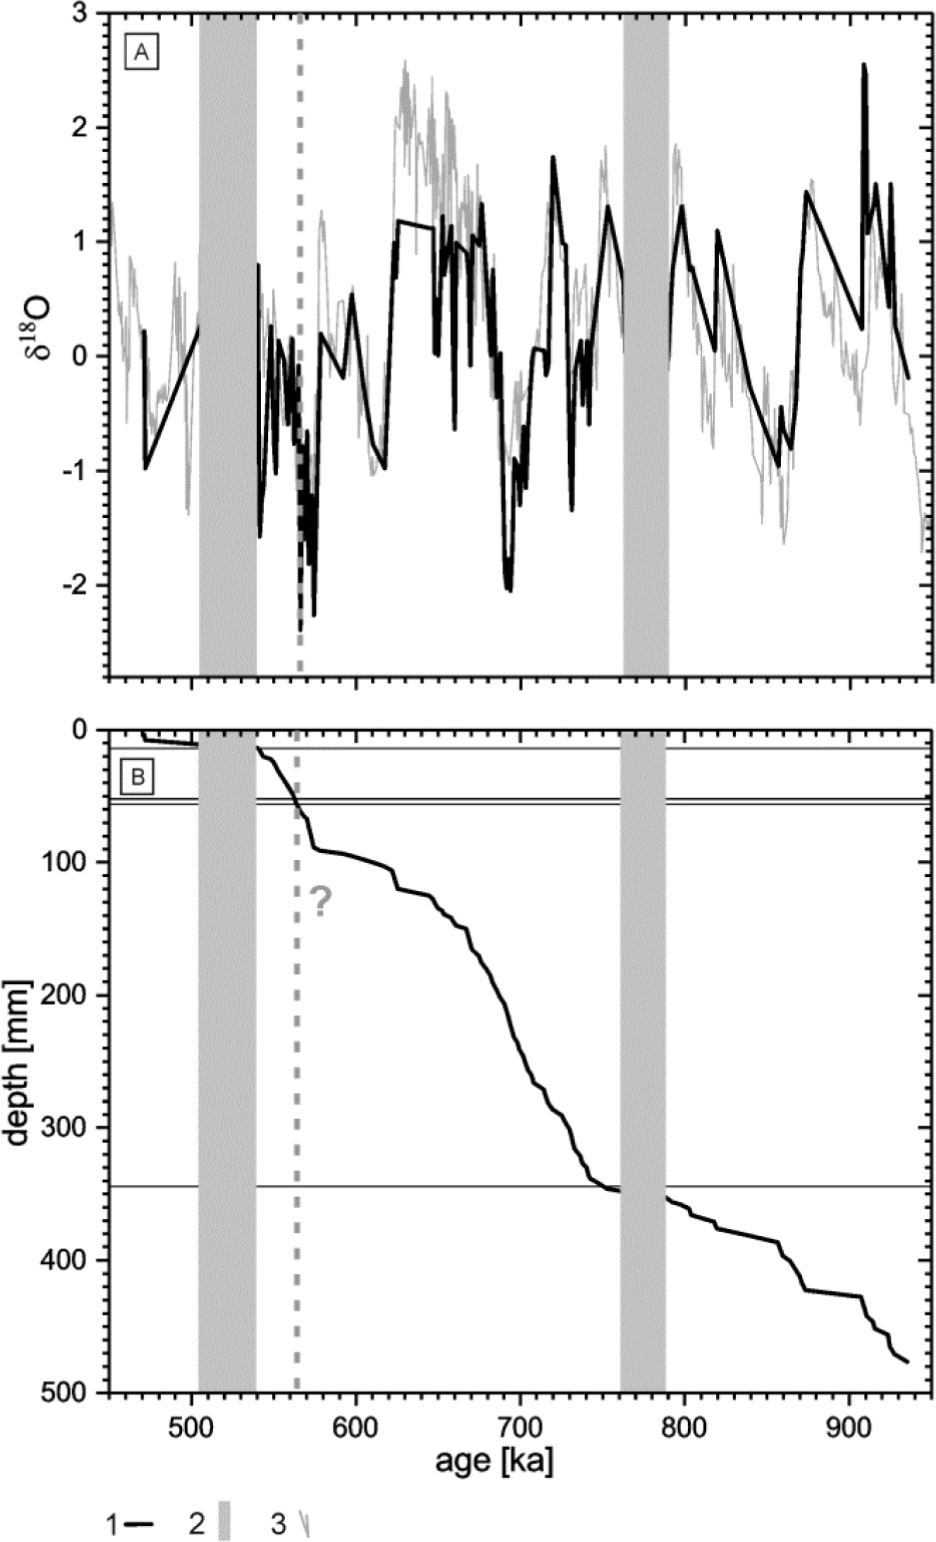
Therefore, the isotopic stratigraphy method was used to establish a more detailed chronology. Six dated points from the profile (Table 2) were utilized as temporal benchmarks. For the oldest point, an age older than 500 ka was assumed. For the younger layers, the time benchmarks were based on the dating results (samples 333 and 334, Table 2), or it was assuming that these ages had a uniform distribution from 500 ka to 1,200 ka. The δ18O record from the Głęboka Cave flowstone was correlated with the LR04 record (Lisiecki and Raymo, 2005) using GenCorr software (Pawlak and Hercman, 2016). The correlation results (Fig. 6A) show that the δ18O record from the Głęboka Cave fits the δ18O Atlantic record from 935 ± 5 ka to 470 ± 5 ka. GenCorr splits the correlated proxy into three parts, which are separated by deposition breaks (marked by grey sections in Fig. 6A). The age-depth model for the studied flowstone was constructed on the basis of the correlation results (Fig. 6B). The solid and horizontal black lines in Fig. 6B mark the depths of the hiatuses detected in the flowstone profile during the macroscopic observation. The solid grey sections in the age-depth graph mark the hiatuses detected during the correlation procedure. Two hiatus positions detected by correlation are in agreement with hiatuses H1 and H3 that are observed in the sample. According to the correlation results, the time interval for hiatus H1 ranges from 505 ka to 540 ka, and the time interval for hiatus H3 ranges from 760 ka to 790 ka. The H2 hiatus was not detected by correlation, which suggests a short duration deposition break that was connected with a large supply of detritus. The age–depth model shows rapid changes in the sedimentation rate. From 875 ka to 790 ka, the sedimentation rate is slow. It increases after hiatus H3. The time period between 740 ka and 620 ka is characterized by the fastest sedimentation rate, which comprises approximately 50% of the flowstone profile that crystallized during this period of time. The sedimentation rate slows down after 620 ka and remains slow until 570 ka. After 570 ka, the H1 sedimentation rate increases again. After the hiatus, the H1 sedimentation slows down and finally ends at approximately 470 ka.
Fig. 6
Oxygen stratigraphy results for the analysed flowstone. (A) 1 – δ18O record from the Głęboka Cave flowstone; 2 – discontinuity surfaces; 3 – the foraminifera δ18O record from the LR04 profile (Lisiecki and Raymo, 2005); (B) Age-depth model.
. Discussion
Chronology and sedimentation rate
One of the major objective of the present work was to obtain a chronology of the cave flowstone profile. A first attempt was made using U-series dating. However, the results showed that the studied flowstone age was out of the range of the 230Th/U method. On the other hand, the 234U/238U ratios dated the profile between 1,200 ka and 500 ka. Finally, isotopic stratigraphy was used as a tool to develop a more detailed chronology. The results of the isotopic stratigraphy correlation placed this flowstone profile in the time interval between 935 ± 5 ka and 470 ± 5 ka. The flowstone from Głęboka Cave was divided by three hiatuses. Two of them, H1 and H3, were also detected by numerical correlation. The detection of two hiatuses by numerical correlation confirmed the reliability of the calculated age-depth model. The deposition break time for H2 may be too short for detection by correlation at this record’s resolution.
The speleothem’s growth rate varies from approximately 0.4 mm up to approximately 5 mm/ka and is in range of the typical values reported for flowstones (Ford and Williams, 1989). The growth rate is positively correlated with temperature, thickness of water film and calcium ion concentration in seepage water (Fairchild and Baker, 2012). The fragment located between depths of 110 mm and 340 mm has the faster sedimentation rate and comprises ca. 50% of the whole flowstone profile. This fragment has been crystallized for over 120 ka, from 740 ka to 620 ka, which was during the late MIS 18, MIS 17 and MIS 16. MIS 17 is considered to be a relatively weak interglacial period, while MIS 16 is one of the strongest glacial periods over the last 800 kyr (Lang and Wolff, 2011). Calcite fabrics from this part of the flow-stone also indicate conditions that are favourable for speleothem growth (constant water delivery and thick water film; Table 1). On the other hand, breaks in deposition (H1 and H3), which are determined both in the macroscopic and numerical analyses, are dated during weak interglacial periods (MIS 13 and MIS 19). The fast growth rate during MIS 16 and the deposition breaks during the interglacials suggests the crucial role of precipitation amount (and water film thickness) in controlling the growth rate. The dominant role of aridity in the cessation of speleothem growth has also been described for younger sediments in other regions of Europe (Stoll et al., 2013).
Climate change recorded in the speleothems
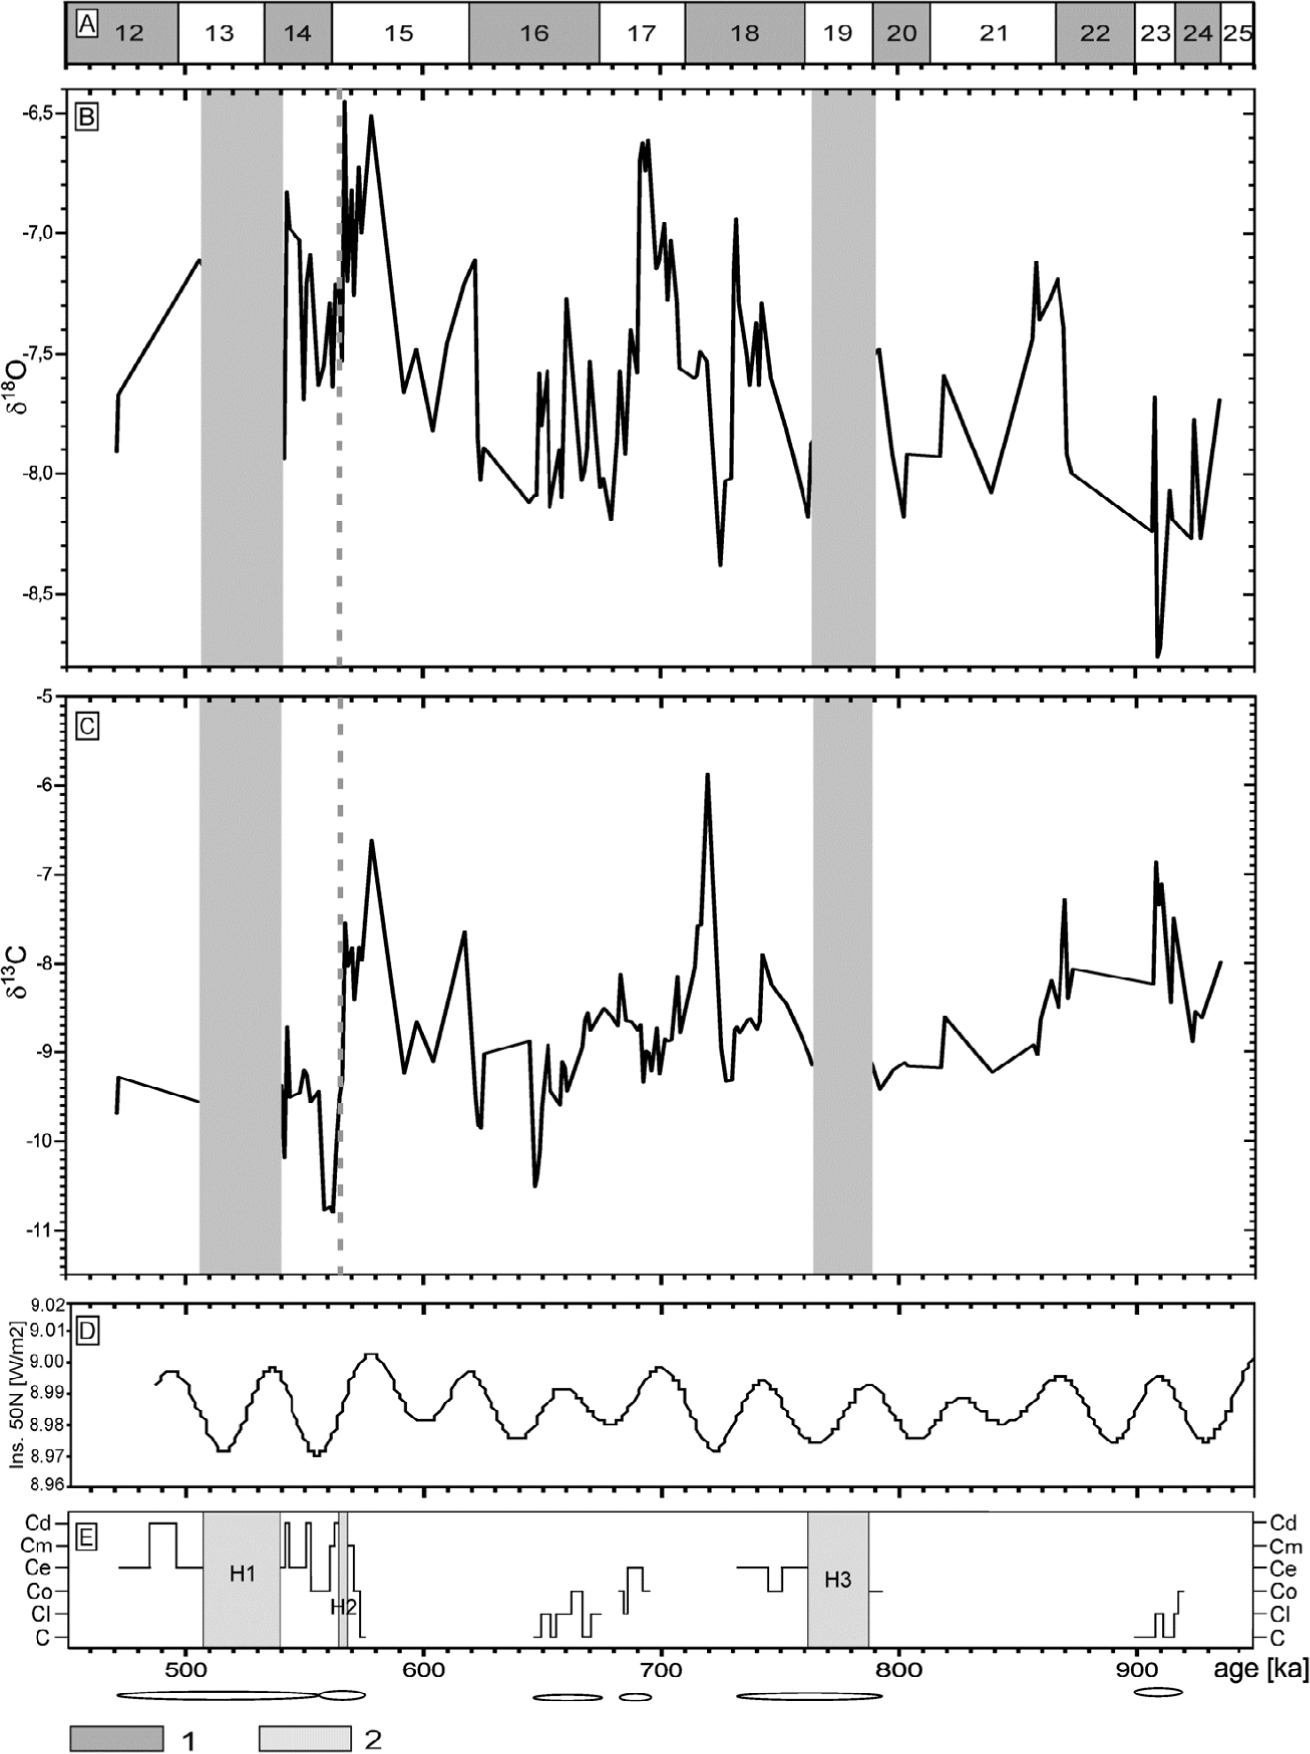
Results of the isotopic measurements show high variability in the environmental conditions during the formation of the studied flowstone. The time range of the isotopic record spans from MIS 24 to MIS 12 (Fig. 7A). The oldest record in the flowstone is characteristic of a cold period with low vegetation (MIS 24). However, this period was warm and humid enough to enable the start of flowstone crystallization. The final part of MIS 22 was characterized by relatively higher temperatures and a rather smooth transition into MIS 21 (e.g., Hernández-Almeida et al., 2013). Additionally, the results of the microfacies analysis confirm the variability of the environmental parameters during the analyzed time. Initially, the observed columnar open fabric is later replaced by columnar compact and sometimes with faint laminae (Fig. 7B). This probably indicates the transition from a thicker film of fluid with faster water supply rate during a short period of time (potentially connected with thawing conditions) to a thin film of water with a relatively low water delivery rate and enhanced ventilation (Kendall and Broughton, 1978; Frisia, 2015). Since approximately 850 ka, the flowstone record has shown a gradual transition into a period of warmer temperatures with lush vegetation (i.e., a gradual increase in the value of δ18O and a decrease in δ13C); this transition corresponds to MIS 21. The MIS 20 is weakly visible in the isotopic records, while MIS 19 is correlated with significant discontinuities (Fig. 7). A hiatus (H3) and the corrosion of an older part of the flowstone are clearly visible in the thin section. After this episode, the δ18O values show a gradual increase, while δ13C values are low. This indicates improved climatic conditions with high soil activity, developed vegetation and warmer temperatures (Fig. 7C). After the hiatus episode, the thin section shows a transition towards an elongated columnar fabric, which is associated with relatively turbulent flow. Turbulent flow prompts degassing, increases the calcite precipitation rate and promotes the incomplete coalescence of crystals and the development of linear inclusions (Turgeon and Lundberg, 2001). Then, a short episode of rapid changes occurs near 720 ka. This episode corresponds to a later stage in MIS 18 and is recorded as a rapid increase in δ13C compared with a rapid decrease in δ18O. MIS 18 is considered to be a glacial period that is divided by warmer episodes (e.g., Alonso-Garcia et al., 2011). In comparison with other colder episodes, MIS 18 is characterized by relatively high temperatures and humidity, which is reflected in the fast deposition rate. In Poland, as evidenced by pollen and paleosoil records, this period is included in the Podlasian interglacial (Marks et al., 2016). After this episode of rapid climate depletion, the isotopic record shows a constant improvement in climatic conditions. The obtained age-depth relation shows a noticeable increase in the deposition rate. It is a period of higher soil activity and vegetation development with conducive conditions for the formation of cave deposits. Two thin sections correspond to this period. The first thin section is characterized by the presence of columnar microcrystalline and elongated fabric, and the other is mainly composed of columnar compact (Fig. 7B). By realizing that the development of columnar microcrystalline is typical in stalagmites from temperate regions characterized by marked seasonal contrasts in temperature, precipitation and vegetation activity (Frisia, 2015), it can be assumed that there has been an improvement in the conditions and transitions towards stable growth regimes and warm climates with persistent water films, which enable the undisturbed crystallization of large, well-formed crystals specific to columnar compact fabric. These results contradict earlier studies on the Middle Pleistocene glaciation range in Poland (Marks et al., 2016), which suggest that the studied area was glaciated during the so-called Sanian 1 glaciation. Even if we consider possibility that this region had nunatak areas or an ice-free oasis, the carbon isotopic signal suggests the development of vegetation different from that in tundras. The period with a relatively fast deposition rate terminated at approximately 620 ka. The period with a slower deposition begins with a simultaneous increase in δ13C and δ18O values, which is evidence of relatively high temperatures and the deterioration of conditions suitable for soil and vegetation development. This leads to episodes of depositional breaks (hiatus H2) at approximately 565 ka at the end of MIS 15. This hiatus is short and is not identified by the age-depth model. Next, a cessation in deposition is dated from approximately 540 ka to approximately 505 ka (MIS 13). Again, the period preceding the break in deposition, as derived from the isotopic record, is relatively warm but arid. Similar conclusions can be drawn from the analysis of petrologic features in the flowstone. The part of the microstratigraphic log corresponding to this period records the transition from the Cc to the Cm fabric, which can be interpreted as a deterioration in sedimentary conditions connected with the hiatus. The fabric characteristics under destructive conditions are divided by fabric type connected with the formation of transitional basal crystals. The last thin section has similar characteristics. It is a record of alternating conditions, including the initial growth of the fabric, the episodes of cessation, and the crystallization or even the destruction of the flowstone. Such characteristics during this period result in the slowest growth rate in the top part of the flowstone (Fig. 7B). That is probably an evidence of the deterioration of conditions and interruptions in the feedwater source. It may also be connected to local perturbations in the seepage route between the epikarst and the cave. Anyway during that period the crystallization of the examined flowstone was finally ended.
Fig. 7
The variability of δ18O (B) and δ13C (C) isotopes, with marked discontinuities in the surfaces, along with oxygen isotope stages (A), insolation at 50°N (D) and a fabric log (E) with marked as ellipsoids locations of thin sections on the timescale.. 1 – discontinuities in the surfaces; 2 – boundaries of oxygen-isotope stages (Lisiecki and Raymo, 2005).
In summary, the analyzed record contains a clearly visible succession of marine isotopic stages from MIS 24 to MIS 12 (Lisiecki and Raymo, 2005; Martin-Garcia et al., 2015). The detected ages of the hiatuses in the flowstone from the Głęboka Cave correspond to MIS 13, MIS 15 and MIS 19. The hiatuses correspond to periods of deteriorating sedimentary conditions and, consequently, the cessation of flowstone crystallization and its partial erosion. Clearly, all recorded hiatuses occur during interglacial periods, which suggests that a major factor controlling the flowstone growth rate is the precipitation amount. The smaller role of temperature in this process confirms that the relative strength of cold periods in the Middle Pleistocene is significantly weaker than that during the last 400 ka. Eventual cooling does not cause flow-stone growth cessation; it even favours its deposition by increasing the humidity of the climate, at least in Central Europe.
. Conclusions
Because the flowstone was older than the method limit, the use of the U-Th method only allowed for the estimation of the flowstone age at 0.5–1.2 Ma, and applying OIS as a tool for speleothem dating enabled the establishment of a precise chronology for the flowstone (from 935 ± 5 ka to 470 ± 5 ka).
Consistency with North Atlantic records proves that the climate was also controlled by the NAO.
The calcite fabric analysis was a useful tool for the reconstruction of growth stability regime, temperature, the presence and thickness of water films, and the identification of the pediods when the crystallization was interrupted and/or the flowstone was partially eroded.
The analysis of stable isotope variability combined with the chronology obtained by oxygen stratigraphy allowed for the estimation of climate changes in the vicinity of the Gleboka Cave during the crystallization of the flowstone.
The isotopic record time range spans from MIS 24 to MIS 12, and crystallization during MIS 18 and MIS 16 proves that speleothems can also grow also during cold oxygen isotope stages.
All recorded hiatuses in the flowstone from the Głęboka Cave occurred during interglacial periods, which suggests that the major factor controlling the flowstone growth rate is the precipitation amount.
Cold periods in the Middle Pleistocene did not always cause the cessation of speleothem growth in Central Europe, but they favoured deposition by increasing the humidity of the climate.