
. Introduction
During the Pleistocene period, the Earth’s climate has been dominated by ice age cyclicity, long cold periods (glacials) have been interrupted by shorter and warmer intervals, known as interglacials. The duration of the last interglacial (LIG) has conventionally been set at 129–116 ka based on sea level variations and marine records (Martinson et al., 1987; Dutton and Lambeck, 2012; Masson-Delmotte et al., 2013; Pedersen et al., 2017). In marine sediments, the LIG is defined as Marine Isotope Stage (MIS) 5e (Shackleton, 1969). The LIG in continental Europe was defined as the Eemian; however, the Eemian does not cover the MIS 5e period (Otvos, 2015). The Eemian should be defined as the MIS 5e optimum (Govin et al., 2015). In comparison to the Holocene, the LIG climate was unstable. Several short events, connected with changes in moisture are observed in European records and Atlantic cores (Oppo et al. 2006; Couchoud et al., 2009; Regattieri et al., 2014). Possible explanation for this instability is changes in the North Atlantic Meridional Overturning Circulation (AMOC) dynamics (Regattieri et al., 2014). The climatic mechanisms and sequence of LIG events are only partially known (Cheng et al., 2009; Masson-Delmotte et al., 2010; Landais et al., 2013). For many archives like: ice cores, marine and lake cores, the main difficulty is reliable dating; those archives may not meet the specific requirements of radiometric dating techniques, also it may be difficult to find benchmarks with precise age, like tephra layers or magnetic excursions. Therefore, many LIG chronologies are based on indirect approaches, such as record alignment strategies (Govin et al., 2015). Speleothems are valuable archives because of their capability to be dated by the U-series method (Fairchild and Baker, 2012). In Europe, LIG speleothem records are mostly known from the western and central regions of the continent (Linge et al., 2001; Holzkamper et al., 2004; Drysdale et al., 2005, 2007, 2009; Munoz-Garcia et al., 2007; Meyer et al., 2008; Couchoud et al., 2009; Boch et al., 2011; Genty et al., 2013; Regattieri et al., 2014; Moseley et al., 2015; Vansteenberge et al., 2016; Demeny et al., 2017). Additionally low resolution speleothem isotopic (δ18O, δ13C) records from Romania were reported by (Lauritzen and Onac 1999). In this study, we present speleothem isotopic (δ18O, δ13C) and trace element records from the Bulgarian Orlova Chuka Cave. This is the first high-resolution isotopic record from LIG speleothems obtained in the region of southeastern Europe. This region is especially interesting for LIG climate studies because of the possible influences of Atlantic circulation, the Mediterranean Sea and Levant region.
. Cave settings and material
Orlova Chuka is one of the best-known caves in Bulgaria. This cave is located in Ruse Province in the northeastern part of the country (Fig. 1A). The present climate of the Ruse region is continental, with warm summers (+22.4°C average temperature for July) and relatively cold winters (–1.3°C average temperature for January). The yearly average temperature is +11.2°C. The precipitation is relative stable during the year. The difference between the driest month (March) and the wettest (June) is 42 mm. The yearly average precipitation is 585 mm. Currently, the Atlantic and Mediterranean circulation exert the main influences on the climate in this region (Malcheva et al., 2015; Nojarow, 2018). Present winter precipitation depends on Meditererranean cyclones, when they pass on more northwest the winters are softer with subnormal precipitation, when those cyclones passes on more southern ways the winters are colder with greater precipitation (Malcheva et al., 2015). The summer conditions depend from the proportion between northward and eastward transport of moisture. Domination of northward direction leads to warmer and dryer summers (Nojarow, 2018).
Fig. 1
Sample locations: A – Orlova Chuka Cave location; B – Sketch of the Orlova Chuka Cave basing on material from official cave web page www.dvemogili.bg; C – Cross section of the Orlova Tchuka Cave sediments; D – Ocz-6 sample.
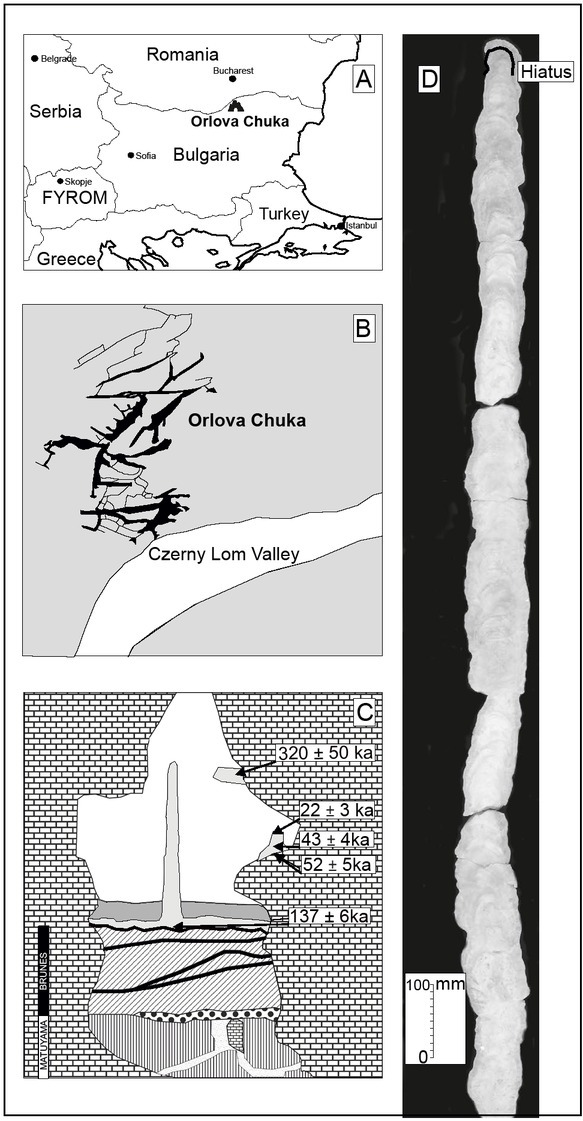
The cave entrance is situated on the northeastern slope of the Cherni Lom river valley, which is 150 m above sea level (Evlogiev et al., 1997). The cave system is situated just below the old river terrace ca. 60 m above the present level of the Cherny Lom River. This terrace corresponds to erosional surface formed during the Pliocene ca. 2.59 Ma on the southern margin of the Dacian Basin (Evlogiev, 2000). Orlova Chuka is a network maze cave comprising sub-horizontal passages with the total length of 13,437 m (Fig. 1B). The morphology of the cave passages suggests their phreatic origin. Presently, the cave passages are filled with cave sediments that reach approximately two-thirds of their height. Flowstone hanging ca. 1.5 m above the present sediment surface suggested that in the past, almost the entire cave passage was filled with cave sediments. The cave sediments in Orlova Chuka were investigated in a pit located 20 m from the cave entrance (Evlogiev et al., 1997). The sedimentary profile contains several types of rocks: weathering detritus, aeolian silts, thermoclastic fragments and speleothems (Fig. 1C). The Brunhes/Matuyama (0.78 Ma) boundary is located at a depth of 1.20 m in this sedimentary sequence (Evlogiev et al., 1997). The clastic profile is covered by the flowstone layer (Fig. 1C). The archival U-series alpha spectrometry dating of the flowstone base yielded an age of 137 ± 6 ka (Fig. 1C). The studied stalagmite (ocz-6) grows up from this flowstone layer. The flowstone layer is covered by aeolic sediments whose age is most likely Vistulian (Fig. 1C). Ocz-6 is a ca. 1,650-mm-long columnar stalagmite with a diameter of ca. 80 mm (Fig. 1D). It mainly consists of a ca. 1,630-mm-long section of continuous growth and one narrow upper layer that is approximately 20 mm high (Fig. 1D). Both layers are separated by a speleothem growth break period (Fig. 1D hiatus). The ocz-6 stalagmite comprises several types of calcite that exhibit different colors, detrital material admixtures, porosities and other calcite crystal features. Most of the stalagmite comprises compact, light yellow and delicately laminated calcite. Only the section from 180 to 610 mm above the base has higher porosity.
. Methods
Petrography
Eight thin sections were collected along the growth axis of ocz-6 stalagmite from places with different macroscopic characteristic of the calcite. The main goal of microscopic observation was to study the typical microstructures of the stalagmite, such as fabric types, microscale discontinuities, porosities and inclusions. These microscopic observations were obtained using the Nikon Eclipse LV100POL microscope from the Institute of Geological Sciences at the Polish Academy of Sciences (Warsaw, Poland). The analyses and descriptions of the speleothem fabrics were based on the methodology proposed by Turgeon and Lundberg (2001) and Frisia (2015). As a result of the calcite fabric analysis, it was possible to briefly characterize the conditions that occurred during stalagmite precipitation (Turgeon and Lundberg, 2001; Frisia, 2015).
U-series dating and age-depth model construction
A series of 0.1–0.5 g calcite samples were obtained by drilling along the growing layers. The average thickness of each drilled sample was 2 ± 0.2 mm. The chemical procedure of U and Th separation was performed at the U-series Laboratory of the Institute of Geological Sciences, Polish Academy of Sciences (Warsaw, Poland). First the samples were treated by high temperature for decomposition of the organic matter. The isotopic spike (233U, 236U, 229Th) was added to the samples before the chemical procedure. Samples were dissolved by nitric acid during chemical procedure. Finally uranium and thorium were separated from carbonate matrix by the chromatographic method (TRU Resin). Internal standards and blank samples were treated by the same procedure as all studied samples. The measurement of U and Th isotopic compositions of all samples and standards was performed at the Institute of Geology of the Czech Academy of Sciences (Prague, Czech Republic), by a double-focusing sector-field ICP mass analyzer (Element 2, Thermo Finnigan MAT). The instrument was set on a low mass resolution (m/Δm ≥ 300).
Obtained results first were corrected for background counts and chemical blanks and finally are reported as the activity ratios. U-series ages were calculated based on measured 230Th/234U and 234U/238U activity ratios using the newest decay constants (in yr–1): λ238 = (1.55125 ± 0.0017)∙10–10 (Jaffey et al., 1971), λ234 = (2.826 ± 0.0056)∙10–6 (Cheng et al., 2013), λ232 = (4.95 ± 0.035)∙10–11 (Holden, 1990), and λ230 = (9.1577 ± 0.028)∙10–6 (Cheng et al., 2013). The age errors were calculated with taking into account all uncertainties using error propagation rules. Isotope of 232Th is an indicator of potential contamination of the sample by thorium and uranium from non-calcite source. Previously, for α spectrometry data, value of 20 for 230Th/232Th activity ratio was considered as a border value for clean samples. However higher detection ability of mass spectrometry moves this value up to 200–300 (Hellstrom, 2006). Samples with lower 230Th/232Th ratio should be corrected. Basically there are two groups of correction methods. First group of methods bases on arbitral assumption of initial 230Th/232Th ratio in contaminant (B0). The second group of methods, like isochrones or method proposed by Hellstrom (2006), assumes that initial 230Th/232Th ratio can be calculated from the model. We decide to use modified algorithm proposed by Hellstrom (2006). Obtained ages were corrected with assumption of initial sample contamination by 230Th, 234U, 238U isotopes. The algorithm was searching for possible the lowest initial contamination ratios (B0, U1, U2) values which were able to correct series of ages in stratigraphic order. Based on the U-series dating results, an age-depth model was created using the MOD-AGE algorithm (Hercman and Pawlak, 2012). The age and depth values are described as normal distributions, and the LOWESS technique was used to estimate age-depth relationships. The SPAN value defines how many data points are used to estimate the age value of every single point (see Cleveland, 1979). In general, higher values of SPAN produce smoother models. The chosen SPAN value for the LOESS model was 0.38, which represented the highest value of SPAN which allowed the estimation of an age-depth model corresponding to all data points inside the 2σ error band (Hercman and Pawlak, 2012).
Stable isotopes
The samples used for stable isotope analyses were drilled using a Dremel with a drill bit diameter of 0.5 mm. All samples for isotopic profile were taken directly from axial part of stalagmite at approximately 2.0 ± 0.2 mm increments from the stalagmite base at 0 mm to the discontinuity at 1,630 mm, producing 798 samples. Additionally, four profiles were sampled along the growing layers at different distances from the stalagmite base, i.e., profile I at 122 ± 0.2 mm; profile II at 834 ± 0.2 mm; profile III at 1,016 ± 0.2 mm; and profile IV at 1,528 ± 0.2 mm (supplementary Fig. S1). The isotope ratios of δ18O and δ 13C were measured using a Thermo Kiel IV carbonate device connected to a Finnigan Delta Plus IRMS spectrometer in dual inlet mode at the Stable Isotope Laboratory of the Institute of Geological Sciences, Polish Academy of Sciences (Warsaw, Poland). CO2 was extracted from calcite using orthophosphoric acid (density: 1.94 g/dm3) at 70°C. The international standard NBS-19 was analyzed after every ten samples. The isotope ratios were reported as delta (δ) values and expressed relative to the VPDB standard. Oxygen and carbon analyses yielded measurement precisions of 0.1‰ and 0.05‰, respectively (1 standard deviation).
Trace elements
The trace element compositions were analyzed by LA-ICP-MS at the Institute of Geology of the Czech Academy of Sciences (Prague, Czech Republic) using an Analyte Excite Excimer Laser Ablation System with a wavelength of 193 nm and an Element 2 inductively coupled plasma mass spectrometer (Thermo Finnigan). Using a laser output of 50% with 10-Hz pulses, we achieved a fluence of 2.44 J/cm2. The width of each line was 50 μm, and the laser speed during each scan was 5 μm/s. Additional details of the LA-ICP-MS analytical procedure were described by Eggins et al. (1997).
The analyses of near-surface trace elements, namely, Mg, Sr, Zr, Ba, Na, P, Si, Cr, Mn, Fe, Al, Cu, Zn, Ni, U and Th, were performed at low and medium resolution. The laser ablation has been done continuously along the profile line with average sampling resolution of 3μm for medium resolution and 6 μm for low resolution. The trace element content obtained from laser ablation analyses were normalized to Ca content. The profiles were measured along the longitudinal growth axes in six thin sections.
. Results
Petrography
The ocz-6 stalagmite comprises five different types of calcite hereafter designated as: A, B, C, D, and E types (Fig. 2). The main part of the ocz-6 stalagmite is dominated by alternating types A and B (Fig. 2). Type A is a compact light yellow calcite with very delicate laminations that are most likely related to changes in the sizes of crystals and changes in the amount of inclusions. A typical columnar compact fabric is dominant, and it exhibits narrow overlays of the columnar open fabric (Figs. 3A, 3B). Its porosity and level of detrital contamination are low. Type B has a milky white color without lamination. It is characterized by a higher porosity than type A but does not exhibit detrital contamination. The observed fabrics are mainly alternating columnar open and columnar compact fabrics (Figs. 3C, 3D). Medium-grained calcite crystals are elongated perpendicular to the boundaries of layers. Type C is mostly located between 180 and 610 mm from the base marked on Fig. 2 as a porous zone. It is distinguished by its very high porosity, with pores up to several mm in size that are much larger than those in the other parts of the stalagmite; in these pores, the presence of opaque minerals and traces of calcite crystals from younger generations are noticeable (Figs. 3E, 3F). The dominant microfabric is columnar open fabric. A portion of the stalagmite between 1,530 and 1,630 mm comprises type D, a light yellow calcite with slightly visible lamination. These layers differ in their
Fig. 2
Locations of identified calcite types in ocz-6 stalagmite. A, B, C, D, E localization of five different types of calcite distinguished in ocz-6 stalagmite 1 – The zone with disturbed U-series ages; 2 – Positions of thin sections; 3 – Stalagmite growth axis scale in mm.
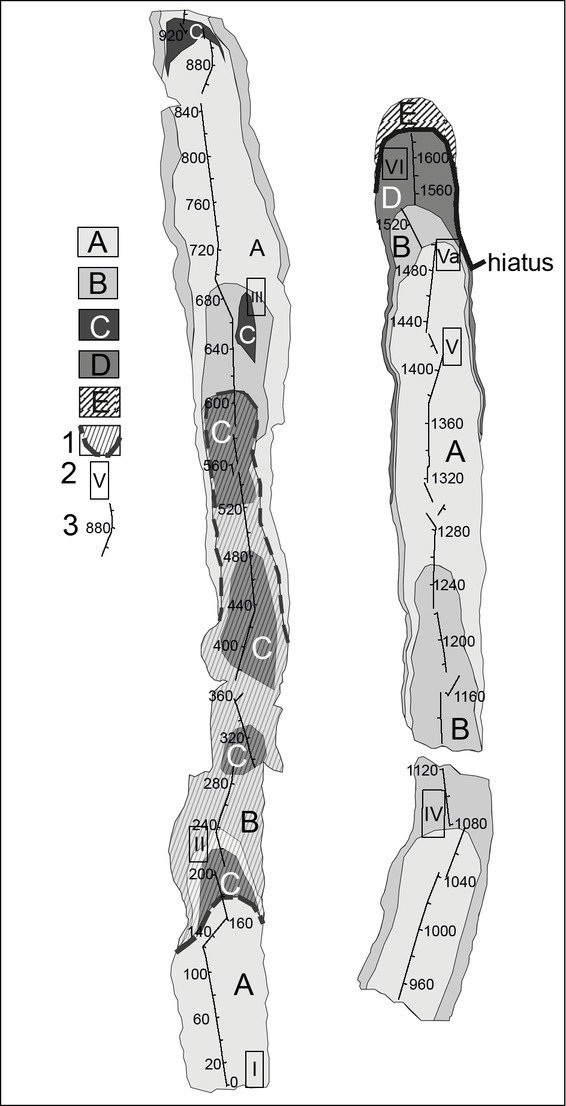
Fig. 3
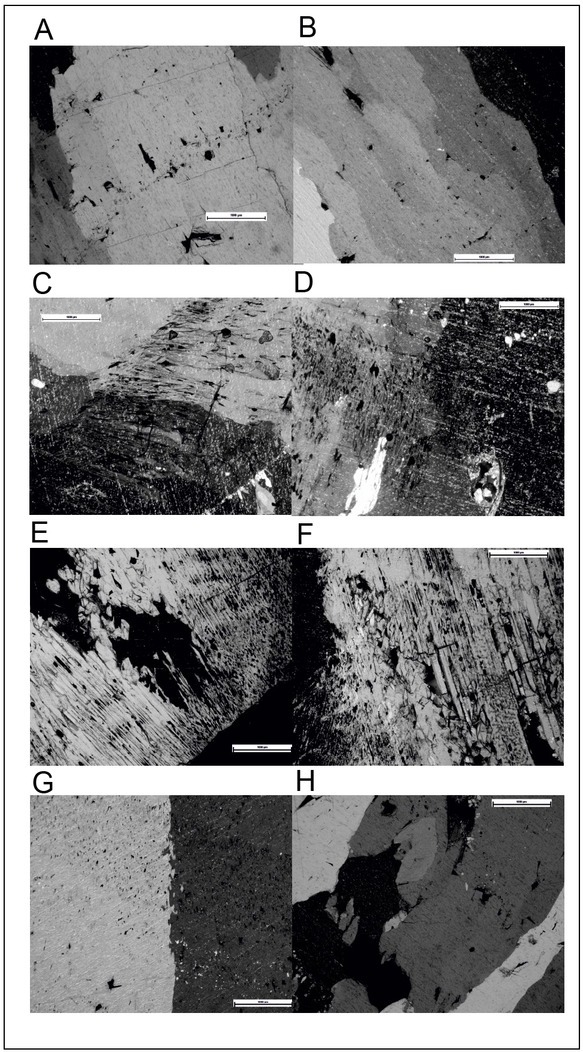
Microscopic photos of ocz-6 calcite types. A, B – photos from thin section I, in which the observed columnar compact fabric is dominant, with narrow overlays of columnar open fabric; C, D – photos from thin section II, in which observed fabrics are mainly alternating columnar open and columnar compact fabrics, and higher contents of detrital material were observed; E, F – photos from thin section III, exhibiting a very strongly porous zone; the dominant fabric is columnar open fabric, and in some pores, the presence of opaque minerals and traces of secondary mineralization are noticeable; G – photo from thin section VI; similar to photos A and B, the dominant fabric is columnar compact fabric; H – photo from thin section VI, documenting the transition zone between the columnar compact fabric and what is classified as columnar elongated fabric, where much thinner calcite crystals occur and the incomplete coalescence of crystals and a few impurity-rich layers were also observed.
transparency and porosity. The dominant microfabrics are columnar open and columnar compact fabrics (Fig. 3G). In the upper part, a fabric similar to a columnar elongated fabric is visible (Fig. 3G). In the layer below the hiatus, numerous pores were identified, and some are filled with secondary calcite crystals. The part of the stalagmite above the hiatus at 1,630 mm comprises type E, which is a light brown calcite containing the significant admixture of detrital material.
The characteristics mentioned above are similar to those described by Turgeon and Lundberg (2001), Frisia (2015), which indicates that columnar fabric is dominant in this stalagmite. Petrographic observations revealed the occurrence of several types of columnar fabrics: elongated crystals fabrics reflect competitive growth, with the incomplete coalescence of crystals and length to width ratios of greater than 6:1, which sometimes exhibit lateral overgrowth; compact fabrics form when the crystals form a compact aggregate and the intercrystalline porosity is no longer discernible; and open fabrics are characterized by the presence of linear inclusions or pores (Frisia, 2015).
U-series
Samples used for U-series dating were collected uniformly along the stalagmite growth axis. The analysis of the obtained results indicated a problem with the dating of the lower part of the stalagmite. For section from ca. 180 to 610 mm from the base dating results were scattered randomly in the range of 118–127 ka, with several age inversions. Detailed microscopic observations revealed numerous traces of secondary alterations and high secondary porosity with younger calcite fills in this zone (Fig. 3). Despite several attempts to precisely select material for analysis (e.g., using binocular microscopy), no reliable results were obtained from this part of the stalagmite. Therefore all dating result and other geochemical proxies from this part of stalagmite have been excluded from the further interpretation. Finally, a series of 13 reliable results were obtained from the non-porous part of the stalagmite. The U-series dating results are presented in Table 1. The reported errors represent 2 standard deviations and they vary from 1 to 2%. Although no samples showed visible detrital contamination at the dissolution stage, the measured isotope ratios were corrected for minor amounts of initial U and Th using 232Th as a contamination index. The modified Hellstrom (2006) algorithm has been used. In all cases, the corrected ages are within the error range of the un-corrected ages.
Table 1
Results of the U-series dating of stalagmite from Orlova Chuka Cave. Reported errors are 2σ.
Based on the U-series dating results, an age-depth model (Fig. 4A) was created from the ocz-6 base at 0 mm to its hiatus at 1,630 mm. Layer E, which is located above the hiatus (Fig. 2), contains detrital material; thus, its dating is problematic. However, the archival U-series age (not included into main age-depth model) obtained by α spectrometry shows that the age of that layer is MIS 4. The dates are shown as 2σ error ellipsoids (based on MC
Fig. 4
Results of U-series dating. A – Age-depth model; B – Linear approximation of deposition stages; C – Ocz-6 stalagmite growth rate; 1, 2, 3, 4, 5 – Distinguished phases of stalagmite deposition with corresponding growth rate estimations.
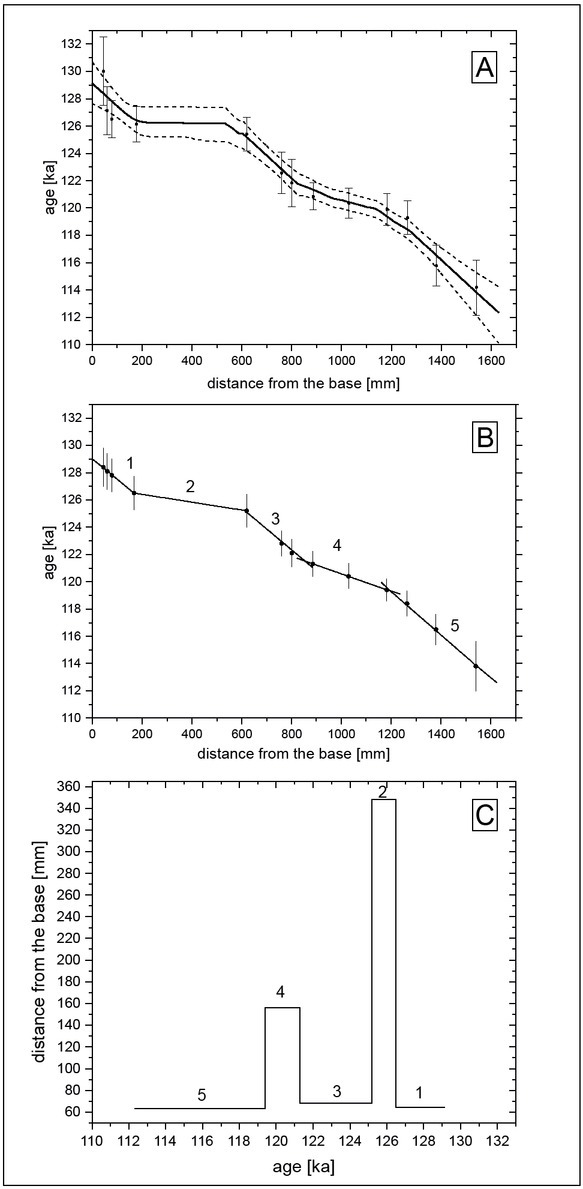
simulations; Hercman and Pawlak, 2012). Black lines represent the best age estimates, with outlying lines indicating the 2σ uncertainty bands. According to the obtained age-depth model, the deposition of the stalagmite started ca. 129 ± 1.5 ka, and growth termination occurred ca. 112 ± 1.8 ka. The age-depth model obtained for the ocz-6 stalagmite shows several changes in the stalagmite growth rate (Fig. 4B) ranging from 65 mm/ka to 350 mm/ka. Based on differences in the stalagmite growth rate, the 5 phases of its deposition can be distinguished (Fig. 4C). Phase 1 from ca. 129 to ca. 126.5 ka; phase 2 from ca. 126.5 to ca. 125.5 ka; phase 3 from ca. 125.5 to ca. 121.5 ka; phase 4 from ca. 121.5 to ca. 119.5; phase 5 from ca. 119.5 to ca. 112.
According to obtained age – depth model ocz-6 stalagmite deposition rate was around 68 mm/ka during most of the time of its crystallization (Figs. 4B, 4C). There are two periods of time 126.5–125.5 ka and 121.5–119.5 ka, when deposition rate was higher up to 350 mm/ka. Based on differences in deposition rate, five stages of ocz-6 deposition can be distinguished (Figs. 4B, 4C). Deposition rate is often used as an important factor controlling the development of the calcite micro-fabrics (Frisia et al., 2003). However their morphology is also controlled by combination of other factors like: supersaturation, impurity content, Mg/Ca ratio in dripping water (Frisia et al., 2003). The ocz-6 stalagmite is built from three types of micro fabric: columnar compact, columnar open and columnar elongated in its upper part. The stages with slower deposition rate (1, 3 and 5) are built mostly from columnar compact fabric which suggests calm calcite crystallization under the regime of constant drip rate (Figs. 3A, 3B). Situation changes during the stages with faster deposition rate (2 and 4). The stalagmite in stage 2 comprises highly porous columnar open fabric (type C); more porous zones are associated with the conditions of relatively fast and changing dripping rates (Figs. 3E, 3F). Pores contain younger generations of calcite crystals and detrital contaminants. This all suggest crystallization under dynamic conditions. Stage 4 is built from columnar compact and columnar open fabric. The level of porosity is lower here and there is no trace of secondary calcite crystallization inside the pores. Stage 4 represents the environment of more dynamic crystallization than stages 1 and 3 but not as dynamic as stage 2. The upper part of stage 5 comprises a columnar elongated fabric and contains more detrital material (Fig. 3H). In summary the observed calcite micro fabrics are in accordance witch calculated changes in stalagmite deposition rate. The stages 2 and 4 records time of faster dripping rate than stages 1, 3 and 5.
Stable Isotopes
The isotopic records (δ18O, δ13C) along the growth axis have a mean temporal resolution of 0.022 ka.
Both the δ18O (–6.9‰ to –12.3‰) and δ13C (0.5‰ to –10‰) records exhibit significant variation. The oxygen δ18O record (Fig. 5, black line) starts with a decreasing main trend from ca. 129 ka to 127,5 ka, with an average decrease of approximately –0.15‰/ka. From ca. 127.5 ka to 126.2 ka, it strongly increases by +0.8‰/ka. After the porous zone from ca. 125,3 ka to 112,8 ka, it exhibits a decreasing trend, the average decrease is approximately – 0.25‰/ka. At the end of the record, the signal grows rapidly. In addition to the main trend, the δ18O record has a second-order signal with average amplitude of approximately 0.85‰. The δ13C record (Fig. 5, gray line) starts by decreasing with an average rate of decrease of approximately –0.15‰/ka; from ca. 125 ka to ca. 121 ka, it has stable mean value ca –11.4‰; from ca. 121 ka to 112.8 ka, this trend increases with an average increase of approximately 0.3‰/ka; at the end of the record, the
Fig. 5
δ18O (black line) and δ13C (gray line) records from the ocz-6 stalagmite. 1, 2, 3, 4, 5 –Distinguished phases of stalagmite deposition.
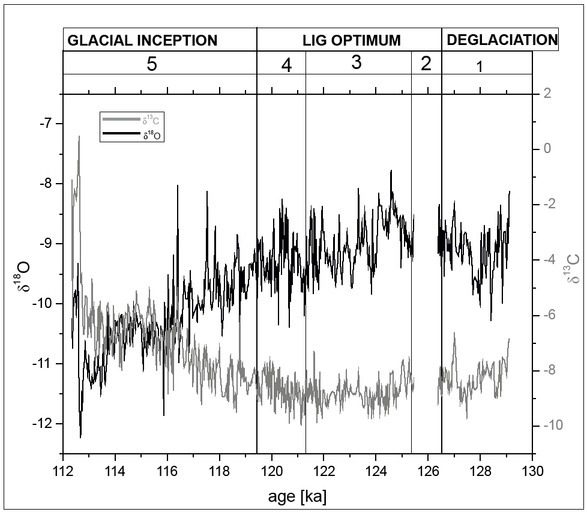
signal grows rapidly. Similar to the δ18O record, the δ13C record has millennial-scale fluctuations with average amplitude of approximately 1.5‰ and centenary-scale fluctuations with average amplitude of approximately 0.4‰.
Trace elements
Trace element profiles were measured along the stalagmite growth axes in six (I – VI) thin sections (Fig. 6). According to the age-depth model (Fig. 4A), the obtained trace element profiles cover six time intervals: I (129,2–128.3 ka); II (126.29–126.24 ka); III (124.35– 123.5 ka); IV (120.25–119.95 ka); V (116.15–115.35 ka); and VI (113.8–112.7 ka). Interpretation of profile II is omitted because it covers the porous zone. During the primary assess ment of trace element results we observed, that elements like: Mn; Zn; Cu and Ni repeats the Fe pattern, while Al and Zr behaves similarly to Si. Concentration of elements like U and Th was relative low and was dominated by the noise signal. Therefore we decided to take account only the clearly inked with environmental conditions: Sr; Mg; P; Na, and Fe, Si results which are representative for other elements.
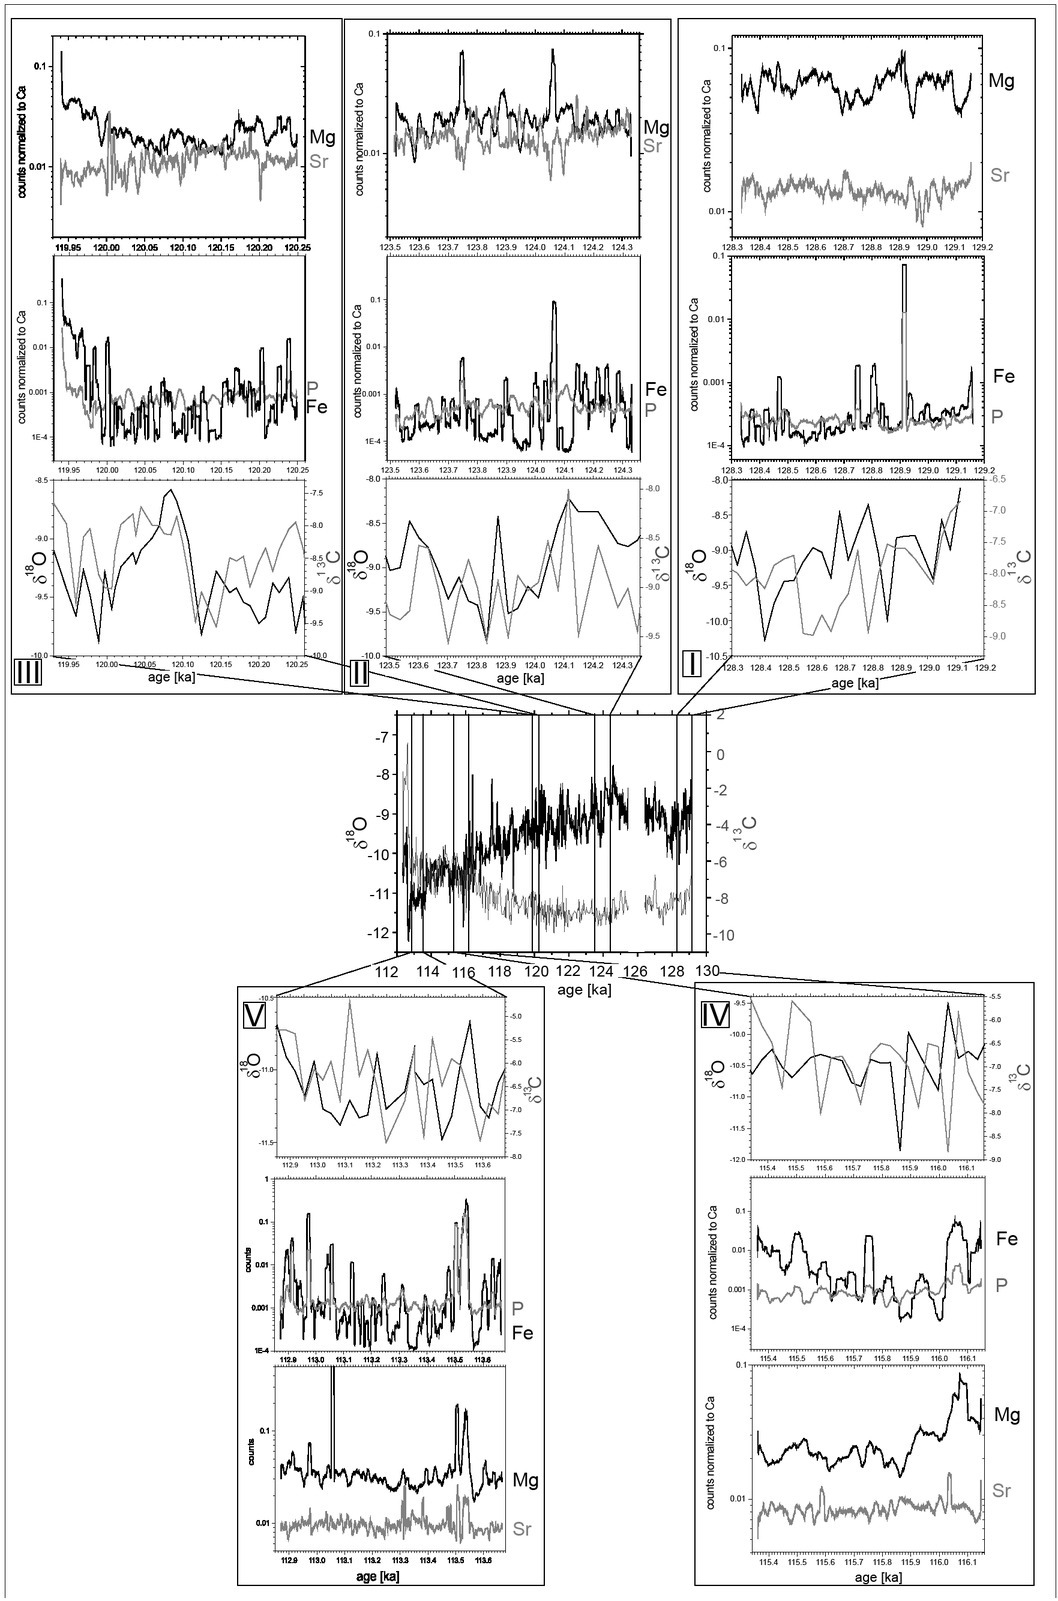
Sr content oscillates around 0.01 value in all measured profiles. In contrast to Sr, magnesium content changes more rapidly, its value oscillates between 0.01 and 0.1. Except the profile VI, Sr and Mg contents are in weak anti correlation mostly. Fe content in ocz-6 changes rapidly from 0.001 to 0.1 value. The Fe content at the beginning (profile I) and at the end of ocz-6 stalagmite (profile VI) is in correlation with δ13C (Fig. 6 V, VII). Amplitude of P content changes is lower than amplitude of Fe content changes. However it seems to repeat the same pattern as Fe (Fig. 6).
. Discussion
Suitability assessment of the ocz-6 stalagmite
Cave stalagmites are suitable source of paleoenvironmental data. However, stalagmite material must meet several requirements. First, speleothem calcite should precipitate under isotopic equilibrium conditions. Hendy tests are the classical tests used to ascertain whether equilibrium conditions were achieved during calcite precipitation
(Hendy and Wilson, 1968; Hendy, 1971). However, Hendy’s criteria have been revised (Dorale and Liu 2009). The concept of criterion (1) of the Hendy Test, sampling along a single growth layer may be flawed in both theory and practice. But the assumption that growing axis (central part of stalagmite) has higher probability for equilibrium conditions than flanks part of stalagmite remains true. Criterion (2) of the Hendy Test is based on the assumption that speleothem δ13C values react in a different way than δ18O values in response to climate changes. That assumption is not always correct. Dorale and Liu (2009) proposed replication test instead of Hendy’s Criterions. We were not able to made control isotopic profile from another stalagmite of the same age because of lack of suitable material from Orlova Chuka Cave. However results of classic Hendy’s Criterions shows no traces of disequilibrium for ocz-6 stalagmite (see supplementary Fig. S1).
The second requirement is that the stalagmite porosity should be low. Pores may contain younger generations of calcite or admixtures of detrital material. Both may disturb the measurement of uranium and thorium isotopic compositions, which can yield incorrect U-series ages. Macroscopic and microscopic analyses show that the ocz-6 stalagmite comprises elongated calcite crystals, which range from approximately 0.2 mm to 5 mm in width and 2 mm to 40 mm in length, and the porosity of these layers is low (Figs. 3A, 3B). However, there are zones (type C; Fig. 2) that have higher porosities visible on a macroscopic scale; most C-type calcite is located between 180 and 610 mm from the base (Fig. 2). Thus, any geochemical proxy from this part of the stalagmite should be interpreted with care. Therefore we decided to exclude all geochemical data (including the U-series ages) from this part of the record. Fortunately the age-depth model estimated for the ocz-6 stalagmite shows that this 430-mm-long zone formed in less than 1 ka.
Factors influencing on oxygen isotopic composition in calcite
The δ18O value of speleothem calcite depends on δ18O of dripping water and temperature in the cave. The δ18O of dripping water depends on the source of moisture, its transportation, the intensity of atmospheric precipitation and temperature (Darling, 2004; Lachniet, 2006). At the precipitation site the isotopic composition is modified by local conditions like temperature and amount of rainfall. However, meteorological observations show that in temperate regions of Europe, temperature changes have a stronger effect on precipitated water δ18O than changes in the amount of rainfall (Różański at al., 1993).The thermal gradient for calcite crystallization (δ18Oct/dt) varies from –0.18 to –0.23‰, while the thermal gradient for the δ18O of precipitated water (δ18Op/dt) ranges from +0.17 to +0.9‰ (Dansgaard, 1964; Różański et al., 1993; Lachniet, 2006). Therefore, the speleothem δ18O response to temperature is strongly site-dependent (Gascoyne, 1992; Dorale et al., 1998; Williams et al., 1999; Mangini et al., 2005). Observations from located in southern Romania Isverna Cave (Dragusin et al., 2017) show that present mean value for crystalizing speleothem calcite, in the region, is close to - 8‰. Present data from Isverna Cave have higher values of δ18O for calcite crystalizing in warmer months, it shows that thermal gradient for the δ18O in water is more important for a region. The δ18O value for local meteoric water changes from –15‰ in December to –4‰ in April (Dragusin et al., 2017). However April is not the warmest month in a region. Therefore fact that the April rain water has the maximal value of δ18O shows that not only the temperature but also other factors like the source of moisture and the way of its transportation plays the important role in shaping of δ18O composition of rain water here. Additionally this seasonal difference shows how strongly the mean year isotopic composition depends from the amount of rainfall during the seasons. Presently, the main source of moisture for a region is Atlantic on the west, a small amount of moisture is also transported from Mediterranean region on the south. The other possible sources are Black sea on east and norther sources like White and Norwegian Sea. (Malcheva et al., 2015; Dragusin et al., 2017; Nojarow, 2018). Dragusin et al. (2017) describes the abnormal heavy values of δ18O in rain for December, which was caused by complicated way of moisture transportation and accumulation of enriched in δ18O Mediterranean vapor. The Atlantic moisture can be depleted in δ18O because of lower average annual temperatures at evaporation site and longer, than for Mediterranean, way of transportation (continental effect).
Interpretation of climate conditions on the basis of geochemical data from ocz-6 stalagmite
The ocz-6 δ18O records starts with negative δ18O trend (Fig. 5). Since the temperature drop is not expected at the beginning of interglacial, the negative δ18O trend observed in ocz-6 record from ca. 129 to ca. 127.5 ka (Fig. 5) can be associated with changes in proportion of amount of moisture from different sources and may reflects continuous increase of depleted in δ18O moisture of Atlantic origin.
The decreasing δ13C trend, at that time, can be interpreted as a period of continuously increasing of soil activity what is expected at the beginning of interglacial period. Changes in vegetation cover and amount of rainfall is supported by trace elements content. The Mg and Sr content in speleothem calcite depend on factors like amount of rainfall and the water residence time. In the older part of the record, Mg and Sr exhibit weak anti-correlation. After 128.9 ka, several Mg peaks are in phase with Sr peaks (I; Fig. 6), it may suggest climatic cycles from wetter to dryer periods, when prior calcite precipitation was more intensive. The trace element profile (I; Fig. 6) shows systematic decreases in the Fe content. This trend is correlated with the δ13C decreasing trend. The P, Si and Na content (see supplementary Fig. S2) were lower during the time interval from 129.1 to 128.9 ka (Fig. 6I). In general, the Si content in drip waters are controlled by the supply of wind-blown silicates, the weathering rate, rainfall dilution, and the growth rate of calcite. A high Si/Ca ratio suggests dry climatic conditions (Geilert et al., 2014). After 128.9 ka, the Si and Na contents become stable, and the P content begins to increase. The main source of P is soil (Treble et al., 2003). During an interglacial period, changes in P content are usually interpreted as an indicator of changes in atmospheric precipitation (Treble et al., 2003). More intensive precipitation flushes more P out of the soil. However, during the developing phases of interglacial conditions, a systematic increase in the P content during a time of hundreds years can be interpreted as soil development indicator. This interpretation is in agreement with decreasing δ13C value (Fig. 5).
The positive shift for the δ18O value observed during the interglacial optimum ca. 125 ka can be interpreted as the improvement of thermal conditions. Since 127.5 ka to ca. 121 ka the δ13C has the lowest values. Low δ13C values and elevated δ18O indicate optimum climate conditions with warm temperatures, increased year-round precipitation and high soil biogenic activity. However, there are few indicators of climate instability during this period of time. The δ18O values fluctuate from –7.8‰ to –9.8‰. This short time changes are in phase with δ13C value changes. The events of lower δ13C values may suggest a faster rate of water seepage, which is a consequence of higher rainfall. Short time periods of low δ18O values suggests temperature drop during the wetter periods. Records of Sr and Mg content from climatic optimum are in anti-correlation mostly (II: Fig. 6). Thus may be indicator of increased rainfall and lack of priori calcite precipitation events at that time. It suggest wetter interglacial optimum than developing phase (II, III: Fig. 6).
Negative main trend for δ18O visible since ca. 124 ka, can be interpreted as slow decreasing of mean annual temperature. From 121 ka the δ13C value starts to grow, which is indicator of lowering soil activity. The increasing of δ13C value and decreasing δ18O suggest systematic worsening of environmental conditions. At that time that the like during interglacial optimum there are short time fluctuations of δ18O which are in phase with δ13C value changes. However amplitudes of those changes are higher up to 2.1‰ (Fig. 5), which suggests higher climate instability. The trace element profile shows elevated values of Sr, Mg and Fe contents at 116.1 ka. This pick of elevated trace element content corresponds to both δ13C and δ18O fluctuations, which are not in phase (Fig. 6 V). A similar event of elevated Fe, P, and Mg contents is visible at 113.5 ka (Fig. 6 VI). Evidence of such events suggests an environment with reduced vegetation cover, which can cause a low level of retention. Therefore, increased rainfall could generate a rapid increase of water inflow into the cave. Three trace element profiles (IV, V and VI) are associated with interglacial demise period (Fig. 6). The mean Fe content along those three profiles increases from 0.003 to 0.0121. The increased Fe content here may be the effect of increased weathering caused by soil degradation process. The reduction of vegetation cover under wet climatic conditions may indicate an increase of soil erosional processes. Similar Fe behavior connected with changes in P and Si content can be observed during stage 1.
The strong positive shift δ18O observed since 113 ka (Fig. 5) is connected with similar shift on δ13C. The δ13C proxy can be interpreted in the context of soil activity. The elevation in δ13C values is indicator of lower soil activity. The δ18O enrichment, in this specific case, can be interpreted as effect of higher evaporation due to dryer conditions. Therefore highly elevated values of δ13C and δ18O may be indicators of dryer climate which lead to final stop of calcite crystallization at ca. 112.5 ka.
Geochemical records discussed here represents the period of time from 129 to 112.5 ka. They show early stage of interglacial with systematic soil development. Its rather warm and wet optimum with noticeable climatic instability, connected with more wet and dry periods. The data shows slow worsening of thermal conditions since ca. 124 ka and slow degradation of soil since ca. 121 ka.
Comparison of data from ocz-6 stalagmite with other LIG records and global proxies
The number of LIG speleothem isotopic records from Europe and the Middle East is still low, and only several of them cover the entire LIG period (Linge et al., 2001; Holzkamper et al., 2004; Drysdale et al., 2005, 2009; Munoz-García et al., 2007; Meyer et al., 2008; Couchoud et al., 2009; Boch et al., 2011; Genty et al., 2013; Regattieri et al., 2014; Moseley et al., 2015; Vansteenberge et al., 2016; Demeny et al., 2017). Ocz-6 stalagmite (Figs. 7C, 7D) starts to grow at similar time like the most of the LIG stalagmites from Central and Western Europe (Demeny et al., 2017; Couchoud et al., 2009). In its older part, before 126.5 ka, the ocz-6 δ18O record has a similar trend as Mediterranean records, with a small decreasing trend till 127.5 ka and the lowest point close to 127.5 ka (Fig. 7A), while the Alpine δ18O records have opposite to ocz-6 δ18O record trend (Fig. 7E). At that time, the oxygen isotopic composition in the Alpine records was controlling by the proportion between water from glacier source and water from the rain source, which explain the lowest values at the begging of most from Alpine records (Moseley et al., 2015).
Fig. 7
Comparison of ocz-6 isotopic records with other LIG speleothem records: A – δ18O records from the Mediterranean region; B – δ13C records from the Mediterranean region (Bar-Matthews et al., 2003; Drysdale et al., 2005; Zumbühl, 2010; Nehme et al., 2015); C – δ18O records from Western and Central Europe; D – δ13C records from Western and Central Europe (Couchoud et al., 2009; Vansteenberge et al., 2016; Demeny et al., 2017); E – δ18O records from the Alps; F – δ13C records from the Alps (Holzkamper et al., 2004; Meyer et al., 2008; Moseley et al., 2015).
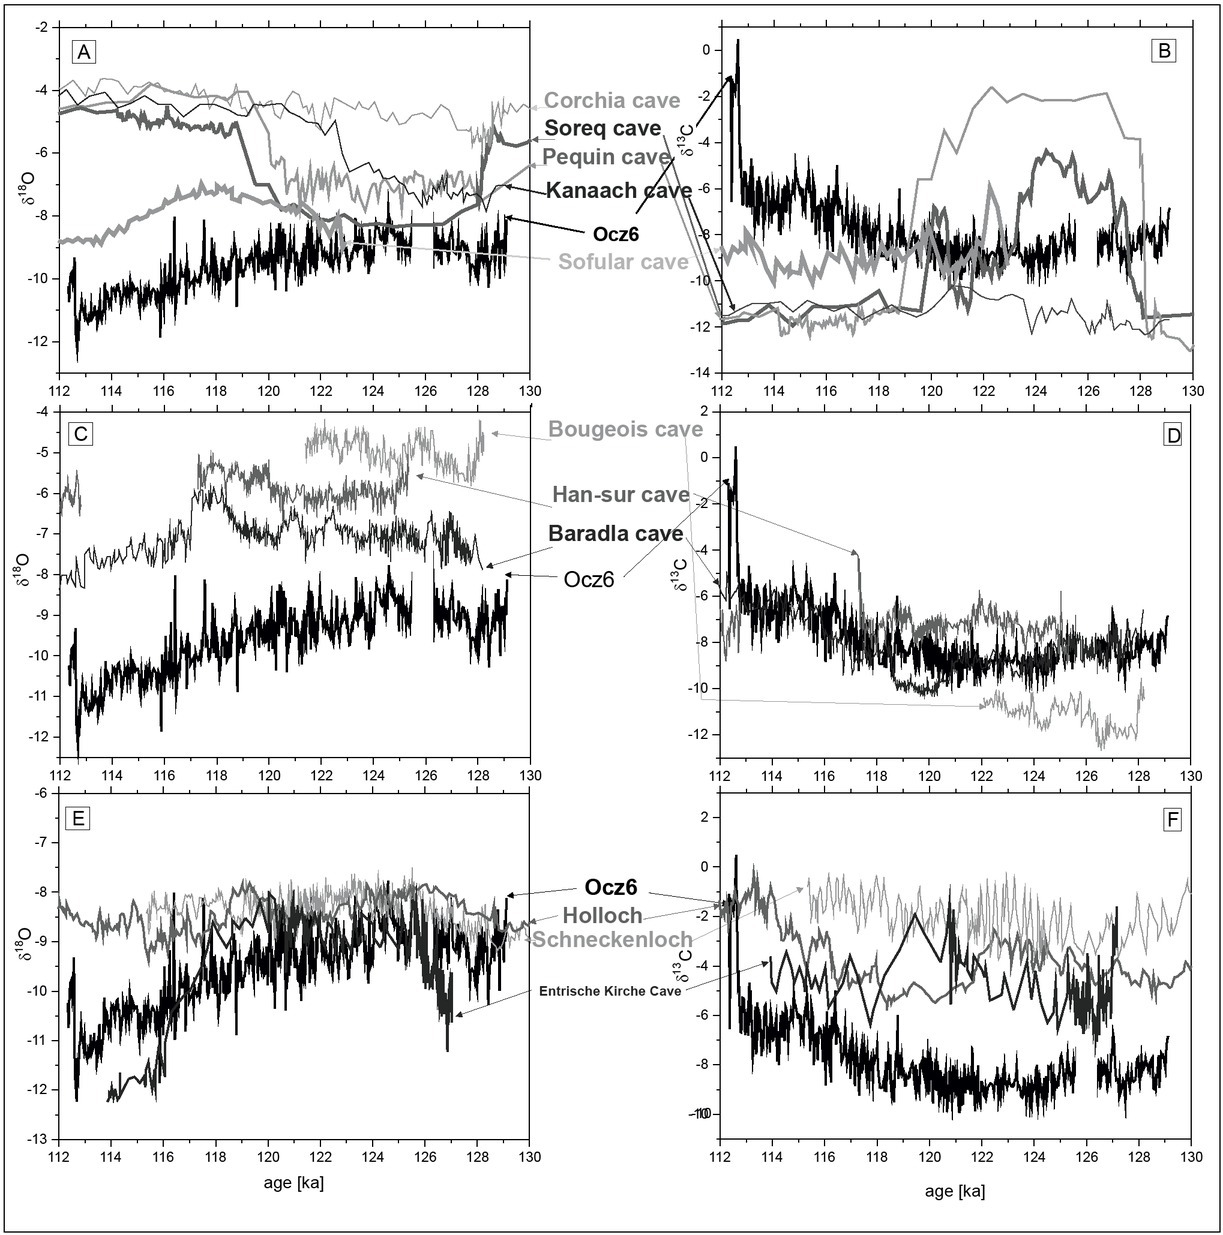
During the LIG optimum, the ocz-6 δ18O record has similar trend as records from western and eastern regions of Europe (Fig. 7). All those record show the clear picture of the time period, associates with LIG optimum, where regional differences become less important. The beginning of LIG optimum is characterized by increase in the δ18O values of the ocz-6 record (Fig. 7A), which corresponds with reaching of full interglacial conditions in Greece at that time, what was reconstructed basing on paleontological profile of the Ioannina basin (Tzedakis,
1994). Additionally foraminifera record from sediment core located in the Western Mediterranean Sea shows warm and probably humid event with maximum at about 125 ka (Kandiano et al., 2014). Pollen data analyze from a Black Sea region suggests well developed interglacial climate, for the period of time from 126.4 to 122.9 ka, with higher summer temperatures and mild winters. Typical interglacial thermal conditions were connected with higher annual precipitation (Shumilovskikh et al., 2013). Those data corresponds with positive shift for δ18O record of ocz-6 stalagmite. Data from Tenaghi Philippon peatland (NE Greece) suggested increased seasonality with arid summers and wet winters for the period of 128 to 123 ka (Milner et al., 2013). The δ13C behavior in ocz-6 stalagmite and stalagmites from East Mediterranean region is different. At the LIG optimum time, most of East Mediterranean stalagmites have elevated δ13C values (Figs. 7A, 7B). The elevated δ13C values here reflect arid conditions (Drysdale et al., 2005; Bar-Matthews et al., 2003). In opposition during LIG optimum period, the ocz-6 record has low δ 13C value which, together with δ18O and trace elements data, suggests humid conditions. The data from Western Europe suggest the climate instability during LIG optimum. Isotopic data from Southern France (Figs. 7C, 7D) are interpreted as fluctuations between wetter and dryer periods (Couchoud et al., 2009). Isotopic record from the Belgian Hansur-Lesse Cave shows similar humidity fluctuation in a period of time from 128 to 121ka (Vansteenberge et al., 2016). This climate instability is in accordance with the δ18O and δ13C fluctuations observed in ocz-6 record at that time.
Around 125 ka, the isotopic difference between the δ18O record from Hungarian Baradla Cave and ocz-6 δ18O records was the lowest, ca. 1‰. At that time the amount of rain precipitation from Atlantic source of moisture was probably high. Therefore we can expect continental effect on the line from west to east. Thus one per mille difference on the distance between Baradla and Orlova Chuka caves can be explained by the continental effect. Value of 1% on the distance ca. 500 km is in accordance with presently observed values of continental effect for Europe (Dansgaard, 1964). After the 124 ka, the isotopic shift between the Baradla and ocz-6 records increased slowly to almost 2.5‰ at 118 ka, while the isotopic difference between the Baradla δ18O record and the Western European records remained stable (Fig. 7C). After 124 ka, the trends of the ocz-6 δ18O record and Mediterranean slowly changes and become opposite. After the LIG optimum the difference between δ18O trend from ocz-6 record and Alpine record are the lowest. Both carbon and oxygen isotope record of ocz-6 stalagmite has a similar trend as the Alpine records. This suggests that the similar changes of climatic and vegetation conditions occurred in both regions.
The mechanism of increasing difference in δ18O composition, after the LIG optimum, between Western Europe, Alpine region, Ruse province and Mediterranean area is not clear. Baradla δ18O and δ 13C records have a positive isotopic shift of approxi mately 1‰ at the same time (Fig. 7C). This positive isotopic shift is interpreted as a dry period (Demeny et al., 2017). Record from Eifel maar lake (Germany) shows strong aridity pulse around 118.5 ka (Sirocko et al., 2005). It corresponds with has higher amplitude fluctuations of ocz-6 isotopic records between 119–116 ka.
The beginning of the LIG (Fig. 8) was characterized by increasing global sea level and summer insolation at 45 N (Dutton and Lambeck, 2012; Masson-Delmotte et al., 2013). W hole δ 13C record from ocz-6 stalagmite reflects the insolation data in the 45 N record (Fig. 8C), which is connected witch vegetation changes occurred during interglacial development, its optimum and demise. At the beginning of LIG optimum the δ18O GRIP record
Fig. 8
Comparison of ocz-6 isotopic records with global proxies: A – δ18O and δ13C records from ocz-6 stalagmite; B – δ18O record from GRIP core (Chappellaz et al., 1997); C – Summer insolation for 45 N (Davis and Brewer, 2008); D – Global sea level (Dutton and Lambeck, 2012).
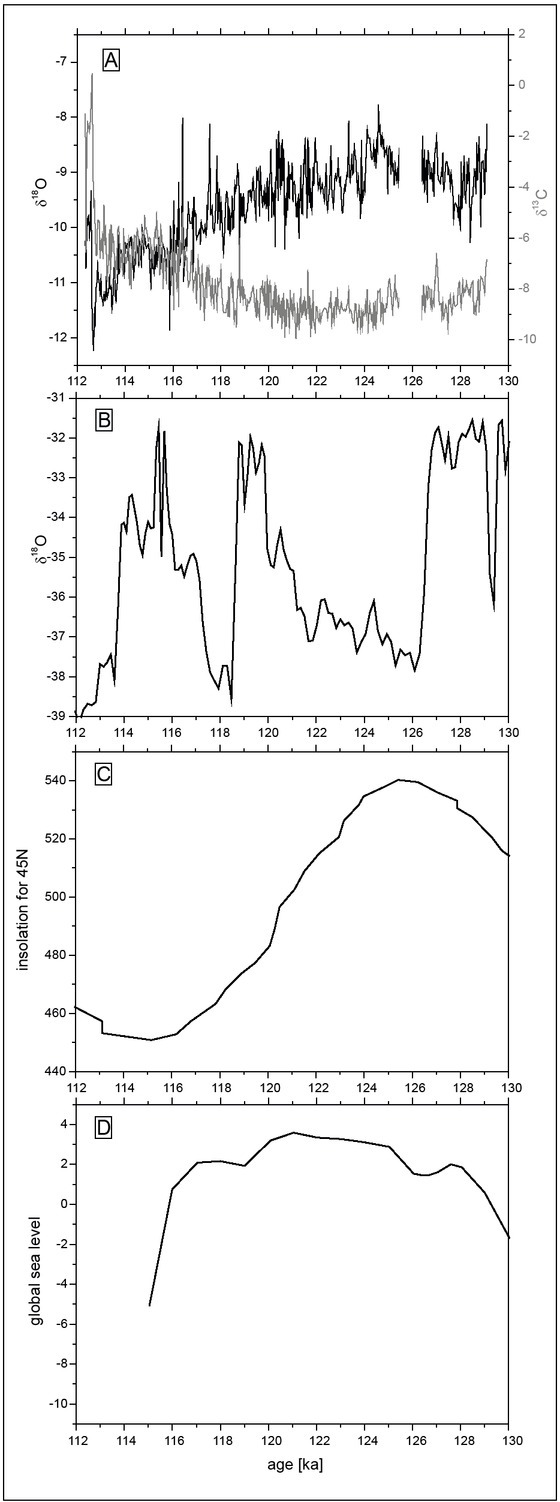
shows a rapid decrease of ca. 6‰. It corresponds with the recording period of rapid stalagmite grow stage II in ocz-6 stalagmite. The low values of δ18O GRIP record correspond with whole LIG optimum (Fig. 8B). The strong fluctuations of the GRIP record value after 120 ka are probably coincident with the widespread ice rafting in the North Atlantic occurring at that time (Oppo et al., 2006; Müller and Kukla, 2004). Ice rafting on North Atlantic could slow down the North Atlantic Current (Müller and Kukla, 2004). This period of time is associated with influxes of depleted in 18O water (Chappellaz et al., 1997), which is recorded in GRIP δ 18O record (Fig. 8B).This period of time is connected with observed in ocz-6 δ18O record higher amplitude fluctuations between 119–116 ka. Recent data interpretation of the early LIG suggests lower than present temperature for the North Atlantic (Stone et al., 2016). Therefore observed differences between Alpine record, ocz-6 and Mediterranean records can be explained by stronger influence of other than Atlantic sources of moisture in the eastern part of the continent. From the other hand observed differences in isotopic records may be caused by different thermal changes in the regions or influence of evaporation especially in Mediterranean region and waters from glacial source in Alps (Moseley et al., 2015). After 116 ka, the δ18O records from ocz-6 stalagmite and from most of European stalagmites, exhibits decreasing trends, while the δ13C values in those records increase. This reflects global cooling and changes in vegetation cover during the ending part of the interglacial.
. Final conclusions
The ocz-6 stalagmite grew from ca. 129 to ca. 112 ka. The changes in δ13C for ocz-6 stalagmite seem to reflect the development of soil and vegetation cover. The δ18O proxy probably reflects the thermal changes and the changes of moisture sources as well. During the time of interglacial development (129–126.5 ka), the ocz-6 δ18O trend was similar to Mediterranean δ18O records. Observed at that time negative trend is rather not connected with thermal changes, as we do not expect temperature drop at the interglacial beginning, therefore it rather suggests similar changes in sources of moisture for both regions. The crystallization of calcite occurred under stable regime at that time. Local conditions were dominated by periods of dryer and wetter climate, which is supported by changes in Mg and Sr content. Changes in the P, Fe, and Si content, as well as the systematic depletion of δ13C, probably reflect the slow soil development at that time. The beginning of LIG optimum is connected with a rapid increase in the stalagmite growth rate, which suggests increase of dripping rate. It is supported by change in calcite fabric from columnar compact to heavy porous columnar open. The data from Western Mediterranean sites and other isotopic records suggests that it was wetter period. Thus increased dripping rate could be connected with higher rainfalls at that time. Elevated δ18O values and low δ13C corresponds with other data from the region and suggest warm and wet period with developed vegetation cover. Since then, the δ18O trend of the ocz-6 record has become similar to trends of other European records. During the LIG optimum, the difference between δ18O records from different European regions was the lowest. This suggests a stronger influence of Atlantic circulation at that time and delivering more moisture of Atlantic origin to Eastern part of continent. The high variability of proxies such as δ18O, δ13C, Mg, Sr, Fe and P during the interglacial optimum exhibits its instability which is in accordance with data from Western Europe. The carbon isotopic record of the ocz-6 stalagmite reflects changes in vegetation and is similar to that observed in Alpine records during most of the LIG. The correlations observed between δ13C and Fe, P, Si content at the beginning and end of the LIG reflect the soil development process. A strong isotopic shift at the end of the ocz-6 record may suggest dry conditions that finally stopped the ocz-6 precipitation at the end of the LIG. The increasing difference between ocz-6 record and the other record during the interglacial demise time suggest that climatic conditions become more dependent from regional settings at that time.