
. Introduction
One of the main difficulties in Electron Spin Resonance (ESR) dating of fossil teeth lies in the complexity of the system that has to be considered for dose rate evaluation. A tooth is indeed made by various dental tissues of variable thicknesses, densities and radioelement concentrations (Grün and Taylor, 1996; Rink and Hunter, 1997), which may all impact in more or less extent the amount of radiation dose absorbed by the enamel. If the initial and removed thickness of the enamel layer is usually taken into consideration for the alpha and beta dose rate attenuation and self-absorption factors, the thickness of the adjacent tissues (dentine, cement) is in contrast very rarely considered in the dose rate evaluation. Actually, the most widely used combined US-ESR age calculation programs among the community, DATA (Grün, 2009) and USESR (Shao et al., 2014), assume by default that these tissues, if present, are thick enough (i.e., thicker than the 2 mm usually considered as a penetration range depth for beta particles) to provide 100% of the external beta dose rate to the enamel.
In order to evaluate to which extent this assumption is correct and how it may impact the external beta dose rate absorbed by the enamel layer, we used DosiVox, a Geant4-based software simulating the interactions of particles within a material for dosimetric purposes (Martin et al., 2015a). With this software, it is now possible to model more complex geometries like fossil teeth, and we performed several simulations with an outer tissue thickness varying between 0 and 2 mm. Results are presented and discussed hereafter.
. ESR dating of fossil tooth enamel
Basic considerations for dose rate evaluation
A tooth is typically made of several tissues (mostly dentine, enamel and cement) that differ in many aspects such as chemical composition, mineralization, density or thickness (see overviews in Driessens, 1980, Elliott, 2002; Hillson, 2012). Tooth structure and geometry is highly variable depending on the type and species considered (Hillson, 2012), and the enamel layer dated by ESR may be surrounded by different materials, such as dental tissues and/or sediment. For example, enamel is the outermost layer in human tooth crown, which means that it is in direct contact with the sediment on its external side. In contrast, fossil equid teeth are notoriously famous for having cement capping the external side of the enamel layer. As a consequence, the sediment is not in direct contact with the enamel. Basically, these two situations have different implications in terms of dose rate evaluation, and especially for the alpha and beta components.
In ESR dating, teeth are typically approximated to a succession of thin layers. Two main geometries can usually be considered, depending on whether the enamel layer is on one side in direct contact with the sediment:
where tissue1 is in most cases the inner tissue, dentine, and tissue2 is the outer dental tissue at the interface between the enamel and the sediment. This tissue is usually cement (e.g. Duval et al., 2011a), although it can sometimes also be dentine in the case of a multi-folded enamel layer (e.g. Grün and Invernati, 1985). Geometry (1) is illustrated in Fig. 1.
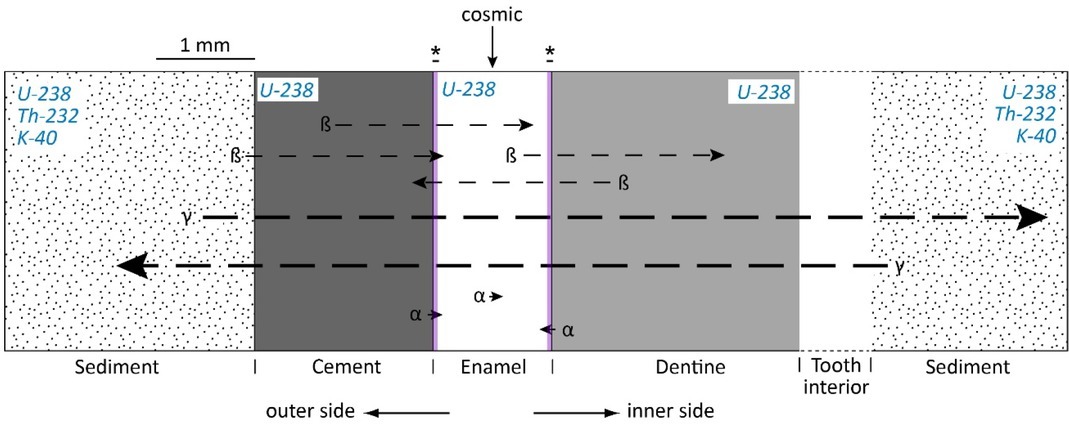
Fig. 1
Dose rate evaluation: tooth geometry and radioactive sources to consider in ESR dating of tooth enamel (Modified from Rink (1997) and Duval (2015)). Shown here is the cement-enamel-dentine geometry. Key: (*) is the removed enamel thicknesses (a few tens of μm) from both sides of the enamel layer; α, γ, β represent alpha, beta and gamma radiations affecting the enamel layer. In blue italics, the radioactive sources present in each material (dental tissues and sediment).
Dose rate evaluation in fossil teeth is usually based on a series of considerations that may be summarized as follows:
– Any dental tissue directly attached to the enamel layer (internal component of the dose rate) contributes to the external alpha and beta dose rate (Grün, 1992), while the gamma dose rate comes from the sediment only (Geometry 1, see Fig. 1). Both the gamma dose rate from the dental tissues and the gamma attenuation by the tooth are considered negligible, unless the tooth is significantly bigger than usual (e.g. mammoth tooth; Grün, 1992).
– Unlike sediment, dental tissues are assumed to be free of Th-232-series and K-40 elements (Grün and Mc Dermott, 1994; Grün and Taylor 1996). Consequently, the alpha and beta dose rate components in dental tissues come from the U-238 decay chain alone.
– As part of the standard sample preparation procedure, the external alpha dose rate contribution is usually removed (or at least significant minimized) by cleaning the enamel layer on both side by > 20 μm (e.g. Duval et al., 2011a).
– In contrast, because the standard penetration depth of the beta particles (about 2 mm) is in the same order of magnitude of the usual thickness of dental tissues (typically around 1.0–1.5 mm), the beta dose rate component cannot be eliminated. Instead, the attenuation of the beta particles has to be considered, together with the thickness of the enamel layer removed on both sides.
– A succession of thin and homogeneous layers is considered for the external beta dose rate evaluation. In order to meet the infinite matrix conditions, the thickness of the layers adjacent to the enamel is assumed to be > 2 mm, and an isotropic and homogeneous spatial distribution of U-238 series elements is typically assumed within each dental tissue.
– Dental tissues are known to behave as open systems for U-series elements (Grün and Mc Dermott, 1994). Disequilibrium in the U-238 decay chain is commonly observed in fossil teeth, and U-series have to be combined with ESR data to provide a single combined US-ESR age result for a given tooth (Grün et al., 1988). Further details about this approach may be found in Duval (2015) and references therein.
Current limitations of standard combined US-ESR age calculation programs
DATA (Grün, 2009) and USESR (Shao et al., 2014) are the most popular programs in the scientific community for combined US-ESR age calculations. They, however, do not take into consideration the thickness of the tissues adjacent to the enamel layer in the beta dose rate evaluation. These two programs offer only 2 options: either (i) the enamel layer is surrounded on both sides by dental tissues thick enough (> 2 mm) to ensure that they produce 100% of the external beta dose rate (Geometry 1 from Fig. 1), or (ii) there is no tissue on one side (typically the outer side of the enamel layer) and the beta dose rate derived for this side of the enamel comes from the sediment only. These two geometries may actually produce very different beta dose rate values given the existing difference in the radioelement concentrations between the sediment (usually a few ppm of U-238, Th-232 and % of K-40) and dental tissues (typically, several tens of ppm of U-238). Consequently, the choice of either option 1 or 2 may have a non-negligible impact on the calculated age, depending on whether dental tissues carry a significant weight in the total dose rate. This weight may vary between <10% in Late Pleistocene cave sites (Richard et al., 2017) to 75% in Early Pleistocene open-air sites (Duval et al., 2011a). For example, tooth sample 3546B from Khok Sung locality, Thailand, showed an external dental tissue attached to the enamel layer and a combined US-ESR age was calculated assuming a geometry cement / enamel / dentine (Duval et al., submitted). Now, assuming a geometry sediment / enamel / dentine instead (i.e., the beta dose rate contribution from the outer side of the enamel layer comes from the sediment only), the resulting age would get older by 70 ka (+37%). This briefly illustrates the potential impact of the tooth geometry considered for the sample that is being dated.
As mentioned above, if the enamel layer is surrounded on both sides by other dental tissues, these adjacent tissues are assumed by DATA and USESR to be thick enough (>2 mm) to meet the infinite matrix conditions. However, this assumption may sometimes be wrong. For example, the thickness of the cement layer in equid teeth is known to be highly variable depending on the type of tooth, the age at the death of the animal, as well as longitudinally, from the occlusal surface to the roots (e.g. Burke and Castanet, 1995). Consequently, it is not unusual to have an outer adjacent dental tissue with a thickness of < 2 mm. However, it is simply unknown in which extent it may impact the final age result. Considering a thickness that fulfills the infinite matrix conditions would lead to the calculation of an overestimated beta dose rate value (and thus an underestimated US-ESR age) if the tissue thickness is thinner than 2 mm. In contrast, considering no dental tissue on the outer side of the enamel layer would underestimate the true beta dose rate and yield thus an overestimated US-ESR age. In first instance, the true age of the sample would be located somewhere in between those two calculations. Consequently, the use of Geometry 1 and 2 may be used in first instance to roughly estimate the impact of a thin (< 2 mm) adjacent tissue on the final age results. However, this evaluation cannot be considered as fully satisfactory given the magnitude of the uncertainty involved (see example above with sample 3546B).
Modelling beta dose rates is in first instance not so straightforward, as complex beta emitter spectra derived from K-40 as well as progeny of U-238 and Th-232 have to be considered (see Guérin et al., 2012; Martin, 2015). The mean path length of electrons emitted by these elements depends on the environment considered, and is influenced by different parameters such as water content and chemical composition of the materials. The reader may refer to Grün (1986), Cross et al. (1992), Brennan et al. (1997), Martin et al. (2015b) for a discussion on these questions. The recent development of DosiVox (Martin et al., 2015a) enables now to model dose rates for complex geometries and environments by using Geant4, a platform for the simulation of particle interactions with matter using Monte Carlo methods. In our case, it offers the possibility to properly evaluate in which extent the presence of an outer dental tissue with variable thickness may impact the external beta dose rate. Five different simulations were performed using a cement thickness varying between 0 and 2 mm.
. Material and methods
Beta dose rate modelling was carried out with DosiVox program (version 1.04; Martin et al., 2015a), using version 10.1p01 of Geant4 (Allison et al., 2016) and the beta emitter spectra at secular equilibrium from Guérin (2011) and Martin (2015), which are based on NuDat online database (version nov. 2009; Kinsey et al., 1996) from the NNDC (Brookhaven National Laboratory, USA). With DosiVox, simulations are performed in a three dimensional (3D) grid divided in a series of voxels whose resolution and size may differ along the three axis (see details in Martin et al., 2015a).
In our study, sample geometry was approximated to the stratified-sediment case presented in Martin et al. (2015a): each component (i.e., sediment and the various dental tissues) was assumed to be a thin layer with homogeneous and isotropic radionuclide distribution. Basically, a 3D rectangular parallelepiped of variable length (z axis) was designed, with a resolution of 0.01 mm / voxel along the z axis. The enamel layer was considered to be 1 mm-thick (standard thickness observed in most of the European large mammal teeth), while the dentine (inner side) and the sediment (outer side) are 3-mm thick in order to meet the infinite matrix conditions (Grün 1986; Cross et al., 1992; Brennan et al., 1997; Martin et al., 2015b). Five cases were considered for simulation, with different cement thicknesses: 2 mm (case 1), 1 mm (case 2), 0.5 mm (case 3), 0.1 mm (case 4) and 0 mm (case 5). 2D illustrations of the five simulated cases are provided in Fig. 2. A 1×1 voxel of 20×20 mm was considered on the x-y plan to reproduce infinite matrix assumption. A cylindrical probe was selected among the range of detectors available in DosiVox, with a diameter set to 3 mm. The 3D models generated for the simulations are displayed in Supplementary material, Figure S1.
Fig. 2
2D schematic display of the 5 cases simulated with DosiVox (along z axis). The number of voxels used for each component along the z-axis is indicated in the red boxes. Note that a 1×1 voxel of 20×20 mm was considered in the x-y plan for the simulations. Simulations were performed by considering 10, 20 and 30 pm of U-238 in the cement.
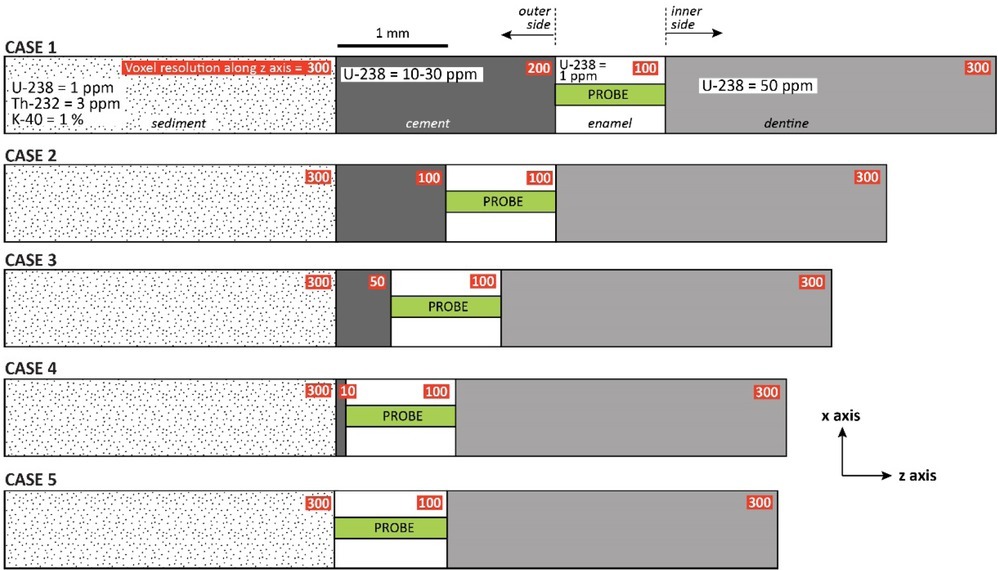
Simulations were based on considering a standard sandy sediment with 1 ppm U-238, 3 ppm Th-232 and 1% K-40. In comparison, uranium concentration in the enamel, dentine and cement was assumed to be of 1, 50 and 10–30 ppm. The characteristics of each material (chemical composition, density, water content) used in the simulations are provided in Supplementary material, Table S1. In order to avoid too complex simulations and obtain results that can be directly compared with those from DATA and USESR programs, a couple of assumptions were considered:
1) Equilibrium in the U-238 decay chain for both dental tissues and sediment was assumed. We are aware that this assumption is most likely incorrect for dental tissues, but DosiVox does not presently contemplate U-series disequilibrium. We acknowledge this may result in some approximation for the beta emitter spectra and the mean path length of beta particles. However, we believe this does not affect the purpose of this work, as the resulting dose overestimation potentially induced by considering equilibrium in dental tissues can in any case be indirectly addressed by diminishing the uranium concentration in the corresponding tissue or adjusting the dose rate conversion factors accordingly.
2) Each material modelled (sediment and dental tissues) is assumed to display an isotropically homogenous spatial distribution of radionuclides in order to mimic the conditions offered by both DATA and USESR. We are aware the reality is undoubtedly more complex (e.g. Duval et al., 2011b), but investigating this question is beyond the scope of the present work and is the subject of another study (Martin et al., 2019).
For each case, U-238, Th-232 and K-40 beta spectra were simulated, and a total beta dose rate distribution was calculated according to the conversion factors from Guérin et al. (2011). Individual contributions from the sediment, dentine and cement could be extracted (Fig. 3A) and then summed to obtain a total external beta dose rate (Fig. 3B). Note that although the individual (internal) contribution of the enamel was modeled, it was not incorporated in the external beta dose rate evaluation. Some of the pilot files created for the present study are available in Supplementary material so that anyone can run the simulations in DosiVox.
Fig. 3
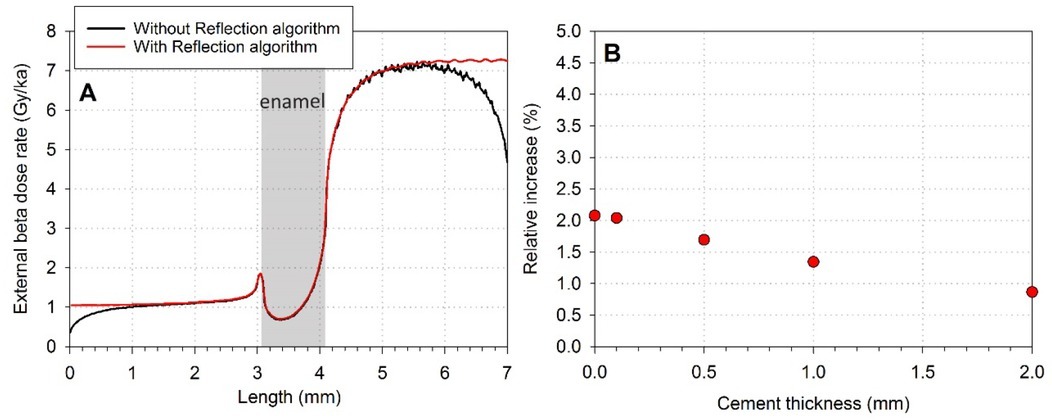
Variation along the z axis of the beta dose rate values derived from the DosiVox simulations. The high frequency variability (“saw-tooth" shape) that may locally be observed are artifacts of the Geant4 “cut in range” process for secondary particle simulations. This does not affect the calculation of average dose rate values nor the general shape of the curves. A: example of case 3 (0.5 mm-thick cement with a uranium concentration of 30 ppm). The individual contributions from the dentine, cement and sediment are shown. B: Total beta dose rate values (for a given case obtained from the sum of each individual contribution displayed in A) obtained for the 5 scenarios. To facilitate data visualization, data were aligned to the right.
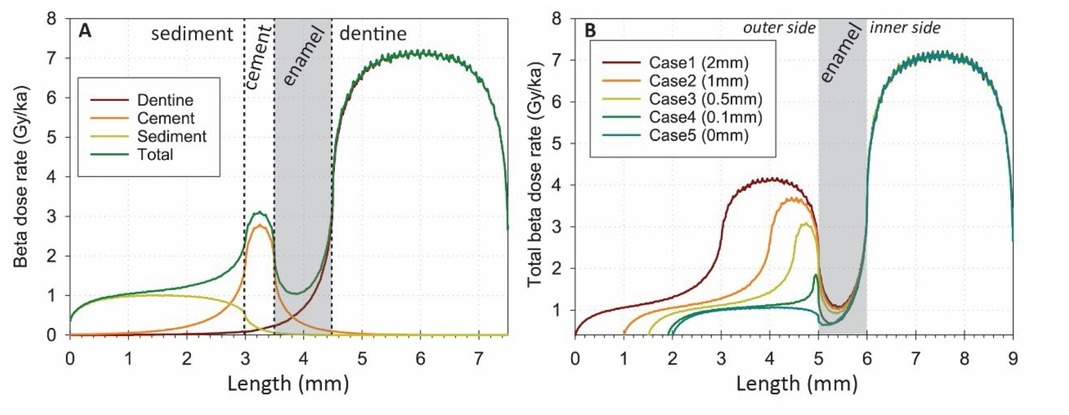
Fig. 3 shows the mean path length of beta particles within the enamel layer (grey band). An asymmetric U-shape attenuation of the beta dose rate within the enamel layer may be observed, as the result of a higher U-238 concentration from the inner side (dentine). However, because ESR data are not spatially resolved (the whole volume of the enamel layer is powdered and measured by ESR), beta dose rate in the enamel have to be considered as a bulk value. Consequently, a pseudo-bulk estimate of the external beta dose rate absorbed by the 1-mm thick enamel layer was calculated by averaging the beta dose rate values obtained for each voxel over the total thickness of the enamel layer (1 mm) minus the external 30 μm on each (inner and outer) side, in order to mimic the standard sample preparation procedure in ESR dating.
. Results
Total external beta dose rate
Numerical values extracted for the enamel layer and derived from the 5 sets of simulations are provided in Supplementary material, Table S2 and graphically displayed in Fig. 4.
Fig. 4
Variation of the different components of the beta dose rate depending on cement thickness and uranium concentration (derived from numerical values displayed in Table S1). A: Variation of the total beta dose rate. To facilitate comparisons, values have been normalized to that corresponding to 0 mm-thick cement (Case 5). B: Variation of the relative contribution of each component to the total beta dose rate (values corresponding to 20 ppm U-238 in cement).
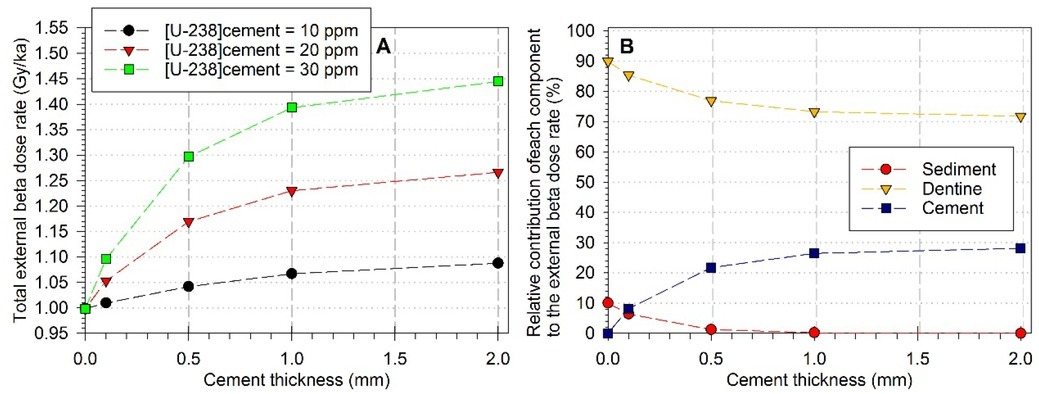
Fig. 4A shows the relative increase of the external total beta dose rate as a function of cement thickness (from 0 to 2 mm) and radioactivity (10 to 30 ppm). The following observations can be made:
- the values may increase by ~9 to ~45% for 0 to 2 mm-thick cement with 10 and 30 ppm of U-238, respectively.
- for a cement with uranium concentration > 20 ppm, the relative increase in the total dose rate is already significant (5 to 10 %) with only a 0.1 mm-thick cement.
These simulation shows the non-negligible weight of a thin layer (i.e., < 2 mm) of cement located at the interface between enamel and sediment. The thicker is the cement layer, the higher is the dose absorbed by the enamel (see also Fig. 2B). This result was expected, given that cement has a significantly higher uranium concentration compared with sediment.
The different components of the external beta dose rate
Logically, the relative contribution of the cement to the total beta dose rate increases with the thickness and reaches a maximum at 2 mm (Fig. 4B). It may then represent 30% of the total beta dose rate in case its uranium concentration is of 20 ppm. By definition, the relative
weight of the cement is directly dependent on the radioelement concentration of the dental tissues and sediment. Nevertheless, previous observations made on horse teeth dated by ESR showed that is the large majority of the cases (88%) the cement displays lower uranium concentration values than in the corresponding dentine of a given tooth (Duval et al., 2012). Consequently, it is very unlikely that the relative contribution of the cement to the total beta dose rate will ever exceed 50%.
In contrast, the relative contribution of the sediment is minimum (1.3%) as soon as the cement has a thickness > 0.5 mm. U-238 concentrations of 10 and 30 ppm in cement would have virtually no impact on this relative contribution: it would remain within 1.1–1.4 % for a 0.5 mm-thick cement.
Impact of the “Reflection algorithm”
We also tested the impact of a “particle reflection” algorithm process on the simulated dose rates with a modified version of DosiVox (Martin, 2015). This algorithm was specifically designed to ensure infinite matrix conditions during the simulations: basically, the beta particles are emitted homogeneously and isotopically, and they are reflected in the opposite direction (i.e., like a mirror) if they ever reach the edge of the parallelepiped. This idea first came from Guérin and Mercier (2012), who used a similar algorithm to simulate infinite matrix condition for gamma particles. In our case, it creates here an infinite medium in x- and y- axis directions and allows to take into account the energy of long-range particles (mostly X-rays from the beta interaction with matter) that would simply exit the simulated volume without particle reflection. Additionally, it offers an improved statistical accuracy of the results by increasing the ratio of the number of particles interacting inside the probe detector vs. the number of simulated particles.
Using this algorithm, resulting beta dose rate no longer display those edge effects, i.e. the depletion of the values at the border of the parallelepiped (see comparison in Fig. 5A). Numerical values derived for the enamel layer show a slight but systematic increase of the calculated dose rate depending on the cement thickness (Fig. 5B): from +0.9% for a 2-mm thick cement to 2.1% with no cement. The largest difference is observed when the cement is absent. These values may be used as corrections factors for the dose values displayed in Supplementary material, Table S2. However, it should also be mentioned that the use of the ‘Reflection algorithm’ as virtually no impact (< 1%) on the magnitude of the relative contribution of the cement to the total dose rate as a function of its thickness.
Fig. 5
Impact of the Reflection algorithm on the simulated dose rate values. A: comparison of the total external beta dose rates obtained with and without the reflection algorithm (example of Case #4). B: Relative increase of the total beta dose rate due to the use of the reflection algorithm (compared to values from Supplementary material, Table S2) as a function of cement thickness (from 0 to 2 mm, case #5 to #1).
As mentioned by Guérin and Mercier (2012), one of the main interests of the ‘Reflection algorithm’ is the increased statistical counting by avoiding the loss of beta particle beyond the edge of the parallelepiped. As a consequence, it may thus lead to a significant decrease of calculation times. However, one may be aware that the use of this algorithm results in the creation of a virtual infinite matrix by reflection. Consequently, it can only be applied to planar geometries and must be employed with caution in other cases for which the reflected geometry at the edges of the considered volume would result asymmetrical (considering the range of the beta particles).
. Discussion
The DosiVox simulations show that there is a clear correlation between the cement thickness and the amount of beta dose absorbed by the enamel layer. However, in which extent cement thickness significantly impact the dose rate evaluation?
Fig. 6A shows the relative contribution of the cement to the beta dose rate from the outer side (sediment + cement) as a function of cement thickness and uranium concentration. Results indicate that a 0.1 mm-thick cement with 10 ppm of uranium cement contributes to at least of 40%. This value reaches 90% for a 0.5 mm-thick cement layer. Based on these data, one may reasonably conclude that the relative contribution of the sediment becomes negligible (<1.6% of the beta dose rate from the outer side) as soon as the cement is at least 1-mm thick. At 2 mm, the cement contributes to > 99.8% of the beta dose rate from the outer side, confirming the conditions very close to the infinite matrix assumption.
Fig. 6
A: relative contribution of the cement to the beta dose rate from the outer side (sediment + cement) as a function of cement thickness and uranium concentration; B: respective proportions of cement and sediment components in the beta dose rate from the outer side of the enamel layer.
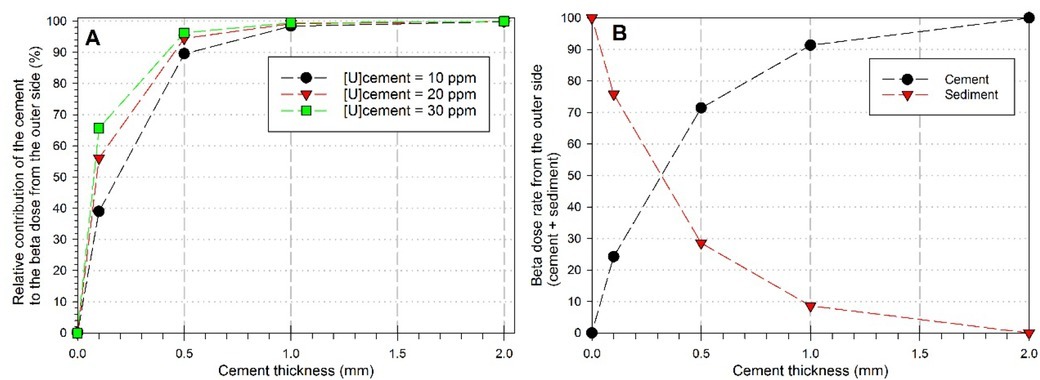
Finally, Fig. 6B displays the respective proportions of cement and sediment components in the beta dose rate from the outer side of the enamel layer. Note these values are independent of U-238 concentration in cement, but depends only on its thickness. For a 2-mm thick cement, infinite matrix conditions are met and 100% of the dose rate from the outer side comes from the cement. This is the situation considered by default by DATA and USESR programs. In contrast, no cement would make that 100% of the dose rate from the outer side comes from the sediment. One may observe that a 0.5-mm thick cement would produce 71% of the maximum dose, while 1 mm would make 91% of the infinite matrix dose (Fig. 6B). In other words, the sediment would contribute to 29% and 9% of the outer beta dose rate for a cement with a thickness of 0.5 mm and 1 mm, respectively. Based on these results, a cement beta dose rate value may be obtained from DATA or USESR with an infinite matrix assumption based on a 2-mm thick tissue, and then corrected accordingly based on the thickness of the cement that has been experimentally measured in a given tooth.
. Conclusion
This work illustrates the great potential of DosiVox to address very simple questions that may be of importance in ESR or Luminescence dating, but require some modelling. Until now, the thickness of the dental tissues adjacent to the enamel layer was not considered. When present, adjacent tissues were assumed to be sufficient to fulfill the infinite matrix conditions. Our result suggests that in first instance such an assumption may represent a fair approximation of the reality, as even with a thickness of only 1 mm, the cement contributes to at least 98% of the beta dose rate coming from the outer side of the enamel layer. When cement is < 1 mm thick, the beta dose rate derived from DATA or USESR should be corrected accordingly by considering the additional contribution of the sediment. The correction factors may be found in Fig. 6B. The impact of this correction on the total dose rate may vary, as it is directly dependent on the radioactivity of the cement itself, as well as of the sediment or dentine. Our results show that a very thin cement layer (0.1 mm-thick) can significantly contribute to the beta dose rate and should therefore not be neglected. Consequently, based on these results, we recommend the systematic measurement of the thickness of the dental tissues adjacent to the enamel layer during sample preparation, in order to proceed to beta dose rate corrections if necessary.
Finally, DosiVox simulations were performed with a given set of experimental conditions, and we do acknowledge that reality is, as per usual, more complex than the modelled scenarios. The values of some parameters such as water content, density, chemical compositions of the sediment and dental tissues may vary among tooth samples and sites, which would have in more or less extent an impact on the modelled beta dose rate values. These aspects will be further investigated in the future in order to quantify the resulting uncertainty.
Although the work has been especially focused on the case of fossil teeth showing cement, the conclusions of this work stand for any other geometry involving different dental tissues adjacent to the enamel layer dated by ESR. Sometimes, multi-folded inner enamel layers may indeed be surrounded by a succession thin dentine and enamel layers (e.g. Grün et al., 1999; Debuyst et al., 2000), resulting thus in somewhat complex beta dose rate evaluation. Finally, we provide in Supplementary material the Excel spreadsheet with the beta dose rate spectra produced for this study, in which the radioelement concentrations, and dose rate conversion factors can be adjusted to anyone’s needs.