
. Introduction
The products of organic matter (OM) combustion or pyrolysis (B/P), have been commonly applied to environmental and paleoenvironmental characterization and reconstruction or as a basis for the chronology of deposits in sedimentology and archaeology. Wood B/P is thermal decomposition that evolves flammable gases being ignited in the presence of O2 when the temperature exceeds the temperature of ignition. The final burning products, under ideal conditions, are CO2 and H2O. In practice, B/P never proceeds under ideal conditions and, as a result, different products are formed. Material produced from
B/P varies and is described by different names: charcoal, soot, black carbon, elemental carbon, biochar and pyrogenic carbon (Bird, 2006; Preston and Schmidt, 2006; Bird and Ascough, 2012 and Pawlyta and Hercman, 2016). This reflects the complexity of its composition and structure, as well as its importance in a range of scientific areas. These B/P products differ not only in terminology but also in the methodology of analysis and interpretation of the results.
Combustion and pyrolysis of OM produces different types of carbon rich material. During the B/P processes, the relative content of carbon increases and is accompanied by a decrease in O and H, resulting from organic compound degradation. Because of increasing carbon content and structural changes, chemically stable aromatic rings are formed. The products final structure is B/P temperature dependent. At higher temperatures, microcrystalline domains may be formed and chemical
stability is greater, making B/P products resistant to post-depositional alteration (Goldberg, 1985; Vane and Abbott, 1999; Masiello, 2004; Czimczik et al., 2005; Preston and Schmidt, 2006; Eckmeier et al., 2007 and Bird and Ascough, 2012).
The resistant black residue that remains after B/P of OM is responsible for its common occurrence in a wide range of materials and environments. The occurrence of the products has been studied in very old sediments (Cressler, 2001), soils (Schmidt et al., 2002; Brodowski et al., 2005 and Lehmann et al., 2008), in the atmosphere (Cachier et al., 1989) as well as in terrestrial and marine sediments of different age (Bird and Cali, 1998; Masiello and Druffel, 1998; Manino and Harvey, 2004; Dittmar and Koch, 2006; Haberstroh et al., 2006 and Dittmar and Paeng, 2009) or in caves (Chang et al., 2008; Gradziński et al., 2003, 2007 and Joeng et al., 2003).
The carbon isotopic composition of B/P products is widely used as a proxy in paleoclimatic, paleoecological, archaeological and biological studies or as an isotopic fingerprint (Bird and Cali, 1998; Cressler , 2001; Hall et al, 2008; Schmidt et al., 2002; Joeng et al., 2003; Czimczik et al., 2005; Ferio et al., 2006; Chang et al., 2008 and Song et al, 2012). Such a wide application caused intensive studies of B/P processes and carbon isotopic fractionation. The studies usually resulted from interests and needs of researchers and concerned only on selected products of combustion. Most current research is related to charcoal.
The importance of this information has resulted in extensive methodological and experimental studies of the relation between B/P conditions and the isotopic composition of the B/P products. Most studies focus on the isotopic composition of charcoal, with respect to the B/P conditions (temperature, time, atmosphere; see Bird and Ascough, 2012). In Bird and Ascough (2012), the results of previous work were not only reviewed but a detailed discussion of factors affecting the results was provided, including the choice of material for testing, sample preparation, experimental methodology and analysis methodology.
The black residue that remains after wood combustion is a common material for archaeological and geological investigations. Most published results from these analyses concern carbonaceous microstructural studies, radiocarbon analyses and stable isotopic analyses in aerosols and clastic deposits (Currie et al., 1997; Masiello et al., 2002 and Brodowski et al., 2005). The primary reason for these studies is increasing interest in nanoparticles and their impact on the environments and humans (see review and references there: Nowack and Bucheli, 2007). Investigations of the accumulated wood combustion products in sediments give the chance to determine their provenance: human activity and natural phenomena (like forest or meadow fires). In archaeological and geological investigations it is also very important to distinguish the products from different sources that can be commonly found in the modern environment (e.g. wood burning at the fires, fossil fuel combustion in the engines, industry).
Several studies have examined carbonaceous material from caves. These studies have mostly been for archaeological purposes or to provide information about B/P product precursor (Petranek and Pouba, 1951; Bennington et al., 1962; Watson, 1966; Hill, 1982; Steelman et al., 2002; Gradziński et al., 2002, 2003, 2007; Chang et al., 2008 and Pawlyta and Hercman, 2016).
Products of the complete wood combustion are mostly gaseous, however in the case of incomplete burning, these can form well visible black layer or can be dispersed in the sediment. In the second case, identification of burning wood product is more difficult. One of the common products of incomplete combustion are soot aggregates, which have characteristic structure and can be easily identified even in extremely low concentrations using the transmission electron microscopy (TEM) or scanning electron microscopy (SEM) techniques after relatively simple chemical separation (Pósfai and Molnár, 2000 and Pawlyta and Hercman, 2016).
In our studies of lake and cave deposits we often found traces of combustion products dispersed in the sediments or inside of carbonate speleothems. Separated soot aggregates allow identification of the type of combusted material (Joeng et al, 2003; Chang et al., 2008 and Pawlyta and Hercman, 2016). In our research, we set question whether the carbon isotopic composition in the soot aggregates corresponds to the carbon isotopic composition of the combusted material (e.g. wood) and thus it can be used, for example, as a paleo environmental proxy. In order to get an answer to the question asked, several experiments have been performed and isotopic composition of solid, liquid, condensed volatile and gaseous products of combustion were investigated.
. Material
Three types of modern wood were selected: pine (Pinus sp.), oak (Oak sp.) and beech (Beech sp.). In addition, a sample of fossil oak was obtained from the Krakow Dendrochronological Laboratory. The basic data of the collected samples (locality, cutting time, growth period) together with measured carbon isotopic composition are presented in Table 1. For the beech and oak trunks, samples with 9 yr of growth rings, covering years 2001– 2009, were selected. The pine trunk was smaller than the beech and oak trunks, so a 13 yr sample was selected, covering years 2001–2013. The samples, around 300 g of modern wood and 200 g of fossil oak, were chipped and homogenized. Part of the material (around 200 g) was used in experiments with a burning chamber, and the remains were pulverized using an agate mill. The obtained powder was then used in furnace experiments. The carbon isotopic composition of the wood samples was estimated as a mean value using a series of measurements (either 10 for fossil oak or 30 for modern wood). The age
Table 1
Basic data of wood samples.
[i] a Timespan covered by sample analyzed;
b number of stable isotope analyses;
c radiocarbon age calibration using OxCal 4.2.4 (Bronk Ramsey, 2009) and IntCal13 atmospheric curve (Reimer et al., 2013).
of the fossil oak was estimated based on radiocarbon analysis performed at the Poznań Radiocarbon Laboratory.
. Methods
Wood burning experiments
Two sets of wood burning/pyrolysis experiments were performed using burning chamber and furnace. Several types of samples for carbon stable isotope analyses were collected depending on experiment type. In the further part of the work we will use the terms: (1) “charcoal” for charred wood – black residuum collected from burning plate or from sample tube; (2) “ash” for gray powder collected from ash collector; (3) “acid” for transparent liquid sample with pH ~ 1 (“pyroligneous acid” consisting mainly of acetic acid and methanol); (4) “bio-oils” for yellow-brown colour oleic liquid and (5) soot aggregates for separated soot from volatiles condensed at collecting plate.
The first set of experiments involved the simulation of a fireplace in a burning chamber. The wood sample (80– 100 g) was located at the burning plate and an ash collector was located below the burning plate. The volatile burning products, e.g. soot aggregates, were collected as condensed products on the quartz-glass plate located 15 cm above the fireplace. Two thermocouples allowed control of the burning temperature and the collecting plate temperature. Burning temperature was around 400– 500°C. The maximum temperature in the upper part of the flame was 800°C. At the top of the burning chamber a tube for gas product collection was installed. The gas tube was connected through the particle trap and water vapor trap directly to the Picarro G2201-i Analyzer or via the membrane pump to a sampling bag. After each experiment, several burning products were collected for further analysis: “charcoal”, “ash” and volatile products condensed onto the collecting plates.
The next set of experiments was carried out in a furnace. Powdered wood sample (1–2 g) was put in a quartz tube between two quartz wool plugs, which was then placed in the heating chamber pre-heated to a predetermined temperature. The temperature was increased gradually in 50°C intervals in the 200–600°C range. At each temperature increment, the sample was kept for 45 min. A thermocouple was put inside the sample to allow temperature control. Experiments were performed under an atmosphere of N2 or synthetic air (21% O2 and 79% N2; H2O <3ppm, CO<0,1ppm, CO2<0,5ppm, H2<1ppm). At the exit of the sample tube, a water cooler was mounted to facilitate condensation of the volatile products released during the experiment. For further analysis, the “charcoal” and volatile components, condensed at the cooled exit of the sample tube (“acids” and “bio-oils”), were collected.
Burning product collection and pre-treatment
Wood, “charcoal”, “acids”, “bio-oils” and “ash” were analysed without any pre-treatment. Volatile products condensed at the collecting plate of burning chamber were mixtures of different B/P products, including soot, char and tar. To obtain information about the soot aggregates carbon isotopic composition, several purification steps were applied. Volatile products collected at the plate were divided into three parts in order to check the possible impact of the purification procedure on the isotopic composition. First part was analysed without pretreatment; second one was treated with 2% HCl (3 times, each 24 h in room temperature with washing between the acid steps); and third part was treated with 2% HCl (similarly as in the second step) and 40% HF for 1 h. At the end of the chemical procedure, the samples were repeatedly (ca. 10×) washed with deionised water. This pretreatment scheme is typical for the purification of soot aggregates (Pawlyta and Hercman, 2016).
Carbon stable isotope measurements
Carbon stable isotopes composition analysis was performed at the Stable Isotope Laboratory of the Institute of Geological Sciences of the Polish Academy of Sciences in Warsaw. Stable isotopic composition of carbon for solid and liquid samples (wood, charred wood, soot aggregates, ash and oil) was determined using a Thermo Flash EA 1112 HT elemental analyser connected to a Thermo Delta V Advantage Isotope Ratio Mass Spectrometer in continuous flow mode. Samples (ca. 250 μg) were wrapped in Sn capsules and combusted at 1020ºC. The carbon isotope ratio was calculated using a calibration curve based on several international standards (USGS 40, USGS 41, IAEA 600, IAEA C7 and NBS 22). To control the measurement conditions, an laboratory standard (Nicotinamide Standard) was measured after each batch of 5 samples. The number of samples taken for analysis of specific B/P products depended on the amount of material available and ranged from 3 to 9. Reported uncertainties represent 95% confidence interval calculated basing on laboratory standard measurements results from the period of research conduction.
The carbon isotopic composition of CO2 was measured by a Picarro G2201-i Analyzer using a cavity ring-down spectroscopy (CRDS) method. At the experiment time, CO2 was continuously pumped at ca. 50 ml/min and collected in sampling bag. Collected CO2 was mixed with artificial air in another sampling bags for carbon concentrations close to 2000–3000 ppm, which is optimal the for G2201-I Analyzer (recommended by producer CO2 operational range is 100–4000 ppm). Prepared gas mixture was measured by Picarro G2201-i Analyzer. Reported results represent average value from 10–20 minute measurement (carbon isotopic composition is measured every 3 s).
Isotope ratios are reported as dispersion from the standard (δ value) and expressed in ‰ relative to V-PDB standard.
For the description of carbon isotopic composition, we define the “variation factor” (ΔC) as the difference between average of measured δ13C values in the B/P product and the average of the bulk wood sample (listed in Table 1):
According to this definition, positive values of ΔC indicate enrichment in 13C in the products relatively to the wood. Negative values of ΔC indicate depletion of 13C in the product relatively to the wood. Due to the small number of samples, 95% confidence intervals of ΔC were estimated using Monte Carlo simulation method.
Molecular simulations
In order to explain relationships between carbon isotopes in the solid, liquid and gaseous combustion products, two series of molecular simulations were performed.
In the first one, models of two the most abundant components of wood, were tested: cellulose and lignin. Cellulose structure was built of 9 glucose monomers. Lignin model containing C160H180O58 was provided by courtesy of Tingting Zhang (Zhang et al., 2016). Reaxff force field optimized for C/H/O combustion (Chenoweth et al., 2008) was used in LAMMPS computer simulation program (Plimpton, 1995). Timestep was set at 0.25 ps, cutoff at 10.0 Å and temperature was increasing continuously 1ºC/ps from 27ºC up to 2227ºC in the NVT ensemble. Simulations for single molecules and with additional oxygen in pressure of ca 10 atm. were additionally performed. Based on the results of simulations, evolution with temperature of pyrolysate masses containing certain number of carbon atoms were calculated. Analysis of the simulation frames was performed recursively for all atoms – atoms belong to chain with certain number of carbon atoms if it was in distance below 1.8 Å to any atom building the molecule (C, O, H). In order to improve statistics, six series of simulations were performed in the same conditions but with slightly modified starting structure.
In the second set of simulations, an isotope exchange reactions between pyrene (a model of residuum) and different gaseous and liquid products were tested:
The aim was to calculate Δ energy, Δ enthalpy and Δ Gibbs free energy of reactions along with zero-point energy (ZPE) and thermal corrections at two significantly different temperatures of 27ºC (300 K) and 427ºC (700 K). After optimization of all the structures, vibration frequencies were computed. Thermal corrections were calculated based on translational, rotational and vibrational contributions (Ochterski, 2000). All the calculations were performed using Gaussian 03 program (Frisch et al., 2004) with Density Functional Theory (DFT) at the B3LYP/DGDZVP level of theory. All the thermodynamic parameters were also provided by Gaussian 03 program.
. Results
Burning/pyrolysis experiments
Estimating the experiments temperature range
At the beginning, the temperature range of the experiments had to be determined. The furnace experiments with pine wood were carried out in a N2 and synthetic air (free of CO2) atmosphere. The furnace temperature was increased gradually in 50°C intervals (Fig. 1B), and continuous measurements of the CO2 concentration were performed (Fig. 1A). The only source of CO2 was the reaction of wood B/P, meaning the appearance of CO2 was an indicator of the wood decomposition, with CO2
Fig. 1
Estimation of the experiment’s temperature range (experiments with artificial air). CO2 emission (A) at the temperature increase (B) in pine wood experiment.
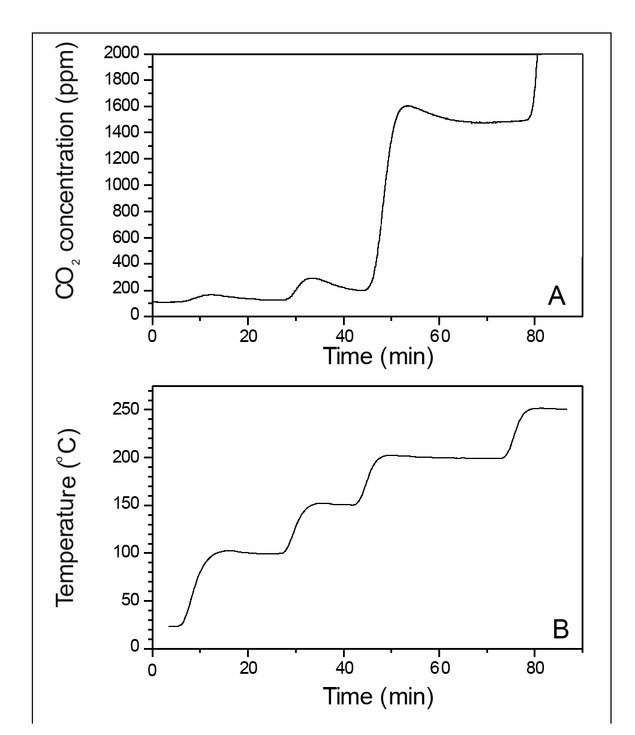
emission. For temperature values <200°C, detected traces of CO2 were below recommended operational range of Picarro Analyzer (100 ppm) and its absolute values must be treated with caution. CO2 concentration increased to 1400 ppm when the temperature was increased to 200°C. After a short time, the concentration stabilized. During the next change of temperature, to 250°C, the CO2 concentration increased beyond the Picarro Analyzer limit (4000 ppm).
Second indicator of reaction intensity was the mass loss during combustion (Fig. 2). Wood samples were placed in the furnace, and the temperature was increased in 100°C intervals from 100 to 600°C. Only the experiment with pine wood showed weight loss at temperatures below 200°C (Fig. 2). For samples of beech, oak and fossil oak, weight loss appeared between 200 and 300°C. The weight loss, up to 600°C, for samples of pine wood was 70%, while for the beech, oak and fossil oak it was smaller, ca. 40–50% (Fig. 2).
Fig. 2
Estimation of the experiment’s temperature range (experiments with artificial air). Mass loss in the furnace experiments with modern wood.
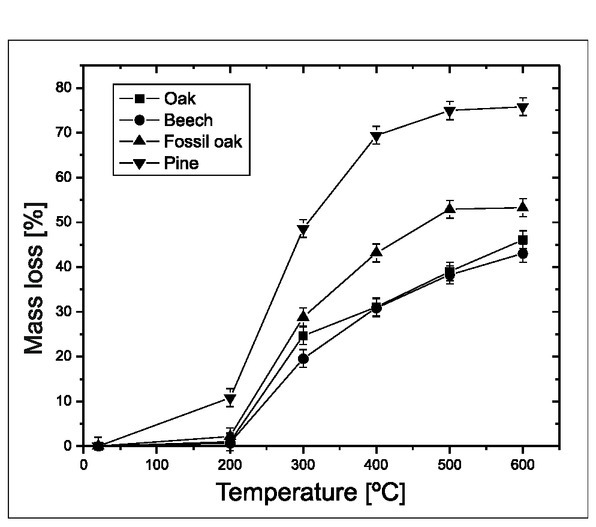
The results suggest that the B/P reaction started at 200–250°C for oak and beech, and below 200°C for pine. Taking this information into account, further experiments with the furnace were performed in the 200–600°C range.
Carbon isotopic composition of combustion and pyrolysis products
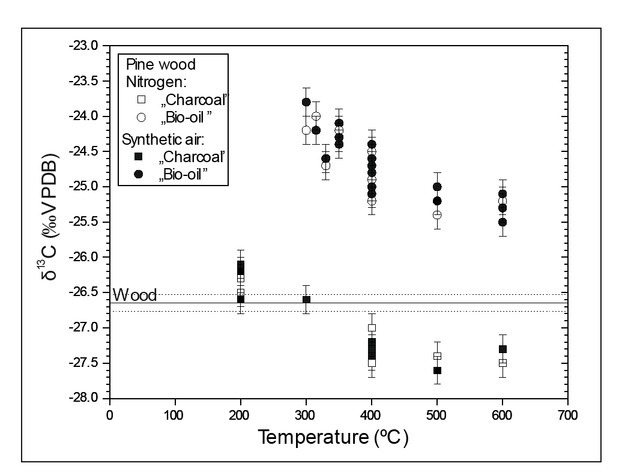
Two heating experiments in the furnace have been performed, the first one, under a N2 atmosphere and the second one, in synthetic air (free of CO2). Examples of results obtained for pine wood are presented in Fig. 3. All obtained results indicate that there were no differences between the carbon isotopic composition of combustion (experiment with synthetic air) and low temperature pyrolysis (experiment in N2). Basing on these results we focused on combustion process (experiments with synthetic air, free of CO and CO2).
Carbon stable isotope composition of the wood combustion products
The first series of experiments were done using burning chamber as simulation of natural fireplace condition. The carbon isotopic composition values of the combustion products (three independent analyses for each one) from natural fireplace simulation are presented in Fig. 4. Calculated “variation factor” (ΔC) with 95% confidence ranges are presented in Table 2.
Fig. 4
Carbon stable isotope composition of combustion products from experiments in burning chamber. W– wood; S0 – soot with no pre-treatment; S1 – soot pretreated by HCl; S2 – soot pretreated by HCl and HF; C– “charcoal”; A – “Acid”; CO2 – carbon dioxide.
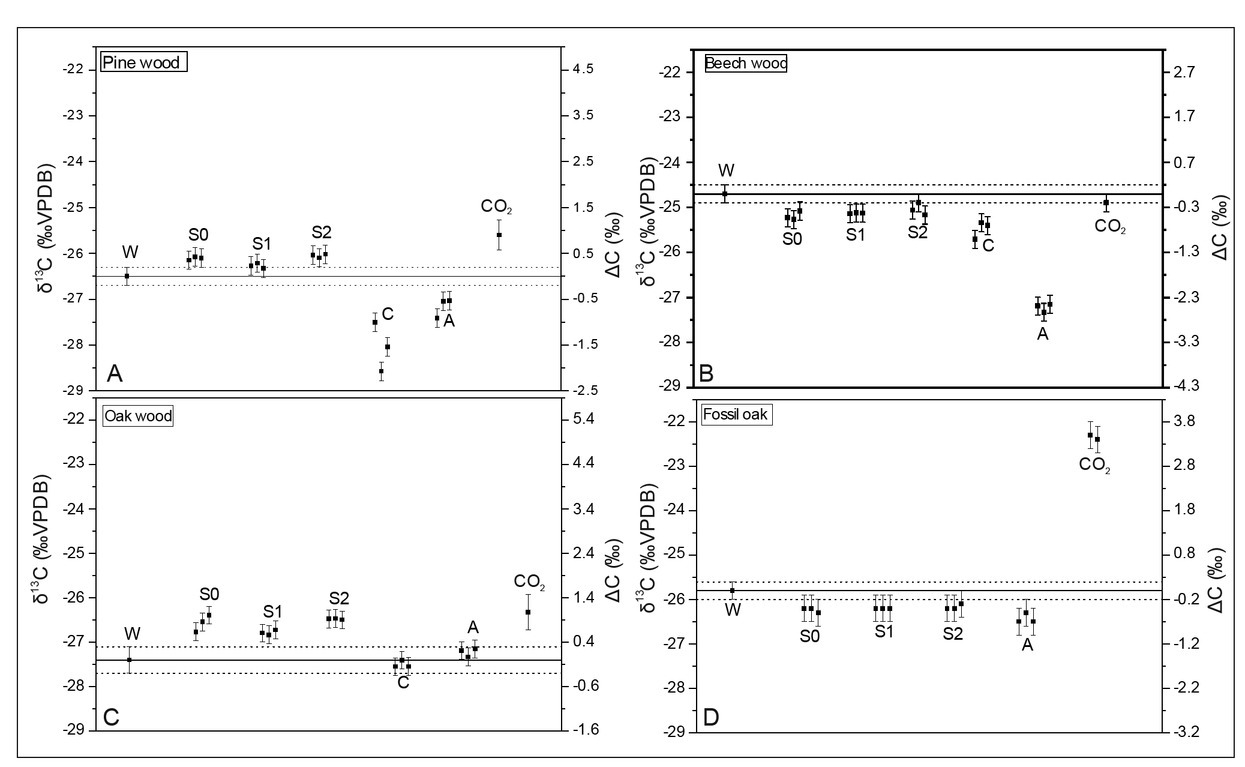
Table 2
“Variation factor” of wood burning products from combustion chamber experiments with estimated 95% confidence intervals*.
The carbon dioxide for all wood types, except beech, was enriched in 13C relatively to the original wood. Values of ΔC for CO2 achieved 0.90 ± 0.38‰ and 3.39 ± 0.21‰ for pine and fossil oak, respectively. The volatile burning products collected after condensation onto the quartz-glass plate were slightly enriched in 13C for pine and oak (ΔC values up to 0.4‰ and 0.8‰ respectively) and depleted for fossil oak and beech (ΔC values up to –0.5‰). The charred wood (“charcoal”) and “ash” samples were generally depleted in 13C relatively to the original wood, except for oak, where differences were in the range of uncertainty.
Next set of experiments with the furnace allowed for investigation of liquid combustion products (“acids” and “bio-oils”). The results of these experiments are presented in Fig. 5 and calculated ΔC values with 95% confidence intervals in Table 3.
Fig. 5
Carbon stable isotope composition of combustion products from furnace experiments. 1, 2 and 3 – general trends of isotopic composition changes for “charcoal”, “acids” and “bio-oil” fraction respectively.
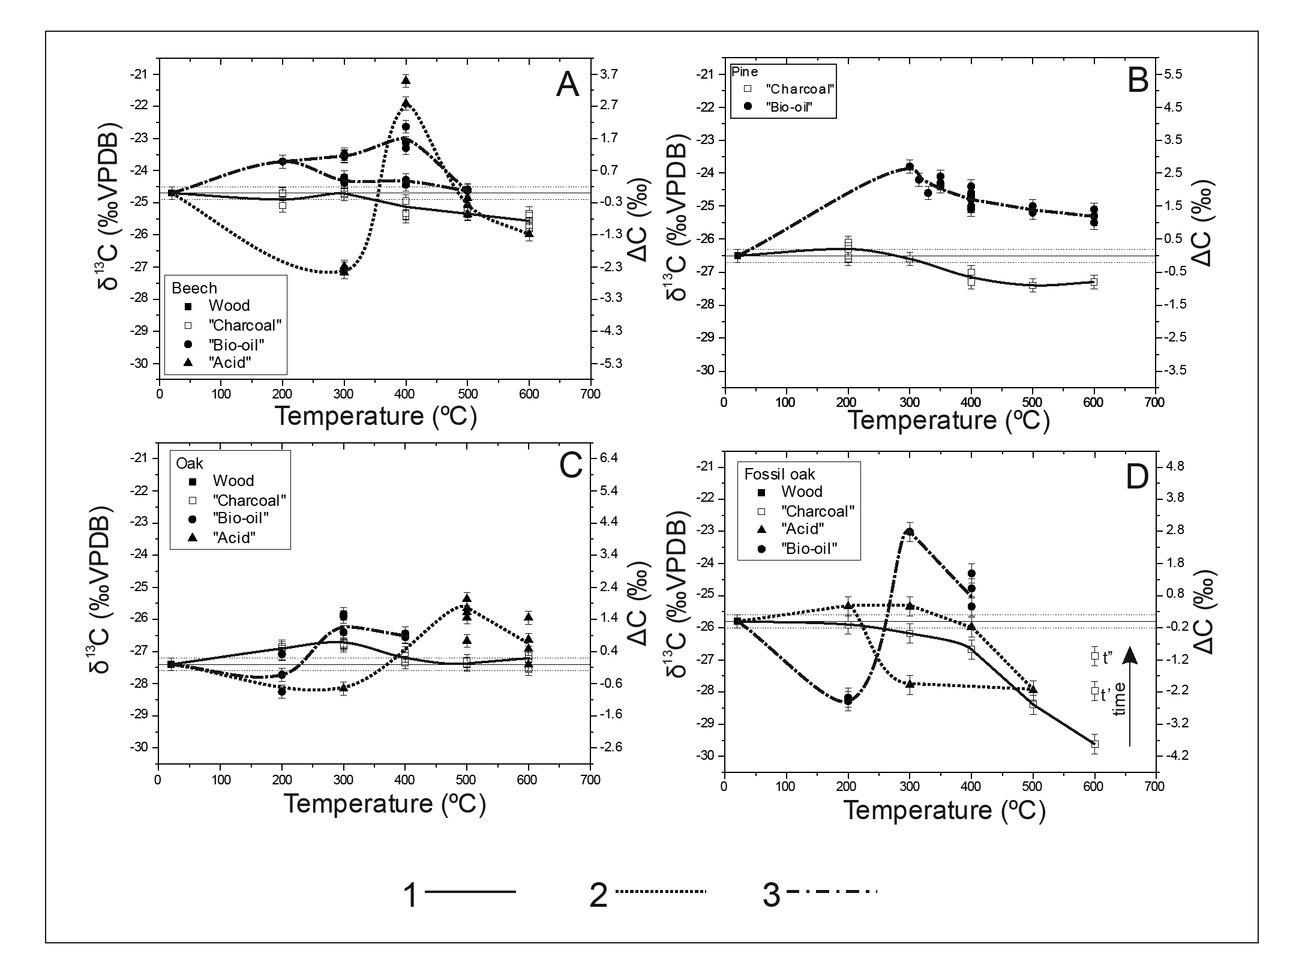
Table 3
“Variation factor” of wood burning products from furnace experiments with estimated 95% confidence intervals*.
At temperatures >300°C, the “charcoal” samples were depleted in 13C, except oak wood samples. The δ13C depletion was continuous as the temperature increased: it was relatively slow for lower temperatures (even with trends for enrichment at 200°C visibly for oak), and much faster above 400°C.
After finishing the experiment with fossil oak, the “charcoal” was still reacted at 600°C, and additional two samples were collected (Fig. 5), one after 60 min (marked as t’; ΔC = –2.22 ± 0.28‰) and one after 120 min (marked as t’’; ΔC = –1.14 ± 0.28‰). These results indicate clear trend in the carbon isotopic composition towards heavier values as decomposition continued.
“Bio-oils” and “acids” exhibited differences in isotopic compositions at low and high combustion temperatures (Fig. 5). At low temperatures, there was a tendency toward δ13C depletion, while at 300°C (400°C for beech), there was maximum of 13C enrichment.
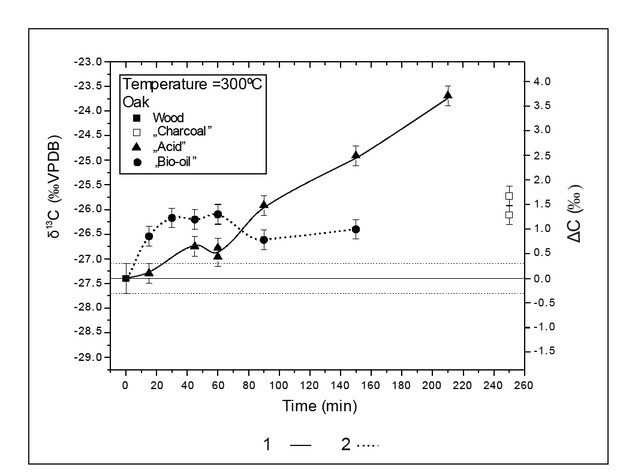
To test and to better understand the relationship between isotopic composition and burning time, another experiment was conducted at constant temperature. The oak wood sample was placed in the furnace preheated to 300°C. “Bio-oil” and “acid” samples were collected for carbon isotopic composition analyses. After 150 min, the release of “bio-oils” ended. The release of “acids” ended after 210 min. After 250 min, only small amounts of grey residuum were still left in the quartz tube. The results of carbon isotopic composition of collected burning products are presented in Fig. 6. After almost full wood decomposition, the remaining residuum was enriched in 13C (ΔC = 1.5 ± 0.37‰). At the beginning of decomposition, there was an enrichment in 13C in the released oils and acids. Shifts toward δ 13C enrichment appeared for both the oils and acids as wood decay continued. Maximum enrichment levels were 1.27 ± 0.36‰ for “bio-oils” after 60 minutes and 3.67 ± 0.36‰ for “acid” after 210 minutes.
Molecular simulations
B/P of cellulose and lignin models
In the first set of simulations’ results, there is visible a significant difference between temperatures of the onset of pyrolysis in comparison to corresponding temperatures in the experiments. This is related to much faster ramp heating rate of the molecular simulations (~2 ns to reach maximum temperature vs. several minutes/hours in the experiments). Similar results were obtained in modelling of pyrolysis of cellulose by Zhang et al. (2016). In spite of this temperature shift, results of ramp heating for different molecules but with the same rate can be compared to each other.
The first set of molecular simulations showed that reactions of thermal decomposition of cellulose and lignin are similar without (Fig. 7A and 7B) and with existence of gaseous oxygen (Fig. 7C and 7D). Cellulose decomposition begins at relatively lower temperatures. The reaction of breaking of its structure occurs at ca. 1000– 1300°C leading to formation of fractions that contain less than 7 carbon atoms. The amount of C4-C7 fraction is decreasing with temperature along with increase of content of lighter molecules (C0-C1 and C2-C3).
Fig. 7
Comparison of cellulose and lignin decomposition and decomposition products evolution with temperature (1°C/ps) basing on molecular simulations.
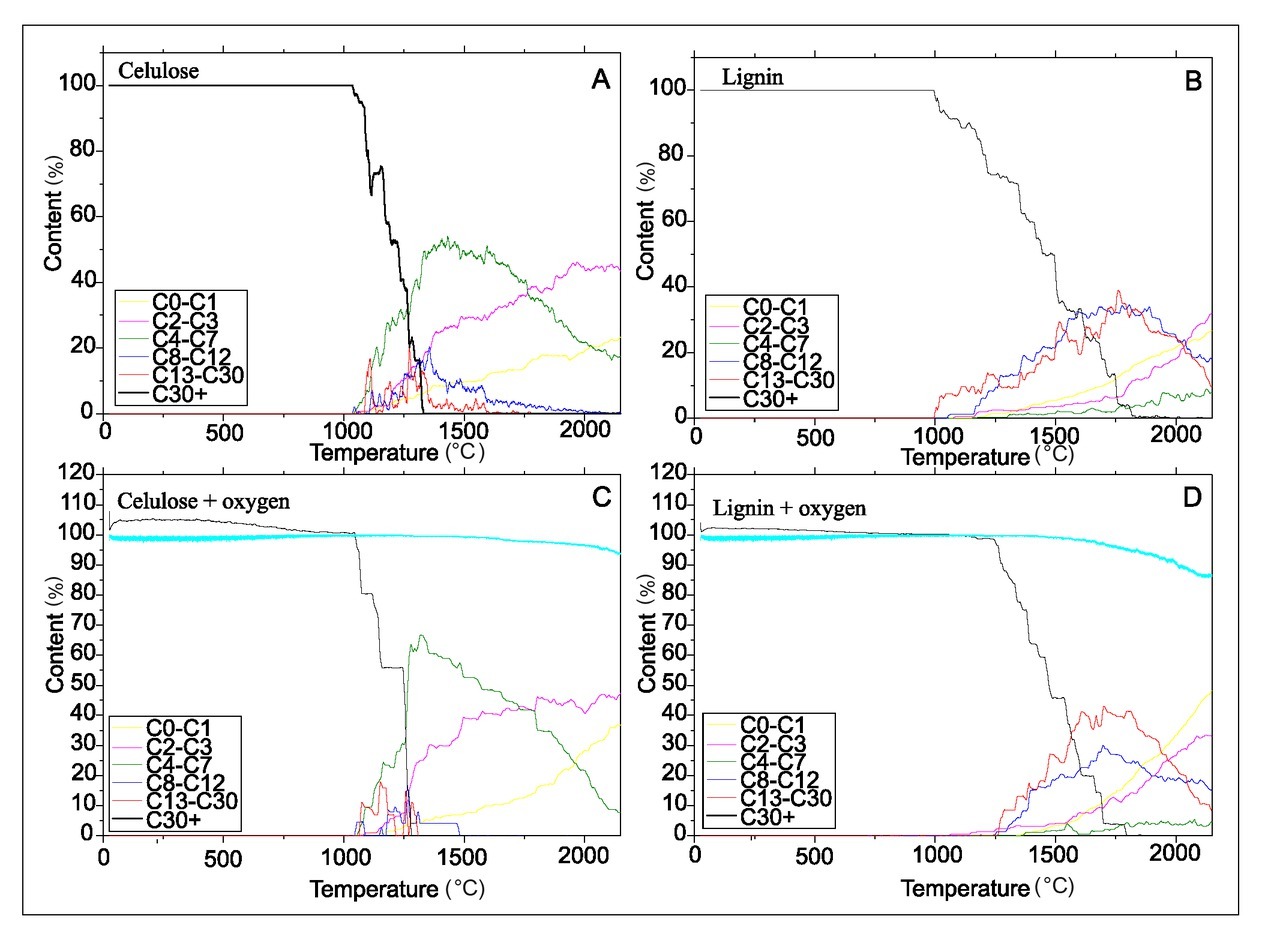
In the Fig. 7C and 7D at lower temperatures there is formation of hydrogen bonds between hydrogen of lignin/cellulose and oxygens of O2 (visible as content of cellulose/lignin above 100%). It is because cutoff for building molecules was set at 1.8 A, which was close to distance of O…H-C, O…H-O in hydrogen bonds. In the case of lignin B/P, significant decomposition of the structure occurs stepwisely at wide range of temperatures: from 1000 to 1800°C – these are equal or much higher than in the case of cellulose. Moreover, in the newly formed B/P products a significant content of heavier C13-C30 and C8-C12 fractions were found.
Isotope exchange between liquid/gaseous products and model of residuum
Table 4 shows calculated Δ energies, Δ enthalpies and Δ Gibbs free energies along with thermal corrections for model isotope exchange reactions 3.2–3.5 at different temperatures. Using the following equation, it is possible to calculate isotopic effect:
Table 4
Differences in energies and entropy of reactants and products for reactions 3.2–3.5 (in kJ/mol and J/mol·K, respectively) for temperatures of 27°C (300 K) and 427°C (700 K) recalculated for one carbon atom, along with equilibrium constants.
[i] All energies in kcal/mol; *ΔEnergy +ZPE; ** ΔEnergy + thermal correction; ***ΔGibbs Free Energy + thermal correction; **** ΔEntropy; ***** calculated based on equation 4.1.
where K – equilibrium constant for reaction, in general α = K1/n where n is a number of exchanged atoms (if n = 1 then K = α); R– ideal gas constant; T– temperature.
Positive/negative values of energies indicates that the reactants are more/less stable than the products, respectively. Isotopically heavier gaseous/liquid products of B/P were always considered as reactants (reactions 3.2– 3.5). This means that, if assuming equilibrium in exchange between pyrene residuum and CO2, this gaseous molecule should always be enriched in heavier carbon isotope. Relationships with temperature is different for other organic molecules: formaldehyde (C1 phase) and glycolaldehyde (C2 phase) are depleted in 13C at lower temperatures, while enriched at higher temperatures >427ºC (700 K). Acetone (C3 phase) is expected to be depleted in 13C even at higher pyrolysis temperatures.
There are three main sources of isotopic effect for the studied reactions 3.2–3.5:
– Zero-point energy (ZPE) correction, which arises from the fact that the lowest possible energy of the molecule at temperature of 0K is not the electronic energy but is higher and is related to molecular vibrations. Influence of this correction is different for CO2 (positive) than for other product molecules (negative) in comparison to pyrene (Table 4 – third column).
– Thermal corrections, which are result of occupation of certain vibrational and rotational energy levels by molecules at considered temperatures (supplementary materials contains table with listed all thermal corrections). In the case of all the studied reactions 3.2–3.5 this effect leads to enrichment of gaseous/liquid products in 13C, comparing to energy levels that takes into account only ZPE (Table 4 – fourth column).
– Differences in entropy. Generally, higher entropy is observed for isotopically heavier molecules (supplementary materials contains table with translational, rotational and vibrational contributions to entropy). Based on the received results it is visible that in the case of all reactions 3.2–3.5 there is a decrease of entropy (Table 4), which according to relation: ΔG = ΔH – TΔS leads to increase of ΔG, and thus indicates relative enrichment of gaseous/liquid products in 13C (preferential shift of all the 3.2–3.5 reactions to left side – towards reactants). Generally, at constant pressure: ΔH = ΔE – pΔV
– p – pressure; ΔV – difference in volume between substrates and products. Because there is no difference in volume of the molecules substituted with different carbon isotopes: ΔV = 0 and therefore in all calculations ΔH = ΔE.
Summarizing all the three contributions to isotopic effect (Table 4 – fifth column): at higher temperatures there is possibility of reversal of preferential isotope equilibria comparing to those from lower temperatures, which is due to the effects of differences both in entropy and thermal corrections to energy.
. Discussion
The isotopic composition of the B/P products depended first on the isotopic composition of the initial material. The wood samples studied are typical terrestrial plants that use a C3 photosynthesis pathway. The typical δ13C value for C3 plants is in the range from –25‰ to –32‰ (mean 28‰; Wickman, 1952; Baertschi, 1953 and Craig, 1953, 1954) and the carbon isotopic composition of the wood samples used in this study agrees with these data.
Wood is a complex material and consists of several phases with different carbon isotopic composition. The major wood components, cellulose and lignin, differ by 4–7‰. Cellulose is enriched by 1–2‰, and lignin is depleted by 2–6‰ relatively to the whole wood composition (Benner et al., 1987). These main wood components also have different B/P characteristics (Rowell and LeVan-Green, 2005). Whole wood thermal degradation starts below 250°C. At 300–375°C, most of the carbohydrate polymers, except lignin, are degraded. Hemicellu-lose decomposition starts at ca. 225°C and is almost completed by 325°C. The cellulose is more stable, and its most intensive degradation takes place in a short temperature range above 370°C (Rowell and LeVan-Green, 2005). The main component of the wood cell wall is cellulose and its degradation characteristics dominate the process of wood B/P (Shafizadeh, 1984 and Rowell and LeVan-Green, 2005). The main products of cellulose degradation are volatile gases, while the main lignin decomposition products are tar and char (Rowell and LeVan-Green, 2005). Different carbon isotopic composition of component with different B/P characteristic may be a key for interpretation of our experiments results.
The experiments performed in this study show that the B/P initiation temperature is dependent on the type of wood. For the beech and oak, B/P decomposition starts at 200–250°, while for pine at lower temperatures (< 200°C). This agrees with results of Shafizadeh (1984) and Rowell and LeVan-Green (2005).
Variation in isotopic composition of B/P products depending on temperature
General trends of carbon isotopic changes in B/P products obtained in experiments agree with results published earlier by different authors. In general, it is agreed that the isotopic composition of charcoal differs from wood by up to 2‰ (Ferrio et al., 2006; Turney et al., 2006; Ascough et al., 2008; Das et al., 2010 and Bird and Ascough, 2012). It is also agreed that it is temperature dependent. Below 300°C, there is an increase in δ13C in charcoal, which is interpreted as a loss of isotopically lighter phases and/or more resistance of isotopically heavier cellulose (Jones et al., 1993; Czimczik et al., 2002; Poole et al., 2002; Hakkou et al., 2006 and Bird and Ascought, 2012). Above 300°C, charcoal is depleted by 1–2‰ relatively to wood (Jones and Chaloner, 1991; Jones et al., 1993; Bird and Grocke, 1997; Czimczik et al., 2002; Turney et al., 2006; Ascought et al., 2008 and Bird and Ascought, 2012). This is explained by the preferential decomposition of isotopically heavier cellulose. Above 400°C, further 13C depletion is interpreted as caused by preferential loss of 13C during C=C bond formation in polyaromatization (Qian et al., 1992 and Krull et al., 2003). Effect of temperature relation between charcoal (residuum) δ13C and temperature were visible in the results of presented studies (experiments with furnace). Initially, at temperatures < 300°C, we observed an increase in δ13C, with maximum values at 300°C (200°C for pine) but isotopic variation factor (ΔC) values were significant only for oak and pine (ΔC200 were 0.43 ± 0.36‰ and 0.21 ± 0.18‰ and t-values for Student tests were 2.479 and 2.453, respectively; critical value is 2.032). At higher temperatures, the δ13C values decreased until 500°C, and then stabilized for pine and modern oak. For all wood types, except oak, δ13C depletion was significant at the temperature 400°C and above (Table 3). The biggest differences between charcoal and wood δ13C was for fossil oak depletion at the high temperature (ΔC600 were –3.88 ± 0.29‰ and t-values for Student tests were 18.786 and critical value 2.201) Experiment with fossil oak was extended for additional 120 minutes and an extended period of wood decomposition at 600°C, caused a significant increase in the δ13C value (Fig. 5D and Table 3) from –3.88 ± 0.29‰ to –2.22 ± 0.28‰ (after additional 60 minutes) and –1.14 ± 0.28‰ (after next 120 minutes).
In the furnace experiments, the samples of “acids”/”bio-oils” were collected from the material condensed on the cool surface of the quartz sample tube. Like for “charcoal”, the carbon isotopic composition of these products is temperature dependent (Fig. 5). Depletion in 13C of “bio-oils” samples for fossil oak at lower temperatures (200°C) may suggests light isotopically phases as a primary wood component of the source of these materials. But, beech “bio-oils” samples at 200°C are enriched in 13C (ΔC = 0.97 ± 0.29‰). Similarly, “acids” samples from fossil oak at 200°C are enriched in 13C (ΔC = 0.40 ± 0.28‰). Other results obtained for 200°C are statistically nonsignificant. For the range 300–500°C, “bio-oils” and “acids” are enriched in 13C, suggesting heavier cellulose components as a primary material. These results lend further support to the literature explanations for charcoal carbon isotopic fractionation, where preferential decomposition of lighter phases is observed at lower temperatures and heavier cellulose degrades at higher temperatures (Jones and Chaloner, 1991; Jones et al., 1993; Bird and Grocke, 1997; Czimczik et al., 2002; Poole et al., 2002; Hakkou et al., 2006; Turney et al., 2006; Ascought et al., 2008 and Bird and Ascought, 2012).
Performed molecular simulations offers another alternative explanation of isotopic variation of B/P products. Results of simulations of isotope exchange between gaseous/liquid products and model of residuum show significant differences of equilibrium constant for exchange reaction (e.g. 3.2–3.5) depending on temperature (Table 4). This can lead to depletion of 13C in gaseous/liquid products for lower temperatures and enrichment for higher ones. Overally, this will lead to opposite trends in 13C content variation for residuum (”charcoal”), eventually giving depleted solid product. In our opinion, this alternative explanation can be superimposed on differences in decomposition of various wood components and the final isotopic composition of B/P products is also resultant of evolution of temperature during combustion.
Significant differences between δ13C of charcoal produced by pyrolysis and incomplete combustion reported in published studies were explained by the acceleration of cellulose decomposition by pyrolysis in comparison to decomposition in the presence of O2 (Turney et al., 2006; Ascough et al., 2008; Das et al., 2010 and Bird and Ascough, 2012). The experiments with pine wood (Fig. 3) do not show differences in the carbon isotopic composition of “charcoal” and “bio-oils” in pyrolysis (in N2) and heating in the presence of O2 (burning in artificial CO2-free air). This result is also supported by molecular simulations showing that decomposition of model of cellulose and lignin is very similar with and without existence of additional O2 (Fig. 7).
Variation in isotopic composition of B/P products in process duration
Published B/P experimental results for δ13C values of charcoal suggested no time dependence of the carbon isotopic composition (Turney et al., 2006; Ascough et al., 2008; Das et al., 2010 and Bird and Ascough, 2012). The B/P experiment with oak at 300°C showed significant changes in isotopic composition of incomplete burning products with time (Table 3 and Fig. 6). The continuous decomposition of wood with time reflects the thermal stability of each wood component. Initially, after 15 min, “oils” were enriched in δ13C (ΔC = 0.83 ± 0.36‰) and acids was not showing isotopic fractionations (ΔC = 0.07 ± 0.36‰; t-value for Student test was 0.24 and critical value 2.042). After 45 minutes acids were enriched in relation to wood composition (ΔC = 0.62 ± 0.36‰; t-value was 2.28). After 90 min B/P decomposition, acids have started to be more enriched in 13C than oils. The maximum acid enrichment was achieved after 210 min in the last acid samples that could be collected (ΔC = 3.67 ± 0.36‰). After 60 min processing, oils showed a decrease in the level of enrichment. The cellulose was likely to be decomposed quickly, and its effect was only visible for a short time in the initial period of the decomposition. Later carbon isotopic composition was dominated by the more stable lignin and isotopically lighter than cellulose.
In the simulation of natural fireplace experiment the carbon isotopic composition of CO2 indicated enrichment in 13C isotope relatively to “ash” (Fig. 3). This effect can be explained by means of molecular simulations. Assuming equilibrium in isotopic exchange between gas and residuum, δ13C values would be increased by ca. 20‰ (Table 4). Lower experimental δ13C values indicates that there is no equilibrium in isotopic exchange. The trend is however similar in experiments and in molecular simulations.
Difference between fossil and modern oak wood
In all the experiments, difference between fossil and modern oak wood is visible in the mass loss, carbon isotopic composition of the B/P products and its temperature dependence. For fossil oak, the δ13C value of the condensed volatiles was depleted (ΔC around –0.4‰; see Table 2) vs. the whole wood, while for modern oak it was enriched (ΔC around 0.8‰; see Table 2). Probably, for the δ13C value of the condensed volatiles from fossil oak, lignin was the dominating initial component, while for fresh oak it was cellulose. These results can suggest that that, during wood fossilization, cellulose, the component enriched in 13C, was preferentially decomposed. A similar effect was reported for wood samples of different ages and occurrence conditions (Fengel and Munich, 1991). However, process of wood decomposition are dependent on the environmental condition at the time of fossilization. The relative carbon isotopic composition of volatiles collected on the glass plate was dependent on the wood type as a result of the proportional differences between cellulose and lignin. This is probably the reason for the different behaviour in the beech and pine wood experiments.
. Conclusions
This study shows differences in the carbon isotopic composition of wood burning/pyrolysis products. The extreme values of the variation factor were around –4‰ for charcoal from fossil oak at 600°C and around 3‰ for “acids” from beech wood at 400°C. The typical range of variation was between –2‰ and 2‰.
The carbon isotopic composition differentiation in B/P products is temperature and time dependent. Variation factor values are wood type dependent, but general trends are similar for all types of modern wood examined (Fig. 5). The different behaviour of fossil oak in the B/P decomposition process is a result of selective decomposition of some wood components during fossilization.
The observed temperature dependence for the carbon isotopic composition is a result of two effects. The first one is the different thermal stability of the main wood components, which are also characterized by different carbon isotopic composition. Thus, the less thermally stable and isotopically lighter lignin decomposition controls the isotopic composition of the B/P products at the lower temperatures, while heavier cellulose is the dominant component at temperatures above 300°C. Superimposed on this effect there can also be differences in isotopic composition of gaseous/liquid products that have significantly different equilibrium constants for reaction of isotopic exchange with residuum.
The experiment with B/P decomposition of oak wood at 300°C shows the time dependence of the carbon isotopic composition for all B/P products. It confirms that B/P should be treated as a continuous process, with the results depending on the degree of process development.
This is especially important given the number of studies using the variation in the isotopic composition of combustion products as a record of paleoenvironmental change. Natural burning processes are dynamic and temperature, O2 availability and other conditions change rapidly. Collected burning products from geological or archaeological sites contain no information about temperature or other conditions of the burning process. It is especially important when studies are performed using samples of burning products separated from deposits as a dispersed organic material. The application of chemical pre-treatment methods necessary for burning products (e.g. soot aggregates) separation may introduce additional isotopic fractionation (see Table 2).
The differences in the carbon isotopic composition of the combustion products and its dependence on temperature or reaction time make it necessary to take great care in studies that use the isotopic composition of combustion products as a paleoenvironmental proxy or as an isotopic metric for the identification of source material.
Future studies
The differences in the isotopic composition of carbon in soot aggregates have become a motivation for expanding experimental research. The studies carried out do not provide definitive and sufficient answers to the questions posed, but they indicate the importance of the complex study of combustion products instead of focusing only on selected products. The most important seems to be the extension of the research to chemical analysis of B/P products, especially volatile components condensing on collecting plates and gaseous products. Molecular simulations seem to be a good tool that can be particularly useful in explaining the differentiation of the carbon isotopic composition during B/P processes. Finally, it is advisable to collect a larger number of research results so that it is possible to analyze the significance of the differences found, as well as the variability of the obtained results for a larger number of wood samples.