
. Introduction
The climate is changing, and we see the effects more clearly from year to year. The average annual temperature in Poland has increased by almost 1°C, since the 1950s (Łabędzki, 2004). Since the second half of the 1990s, we have observed a significant increase in the frequency of intense precipitation, which has an impact on water erosion, flood risk, and landslides (Kundzewicz and Matczak, 2012). In 1997, 1998, 2001, and 2010, Poland was hit by catastrophic floods (Kundzewicz and Matczak, 2012). Droughts in Poland are another serious problem (Łabędzki, 2004; Kundzewicz and Matczak, 2012). In the last 25 years, droughts have spread to larger areas, been more frequent, and their effects were more severe on the environment. In forests, the effects of drought are visible not only in the form of declining trees and deforestation but also in the reduction of tree resistance to pests and diseases (Łabędzki, 2004).
Trees with their own unique pattern of ring widths are great natural paleoclimatic archives. Their chronologies contain information about events that took place decades or hundreds of years earlier, and the seasonal increments of wood ensure high temporal accuracy of the data (McCarroll and Loader, 2004). In the last 25 years, tree-ring analysis, including stable carbon isotope composition, has become more popular (Shestakova and Martínez-Sancho, 2021). These analyses provide a broader understanding of how trees respond to external stimuli, such as pollutant emissions, temperature changes, and drought-related water shortages. Numerous studies have shown that increased SO2 emissions affect the carbon isotopic composition of the wood and the width of the annual tree rings (Martin et al., 1988; Savard et al., 2004; Rinne et al., 2010). Many authors have also attempted to find a relationship between δ13C values and meteorological conditions. Shestakova et al., (2019) showed significant correlations between δ13C temperatures and precipitation for the summer months, observed at 20 sampling sites located in Europe; however, the values of the correlation coefficients for individual locations differed. There are studies that analyse the influence of many external factors (temperature, precipitation, pollution) on the δ13C and intrinsic water use efficiency (iWUE) values. These studies compare the sensitivity of trees of different species (Granda et al., 2014; Shestakova et al., 2019) or those growing in various locations (Rinne et al., 2010; Shestakova et al., 2019) to these factors. However, there is a lack of research that would focus on comparing trees of the same species, growing under the same conditions in the same area, but having different health status.
Our hypothesis is that the annual tree ring width, carbon isotopic composition, iWUE, and the sensitivity to external factors may differ for the trees growing in the same area but being in different health status. Our research aims to better understand the physiological response of trees to drought and other stress factors. The objectives of this research are:
to create a local chronology of the width of annual increments, δ13C, and iWUE for five reference Pinus sylvestris L. trees, being representative for the study area,
to conduct dendrochronological analyses, δ13C analyses, and iWUE analyses of two P. sylvestris L. trees growing side by side in identical conditions but being in different health states (healthy and declining), in order to indicate potential differences in their characteristics and sensitivity,
to compare the results of analyses performed for individual trees with analyses for a representative group in order to validate the results.
. Materials and Methods
. Study Area
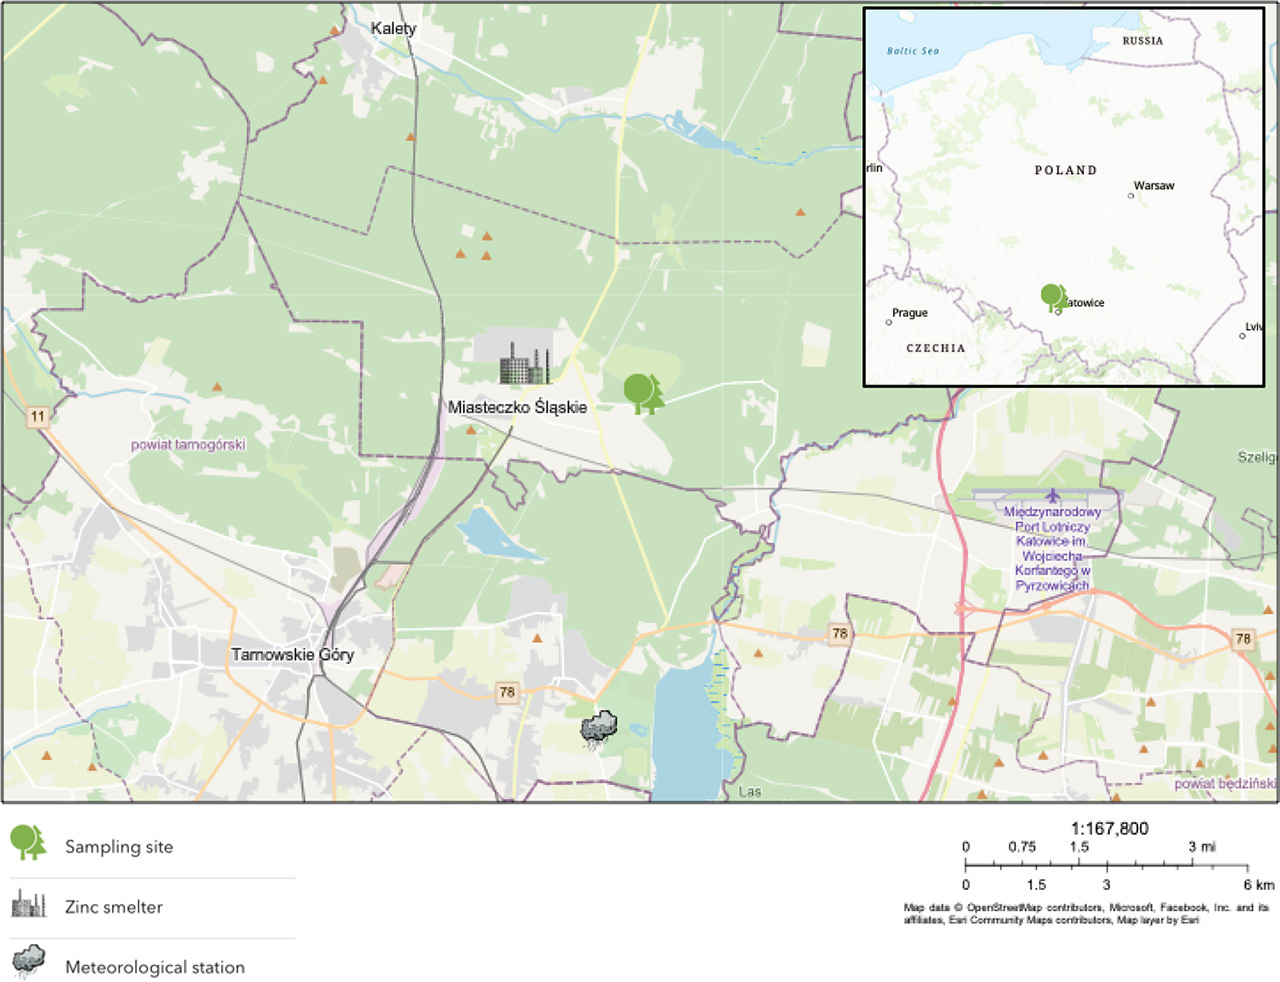
The research site is localized in the Silesian Region, described as the most polluted in Poland (Dulias and Hibszer, 2004). The region is characterized by a high population density, prominent urbanization, and the presence of numerous mines and industrial plants (Miernik, 2017). Despite the poor air quality, the region ranks fifth in Poland in terms of forest cover per unit area. According to the Szmidla et al. (2021) the second largest forest area (14,675 ha) affected by drought damage occurs in the capital of the Silesian Voivodeship (Szmidla et al., 2021). These factors make the vicinity of Silesia a suitable area for studies of the sensitivity of trees to drought and emitted pollutants. The samples were collected in the Świerklaniec Forest District (50°29′42.7″N 18°57′39.1″E) (Fig. 1), containing 18,100 ha of forested land (Główny Urząd Statystyczny, 2021). The area of the forest district covers 12 localities (Nadleśnictwo Świerklaniec, 2022). The district is highly urbanized and includes areas with high population density. Therefore, it is not unusual to find illegal garbage dumps and vandalism of signage and trash bins in the forests (Nadleśnictwo Świerklaniec, 2022). The Świerklaniec Forest District has ca. 52% forest cover, of which 75% are pines, 12% birch trees, and a few percent each of oak, spruces, and other species (Gmina Świerklaniec, 2022). The dominant geological surface formation is sandur sands and gravel-type soil (Lasy Państwowe, 2023). In the central part of the forest district, 9 km from the sampling site, there is a Świerklaniec meteorological station (Fig. 1), from which data on average monthly temperatures and monthly sum of precipitation were obtained. Actively operating zinc smelter ‘Miasteczko Śląskie’ is located 3 km west of the site (Fig. 1).
. Meteorological and Pollution Data
For the meteorological station ‘Świerklaniec’ (the closest station to the sampling site 50°26′N 18°57′E), data on monthly average temperatures and the monthly sum of precipitation were available for the period 1968–2015. These data were obtained from the website of the Institute of Meteorology and Water Management National Research Institute (Polish Institute of Meteorology and Water Management [IMGW-PIB], 2022). In 1968–2015 at ‘Świerklaniec’ meteorological station, the warmest month was July (the long-term average monthly air temperature is 18.0°C), and the coldest was January (−2.0°C) (Polish Institute of Meteorology and Water Management [IMGW-PIB], 2022). Due to the lack of long-term wind direction data for Świerklaniec, more general data on the most common wind directions in Poland were obtained. For most of the year, western winds prevail in Poland; in the summer, northwestern winds also occur, while in winter, southwestern winds dominate (Dygulska and Perlańska, 2015). In autumn, the most common winds are eastern and southeastern (Dygulska and Perlańska, 2015). This means that for most of the year, the wind blows from the zinc smelter toward the research site.
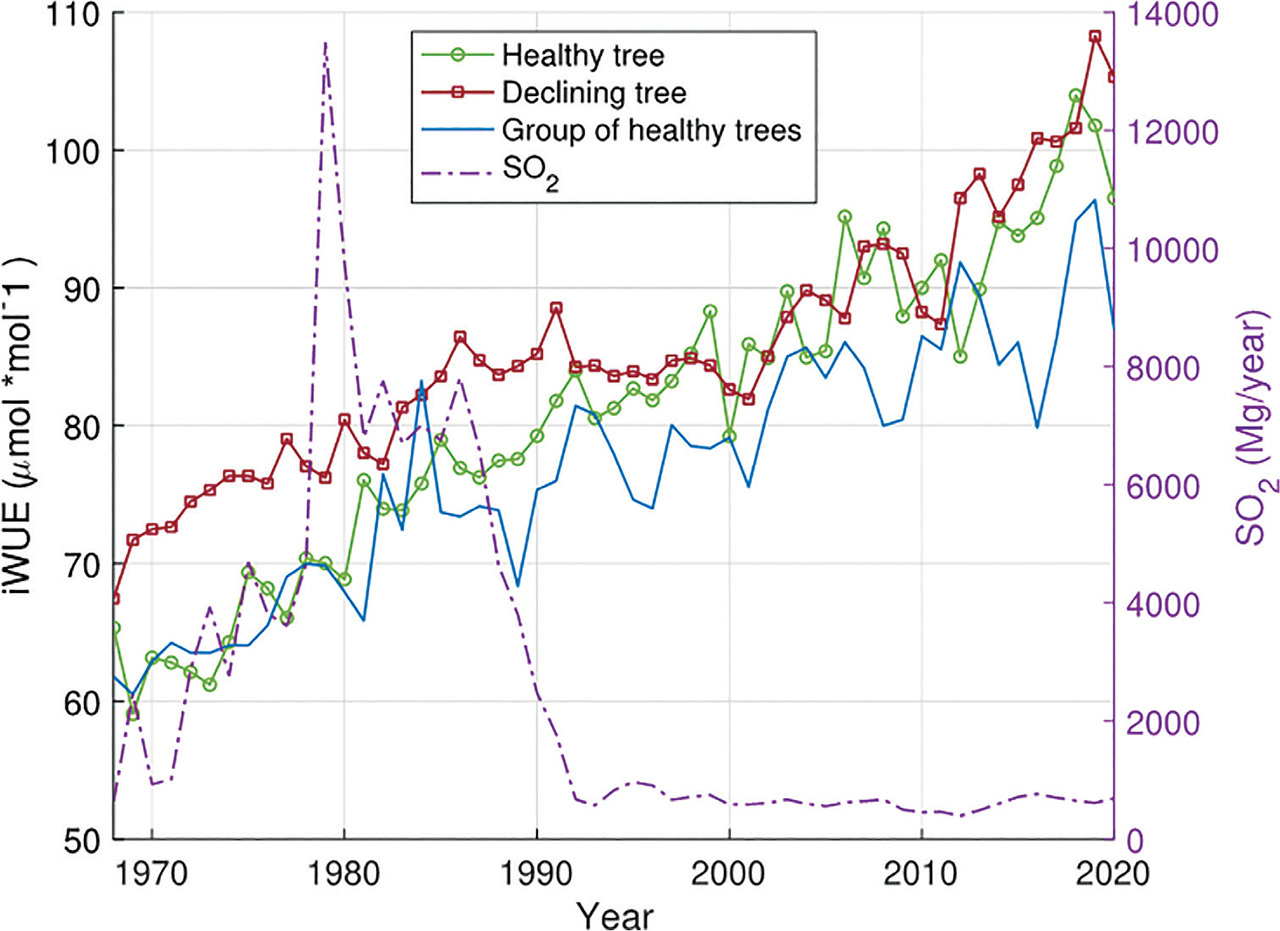
On request, data on sulphur dioxide emissions in the years 1968–2020 were obtained from the nearby zinc smelter ‘Miasteczko Śląskie’ (50°30′3.146″N 18°55′32.321″E). Most of the pollutants were emitted at the turn of the 1970s and 1990s (the average SO2 emission was 5472 Mg/year); in 1992, there was a significant decrease in emissions and the average calculated until 2021 fell to 647 Mg/year.
. Tree Ring Width Analysis
The samples for dendrochronological tests were collected in May 2021 and November 2022. The increment borer with a diameter of 5 mm was used to collect 4 samples from each P. sylvestris L. tree. We took samples from a pair of healthy and declining trees, growing next to each other (1 m apart), and 5 other trees, in good health condition (large, green crowns, no mistletoe, no visible insects) growing in the same forest, to create a local, representative chronology for this area. Prior research on climate growth had made use of the limited number of trees (Leonelli et al., 2014, 2017; Marini et al., 2019); five trees is also thought to be sufficient, when reconstructing environmental variability from stable isotopes in tree rings (Leavitt and Long, 1984; Robertson et al., 1997). To determine the age of the trees and the width of their annual increments, dendrochronological analysis was performed using the LINTAB tree-ring measuring device (Frank Rinn, Heidelberg, Germany) combined with a microscope Zeiss Stemi 305 equipped with a camera Axiocam 208 colour and TSAP-Win software (Rinn, 2003) available at the Silesian University of Technology. The consistency of trends between several tree ring width (TRW) series was assessed using the Gleichlaufigkeit (GLK) measure (Eckstein and Bauch, 1969). To cross-date tree rings, the dplR package in R-studio was applied. The program computed TRW correlation coefficients between a given sample and residual samples from several tree cores. COFECHA was used to verify the cross-dating quality and confirm the consistency of TRW series among tree cores from the same group (Holmes, 1983). Also, age-related and non-climate-related trends were eliminated using the ‘dplR’ package by using an age dependent spline with a 50% frequency cut off (Bunn, 2008). This allowed for the gathering of the ring width index (RWI) standardized chronology and its sensitivity for the reference trees and RWI records for the healthy and the declining tree separately.
. Carbon Isotope Analysis
All dendrochronologically analysed samples were further analysed to determine their carbon isotopic composition. The samples were divided into annual increments, then chemically treated (with NaClO2, CH3COOH, NaOH 10%, NaOH 17%, HCl 1%) to remove other wood constituents and to obtain α-cellulose according to the procedure described by Green (1963). In addition, an ultrasonic bath was used for extraction (Pawelczyk et al., 2004). The prepared α-cellulose was weighed and placed in tin capsules in the amount of 150–200 μg. The samples and standards packed in the capsules were introduced into the IsoPrime mass spectrometer coupled with the EuroVector elementar analyser. The carbon isotope values are expressed relative to the international Vienna Pee Dee Belemnite (V-PDB) standard in the delta notation (in ‰) as follows:
where R is the ratio of the heavy to light isotopes in the sample and in the standard (Piotrowska et al., 2020). δ13C were measured according to Piotrowska et al. (2020), and the isotope ratio mass spectrometry (IRMS) internal error plus the standard deviation of the three results were used to compute the uncertainty, which was ± 0.1‰. Differences in the isotope composition of an element occur in nature depending on processes that produce the substance containing the element in a phenomenon known as isotope fractionation (McCarroll and Loader, 2004). The isotopic fractionation of carbon in trees relative to carbon in atmospheric CO2 is given by the formula: where δ13Cp is the carbon isotopic ratio in the tree-ring and δ13Ca is the carbon isotopic ratio in the atmospheric CO2. The annual δ13Ca values were calculated based on the equation (δ13Ca = −0.0266t−1.318) provided by Skrable et al. (2020), where values for time t starts from 1750 (t = 0). The parameters of this equation were estimated from a plot of the Antarctic ice core measurements provided by the National Oceanic and Atmospheric Administration (NOAA). Additionally, the δ13Ca values were validated by comparing with the values given by McCarroll and Loader (2004), obtained by interpolating the very accurate δ13C atmospheric records for the Antarctic ice cores for the time period 1850–2003. It should be noted that McCarroll and Loader (2004) estimated δ13C atmospheric data for the so-called ‘clean air’ (other than the air at the sampling site). The stable carbon isotope ratio was also expressed as changes in water-use efficiency. iWUE was defined as: where ca is atmospheric CO2 concentration (estimated values are obtained from Robertson et al. [2001]) and ci is the intercellular CO2 concentration. The ci value was obtained from the equation: with an assumed values of a = −4.4 and b = 27 (McCarroll and Loader, 2004).δ13C records were plotted using the dplR package (Bunn, 2008). The treeclim package (Zang and Biondi, 2015) was used to check the potential correlations between δ13C, temperature, and precipitation. In this package, correlations are calculated using the Pearson’s linear correlation coefficient. Analyses were conducted for the years 1968–2015 (due to limited data availability), and the dendroclimatic window was set from May of the previous year to the current year October. At a 95% significance level (p < 0.05), the static correlations were calculated. The differences between the reference trees, the healthy and the declining trees, were assessed using the two-tailed distribution of Student’s t test, with statistically significant values for p < 0.05 (Kim, 2015).
. Results
The average age of the trees used to create the representative RWI chronology is 74 years; the length of the chronology is 91 years. In the case of the healthy tree, its age was estimated at 73 years and the length of the RWI record at 78 years. The declining tree was 71 years old and its RWI record was 74 years long. Similar trends can be observed in the RWI chronology for the reference trees and RWI records for the healthy and the declining tree. In the years 1975–1979, the width of annual increments had a downward trend (mean R2 = −0.84), in the years 1980–1994 a clear upward trend (mean R2 = 0.80) occurred, and in the last analysed stage, 1995–2020, a downward trend appeared again (mean R2 = −0.61) (Fig. 2A). Although the general growth trends are similar for all three groups, differences in the RWI values between individual trees were noticed in some time intervals. In the first 8 analysed years (1968–1975), the RWI was the highest for the declining tree, and the values for the healthy tree were significantly lower (p < 0.05). This relationship was reversed in 1980–1986, when the declining tree had significantly lower RWI values (p < 0.05) (Fig. 2A). Additionally, no statistically significant differences were observed in the RWI record for the healthy tree and the reference trees.
Fig 2.
(A) – RWI record for the healthy tree, the declining tree, and the reference trees (B) – δ13C record for the healthy tree, the declining tree, and the reference trees. RWI, ring width index.
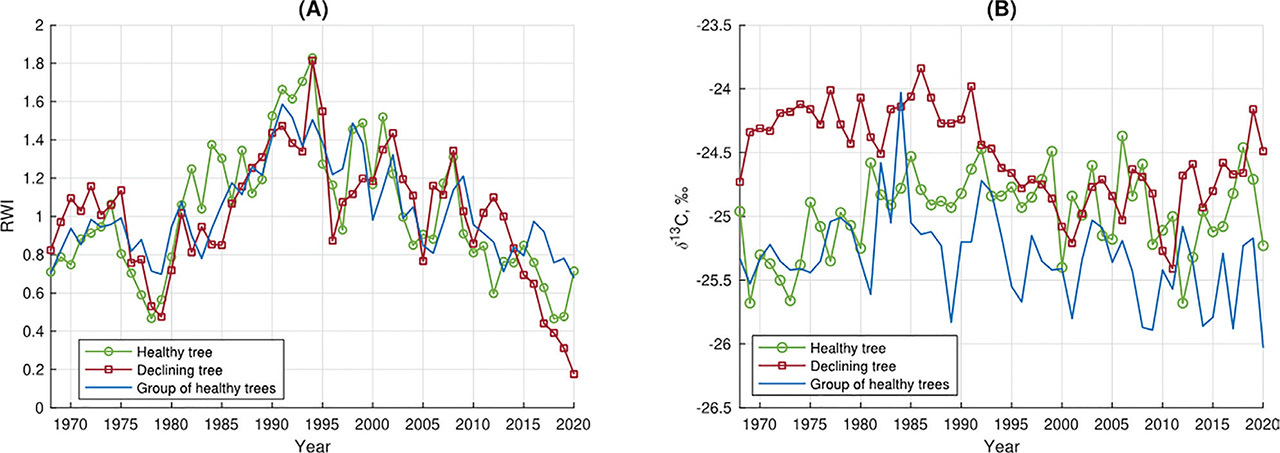
In the case of δ13C records, the trends and dependencies are different than for the RWI records (Fig. 2B). The greatest difference in δ13C records for the declining and the healthy trees can be seen in the years 1968–1991 (Fig. 2B). Both records are clearly separated from each other, and the declining tree has significantly higher (p < 0.05) δ13C values than the healthy tree. Additionally, in the case of the healthy tree, an increasing trend can be observed (R2 = 0.52), while for the declining tree, there is no trend (Fig. 2B). During this period, there are no significant (p < 0.05) differences between the δ13C of the healthy tree and that of the reference trees. In the years 1992–2001, the declining tree had a clear downward trend (R2 = −0.90), while for the healthy tree, there was no trend; however, the δ13C for both trees were similar, and there was no statistical significant (p < 0.05) difference between them (Fig. 2B). Significantly lower (p < 0.05) values (compared to the δ13C records of the healthy and the declining trees) occur in the δ13C records for the reference trees. After 2002, the differences in the δ13C records for all trees are statistically significant (p < 0.05); we do not observe a trend for any of the groups, and the δ13C values for the declining tree are significantly (p < 0.05) higher than the δ13C for the remaining trees (Fig. 2B).
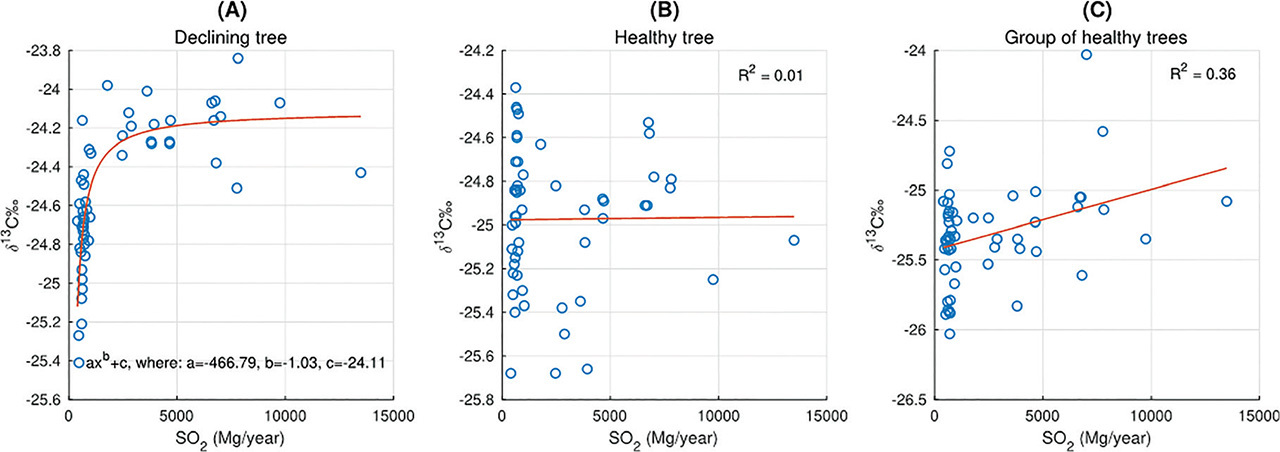
The declining tree showed great sensitivity to temperature changes (Fig. 3). Significant (p < 0.05) negative δ13C-temperature correlations were observed in 6 months of the 18 months analysed. Significant correlations occurred in the summer months of the current and previous year, as well as in April of the current year. In the case of the healthy tree and the reference trees, we observed less statistically significant δ13C-temperature correlations. For the healthy tree, a significant correlation occurred only in November of the previous year (negative correlation) (Fig. 3); for the reference trees, negative correlations occurred in February and April of the current year (Fig. 3). For the healthy tree, a negative significant correlation of δ13C with precipitation occurred only in the previous year November (Fig. 3). Similarly, for the healthy tree, only one significant correlation with precipitation was observed (previous September). For the reference trees, there was no statistically significant correlation of δ13C with precipitation. In the case of the declining tree, the dependence of the δ13C on SO2 is nonlinear and is characterised by an increasing tendency, which is especially visible for lower SO2 emission values (<5000 Mg/year) (Fig. 4A). The healthy tree and the reference trees showed similar low sensitivity to changes in the emitted SO2 (Figs. 4B,C). For all healthy trees, no significant trends were observed for the δ13C and SO2 correlation.
Fig 3.
The static correlation function relating δ13C series for A) the healthy tree, B) the declining tree, and C) the reference trees, to temperature and precipitation. The red colour indicates significant correlations (p < 0.05).
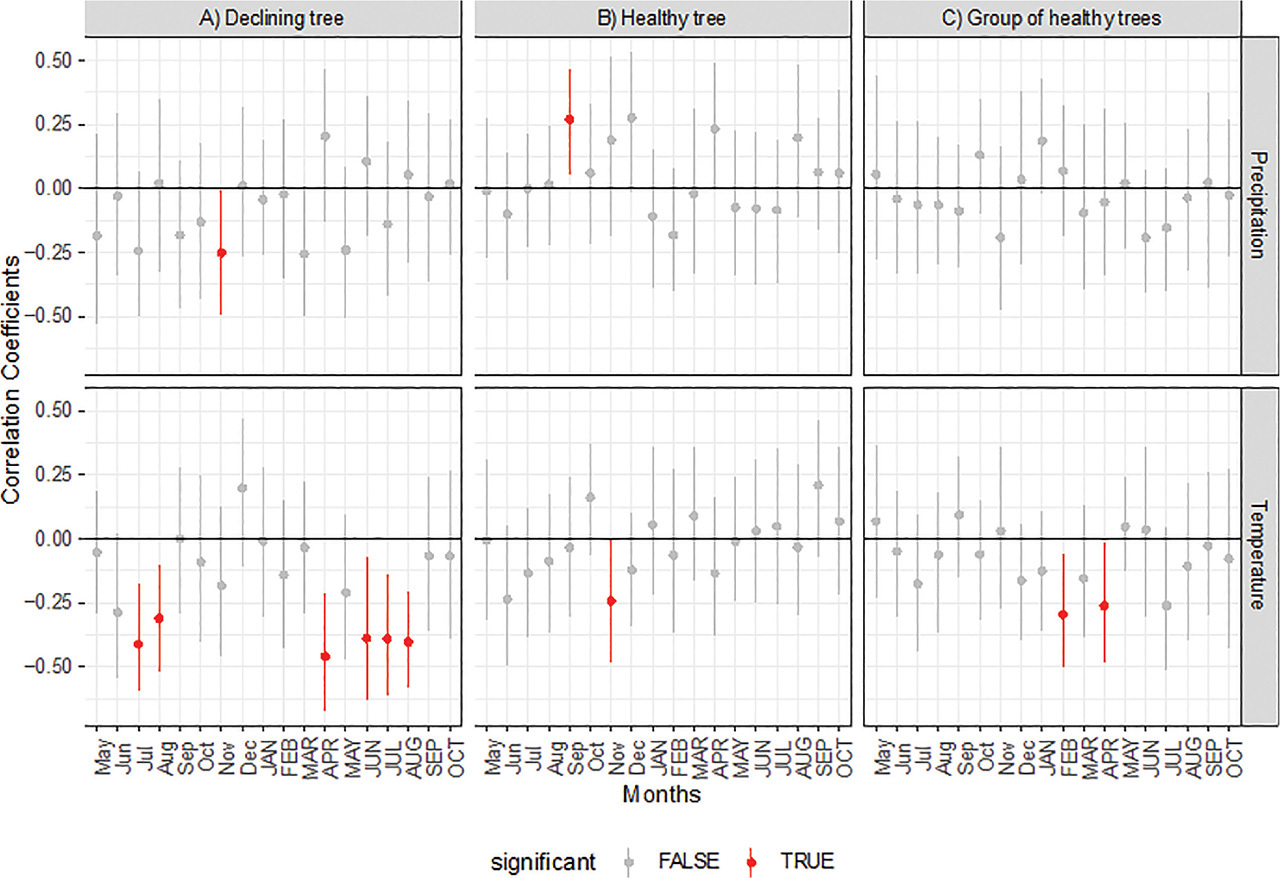
Fig 4.
Comparison of the δ13C correlation with SO2 for A) the healthy tree, B) the declining tree, and C) the reference trees.
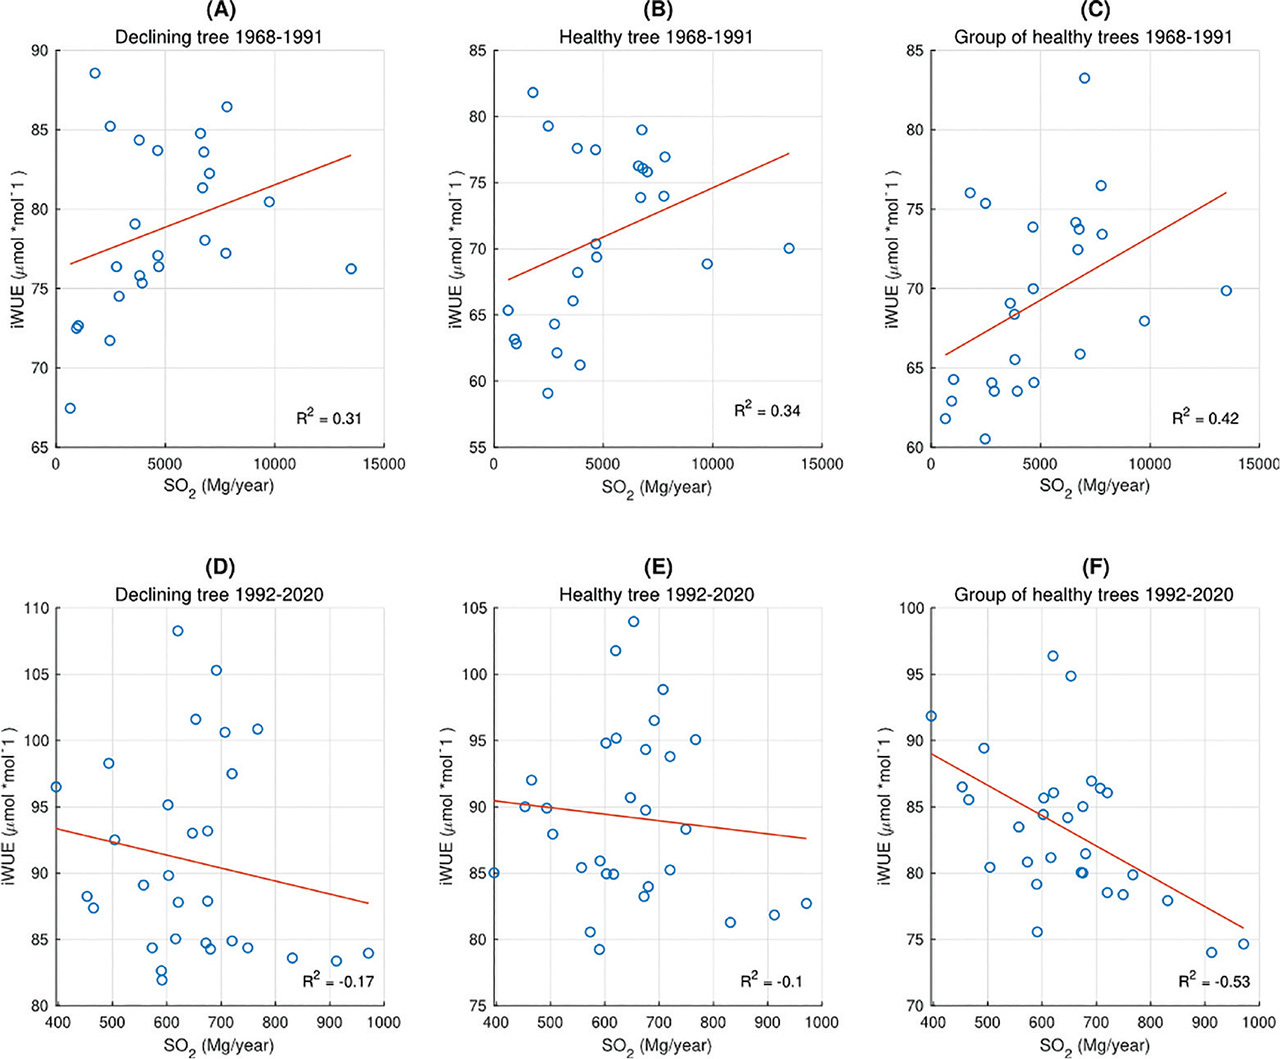
Similar to the δ13C records, in the first analysed period (1968–1992) occurred the largest difference (p < 0.05) in iWUE values for the declining and the healthy trees (Fig. 5). During this period, we did not observe a significant (p < 0.05) difference between the iWUE of a healthy tree and the reference trees, and the iWUE for all trees has a clear upward trend (mean R2 = 0.83). During this period, we also observe a clear peak in SO2 emissions (the highest values for 50 years) (Fig. 5). In subsequent years, iWUE for the reference trees is clearly lower (p < 0.05) than for the remaining trees, and the iWUE record does not have a statistically significant trend (R2 < 0.5). In the years 1992–2011, we do not observe a significant difference between the iWUE record for the declining and the healthy trees, and their trends are slightly increasing (mean R2 = 0.58) (Fig. 5). A statistically significant difference (p < 0.05) between these 2 trees appears in the last analysed period (2012–2020), when the iWUE trend for the declining tree increases significantly (R2 = 0.77); in the case of a healthy tree, the trend is also increasing, but the statistical significance is lower (R2 = 0.68) (Fig. 5). In years of higher emissions (1968–1991), in the relationship between emitted SO2 and iWUE, a slightly increasing trend is observed in the case of the declining tree (R2 = 0.31) (Fig. 6A), the healthy tree (R2 = 0.34) (Fig. 6B), and the reference trees (R2 = 0.42) (Fig. 6C). In the period of lower emissions (1992–2020) for individual trees (Figs. 6D,E), there is no trend between SO2 and iWUE. However, for the reference trees, we observe iWUE decreased with the increase of SO2 (R2 = −0.53) (Fig. 6F).
. Discussion
Our goal was to compare two trees growing next to each other and check what factors could have caused one of them to decline and be classified by foresters for cutting down. To make these studies more reliable, we introduced a control group consisting of five healthy trees for which we performed the same analyses. Our research showed that trees growing in the same area, but with different health conditions, may be characterised by very similar growth trends, but differ in carbon isotopic composition and sensitivity to weather changes and emitted pollutants. Both the healthy tree and the group of five healthy trees had lower δ13C and iWUE values than the declining tree throughout the entire period of analysis; these trees did not show significant reactions to changes in temperature and precipitation, unlike the declining tree, which showed significant negative correlations with summer temperatures. Correlations of δ13C with SO2 occurred only in the case of the declining tree. iWUE of all trees showed similarly low sensitivity to SO2 emitted at high concentrations; the difference between individual groups was observed at low SO2 concentrations, to which only healthy trees from the control group were sensitive.
In the RWI records, we observed several years in which there were visible decreases in the width of annual increments (1979, 1993, 1996, 2000, 2006). A reduction in the annual growth of P. sylvestris L. in the same years was also noticed by Malik et al. (2011), who conducted research on the impact of pollution on the growth of trees in a nearby town (about 10 km away). Malik et al. (2011) also noticed that during the period of greatest emissions from nearby zinc smelters (1960–1980), RWI values were much lower than in later years, when SO2 emissions were lower. Significantly lower RWI values up to 1985 are also visible in the case of our measurements (mean RWI for the reference trees in 1968–1985 was 0.89, in 1986–2020, 1.10).
Trees can tolerate low concentrations of pollutants, including SO2, which has been confirmed by numerous observations (Gebauer and Schulze, 1991; Bruckner et al., 1993). However, higher concentrations of SO2 can severely affect the plant. Many studies have shown that δ13C of trees growing in areas exposed to SO2 emissions have higher values (Sakata and Suzuki, 2000; Savard et al., 2005; Boettger et al., 2014), which is justified by the influence of pollutants on plant physiological processes, such as the reduction of intercellular CO2 concentration caused by the closure of stomata, to reduce isotope discrimination against δ13C (Martin and Sutherland, 1990). Trees in the Świerklaniec Forest District are constantly under the influence of pollutants emitted by the zinc smelter, but in the years of the greatest emissions (1970–90), δ13C values were higher than in the next years. This is particularly visible in the case of the declining tree, which appears to be most sensitive to the emitted SO2. Leonelli et al. (2012) compared the response of trees exposed and not exposed to pollution, to changes in temperature and precipitation. δ13C of trees growing in a clean environment shows a significant positive correlation with temperature (June to August) and a negative correlation with precipitation. However, no significant correlations with temperature and precipitation for the tree exposed to pollution was found. It was suggested that the presence of strong pollutants dominates the plant’s physiology, and under these conditions, trees do not show sensitivity to other factors (temperature, precipitation) (Leonelli et al., 2012; Boettger et al., 2014). This relationship is visible in the case of the analysed healthy tree and the reference trees, whether either did not show or showed single correlations with meteorological conditions. δ13C of the declining tree showed significant correlations with summer temperatures; however, they had the opposite sign to the correlations of trees living in a clean environment (Leonelli et al., 2012), which could have contributed to the declining process in the weaker tree.
. Conclusions
The research shows that it is possible to subject declining trees, being more difficult research material to the dendrochronological analysis, to the analysis of the isotopic composition of carbon and iWUE. The research showed differences between the healthy tree and the declining tree in the δ13C and iWUE records and in terms of their sensitivity to temperature and pollution. The healthy tree had a similar RWI, deltas, iWUE, and sensitivity to meteorological conditions as the reference trees. However, due to the small number of trees analysed, the results should be treated with caution. Recommendations for future research include testing more declining trees and expanding the study to include analysis of trees not exposed to pollutants emitted by the zinc smelter.