
. Introduction
The productivity of forests in drought-prone regions is threatened by the global warming caused by human activity (Reichstein et al., 2013). Since 1970, the area affected by drought has been expanding, with a marked increase in the frequency and duration of droughts (Burke et al., 2006; Blunden et al., 2011). In the past 50 years, several droughts have occurred in Poland; the ones that had the most negative impact on agriculture occurred in the years 1982, 1992, 1994, 2006, 2011 and 2015 (Boczoń et al., 2016). It is worth adding that the drought in 2015 was the result of an extremely warm summer, with scarce rainfall (10%–30% of the long-term norm) and low water levels recorded in rivers (e.g., the Vistula River reached its lowest level since the 18th century) (Somorowska, 2016). The climate models for northwestern Europe predict that changes in the precipitation patterns and higher mean annual temperatures (Lindner et al., 2010) lead to more intense and frequent summer droughts (Scharnweber et al., 2011). Increase in tree mortality due to droughts has been reported in various local studies across Poland (e.g. Michalski et al., 2004; Durło et al., 2015; Bokwa et al., 2021) as well as in studies on a nationwide scale (Boczoń et al., 2016). However, the drought phenomenon is complex and drought-related tree mortality remains unclear. Furthermore, more detailed research on this topic, both on a larger and local scale, is crucial to understand how trees respond to drought.
Dendrochronological measurements of annually resolved variables, such as tree ring widths (TRWs), are typically used to examine the long-term climate effects on the radial growth of conifers (Bridge, 2003). Quantitative wood anatomy, additionally, enables the encoding of information on tree functioning (such as carbon uptake and water consumption) and growth at considerably finer temporal scales (Pacheco et al., 2016). Therefore, conducting dendrochronological analyses, along with the analysis of selected features of wood anatomy, is a valuable approach for assessing the sensitivity of trees to drought. The aim of the research is to understand the impact of drought on tree species considered resistant to difficult conditions. To reach this aim, we compared the growth and anatomy of Pinus sylvestris L. trees among healthy and declining trees growing in Opole forests, affected by water shortage since many years (Meteomodel, 2023), assessing their sensitivity to climate conditions.
. Materials and Methods
. Study Area
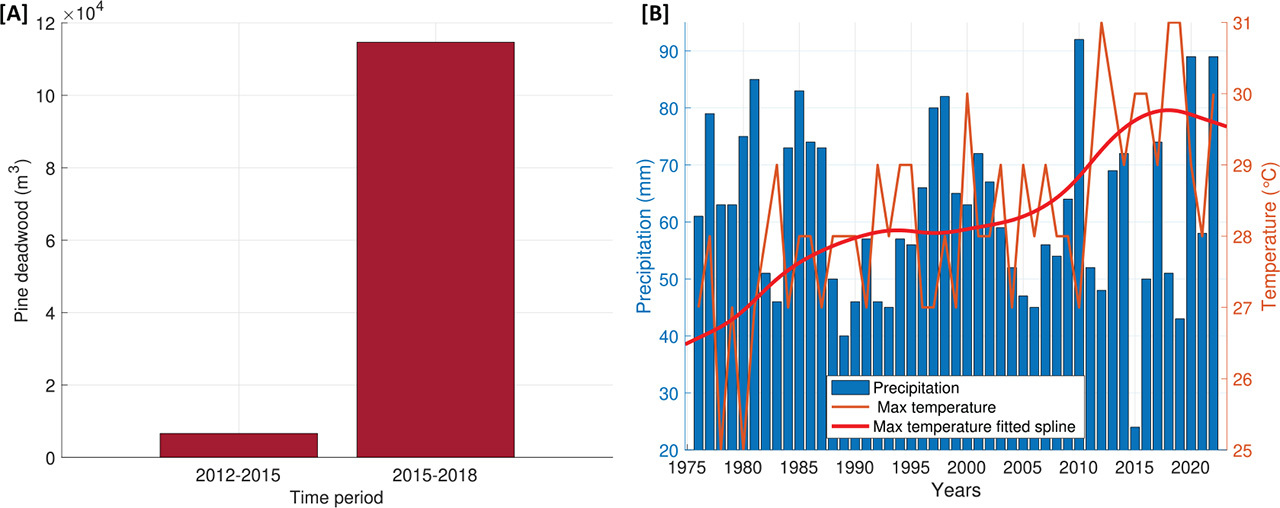
The study area is located in Opole Forest District (50°37′19.8″N 18°02′20.8″E) in southern Poland (Fig. 1). The Forest District covers an area of 22 867.87 ha, of which 86% is covered by pine trees, and the remainder has 5% oaks, 4% birch, 3% alders and 2% other species (Lasy Państwowe, 2023). Most pine trees (57.2%) found in Opole forests are between 50 years old and 100 years old (Lasy Państwowe, 2023). The sampling site is characterised by a lowland, periglacial, plain and undulating landscape, with dominant sandur sands and gravel-type soils (Lasy Państwowe, 2023). In recent years, forestry departments in Opole have been struggling with the problem of a huge number of pines (P. sylvestris L.) dying every year, due to water scarcity. This process was intensified after 2015, when extreme droughts occurred in Poland (RDLP Katowice, 2022). After the drought event, the amount of cut deadwood increased by 17 times compared with previous years (Fig. 2A) (Zespół Ochrony Lasu w Opolu, 2019). The negative impact of climate factors (high temperatures, low rainfall) translated into a reduction in the natural resistance of pines. Trees became more susceptible to bark beetles and mistletoe attacks, which accelerated the process of their decline (Zespół Ochrony Lasu w Opolu, 2019). Over the past 20 years, a gradual increase in the maximum temperatures during the growing season (by 1.3°C compared with previous years) was recorded at the nearby meteorological station (Fig. 2B). In the past 8 years there was also a drop in the sum of precipitation below the 50-year mean value (Meteomodel, 2023). According to foresters from various forest districts in southern Poland, the phenomenon of stand dieback due to drought on such a large scale is only observed in the Opole forests. This makes the selected location a suitable place to conduct research on the sensitivity of trees to drought.
Fig 1.
Map with the location of the sampling site and meteorological station. In the inset is shown the location of the sampling site in Poland.
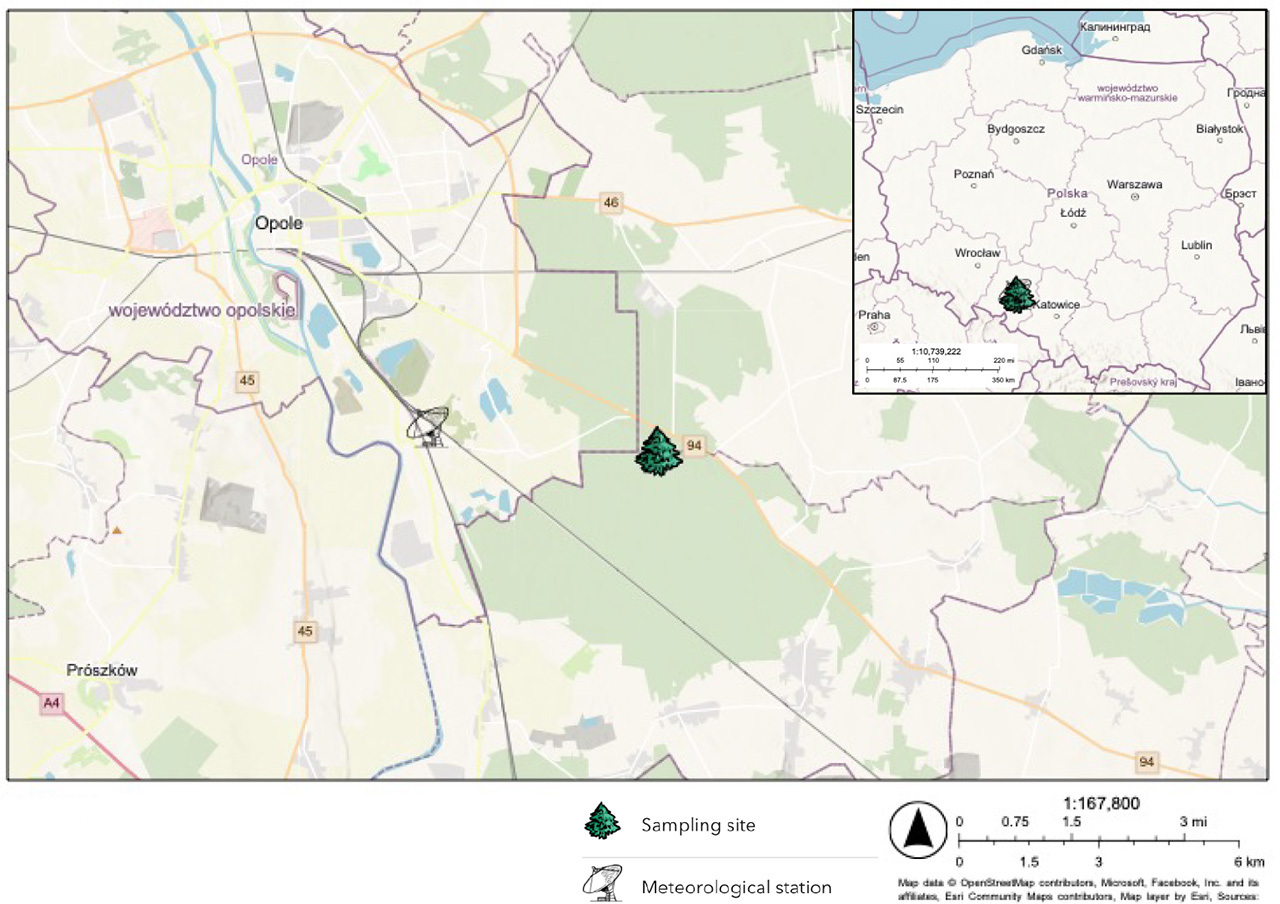
Fig 2.
(A) Amount of pine deadwood removed from the forest before and after drought in 2015; (B) Mean monthly values of precipitation and maximum monthly temperatures (with a fitted smoothing spline line) for the vegetation period (April–October) (data from the Opole meteorological station (IMGW-PIB, 2022)).
. Meteorological Data
For the ‘Opole’ meteorological station (50°37′37″N, 17°58′08″E), located closest to the sampling site, monthly data on the mean and maximum temperatures, total monthly precipitation and relative humidity were obtained for the analysed period (1976–2022). The data were obtained from the website of the Polish Institute of Meteorology and Water Management (IMGW-PIB) (2022). Data on the Standardised Precipitation–Evapotranspiration Index (SPEI), with monthly time resolution, were obtained from Beguería et al. (2023).
According to the meteorological station the highest temperatures occurred in July and the lowest in February. In August 2013, an extreme high summer maximum temperature was recorded (37.9°C), while the lowest summer maximum temperature occurred in July 1980 (25.3°C). The maximum temperature after 2009 increased by 1.6°C compared with the period before 2010. The mean temperature value also increased by 1.0°C after 2009. The highest total monthly precipitation was recorded in August 2022 (273.0 mm), while the lowest was in November 2011 (0.0 mm).
In the analysed period, three extreme droughts and one severe drought were recorded in the south of Poland (Kalbarczyk and Kalbarczyk, 2022). The occurrence of drought was determined on the basis of the seasonal standardised precipitation index (SPI-3), reflecting short- and medium-term environmental humidity (Kalbarczyk and Kalbarczyk, 2022). Extreme droughts (SPI – 3 ≤ 2.0) occurred in the summer of 2015 and in the autumn of 1982 and 2011 (Kalbarczyk and Kalbarczyk, 2022). The drought in the summer of 2015 was the longest in the history (data from the past 50 years) of Poland; in the Opole forests it lasted for over 40 days, and in the central–eastern part of the country, for over 100 days (Boczoń et al., 2016). In the autumn of 2005 also, a severe drought was recorded (SPI-3 ɛ[−1.5; − 2.0)) (Kalbarczyk and Kalbarczyk, 2022).
. Dendrochronological Analyses
In November 2022, five trees in good health condition and five declining trees with a mean age of 70 years were sampled using a 5-mm increment borer. The limited number of trees has been previously used for climate-growth information (Leonelli et al., 2014, 2017; Marini et al., 2019). All declining trees marked by foresters for felling and were characterised by a poor, not very abundant crown, sparse needles and the presence of mistletoe. Samples were collected at a height of 1.3 m from four different directions of the tree, coring parallelly to the plane of the tree. From the collected 40 cores, 20 were used for tree-ring measurements, while the remaining 20 were used for anatomical analyses. TRW measurements were carried out at the Dendroecology Laboratory of the University of Campania ‘Luigi Vanvitelli’ in Caserta, Italy. In order to ensure better visibility of the annual rings, each sample was glued to wooden stands and sanded successively with sandpaper of various grits (P60, P220, P400, P600). The samples prepared in this way were analysed using the LINTAB system: a stereo-microscope connected to a computer records the ring width measurements through the TSAP-Win software. The Gleichlaufigkeit (GLK) parameter was used to evaluate the consistency of trends between different TRW series (Eckstein and Bauch, 1969). Results were considered valid with a GLK greater than 60 (Niccoli et al., 2020). The dplR package in R-studio was used for cross-dating of tree rings: the program calculated TRW correlation coefficients between a given sample and residual samples from different trees. To validate the consistency of TRW series among trees from the same location, cross-dating quality was checked using COFECHA (Holmes, 1983). The ‘dplR’ package was also used to remove age-related and non-climate-related trends, using an age-dependent spline with a 50% frequency cutoff (Bunn, 2010), allowing to obtain the standardised chronology of the Ring Width Index (RWI) and its sensitivity. The ‘treeclim’ package in R-studio was used to test the potential correlation between weather conditions (mean and maximum temperature, relative humidity and total annual precipitation), SPEI and tree growth according to Zang and Biondi (2015). The analysed time period was 1976–2022. The dendroclimatic window was set from May of the previous year to October of the current year. The static correlations were computed with a 95% significance level (p < 0.05). The one-way ANOVA with the Student–Newman–Keuls coefficient for comparison tests (p < 0.05) was used to evaluate the difference between both groups of trees in two time periods (1976–2009 and 2010–2022) in terms of the mean value of RWI.
. Quantitative Wood Anatomy Analyses
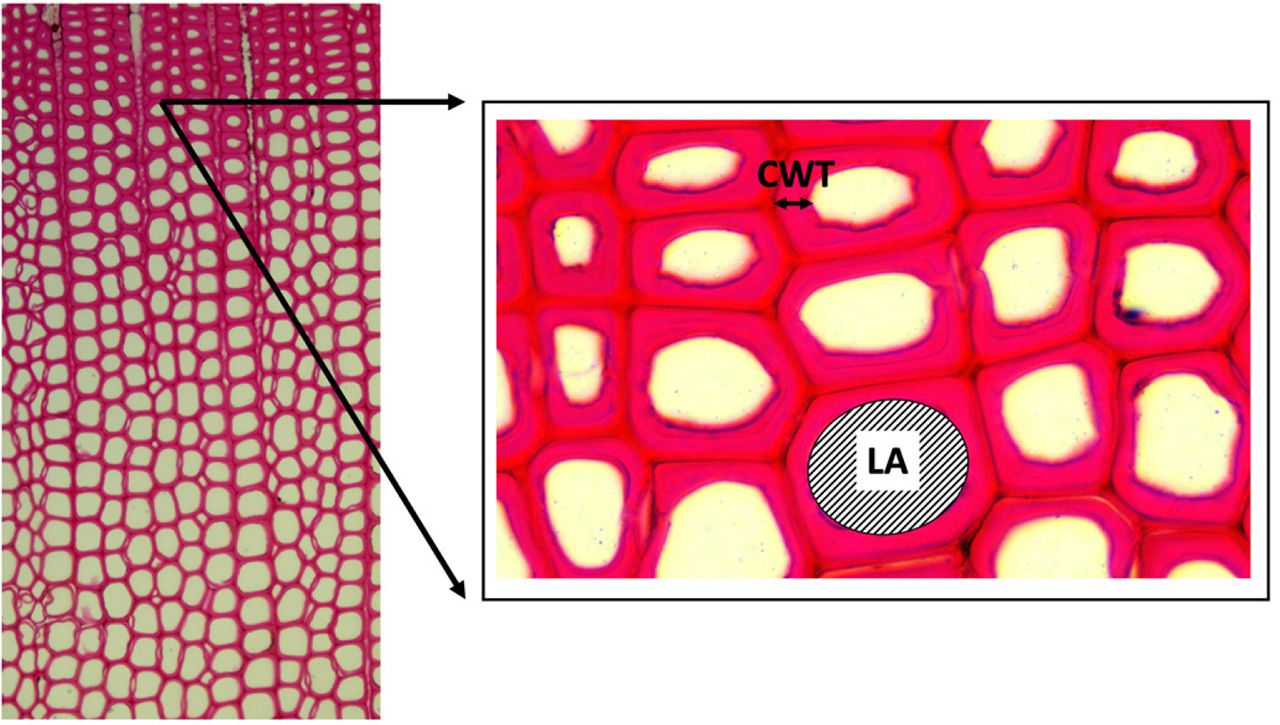
Additionally, at the Dendroecology Laboratory of the University of Campania ‘Luigi Vanvitelli’, we performed anatomical analyses for both groups of trees (healthy and declining trees). Small pieces of wood were cut along the transversal plane into 12-μm slices with a rotary micro-tome. After chemical preparation of the samples, we used a digital camera mounted on a light microscope (Optika B-510 FL) to obtain histological images of each annual ring separately. For measurement of the histological features, such as cell wall thickness (CWT) and lumen area (LA) (Fig. 3) the ROXAS v3 software (von Arx and Carrer, 2014) was used. The LA values were multiplied by the cell density and mean ring width in order to estimate the total amount of conductive area in each year. The same procedure was applied to CWT, to have an estimate of the quantity of the area occupied by cell walls.
. Results
. Growth Patterns
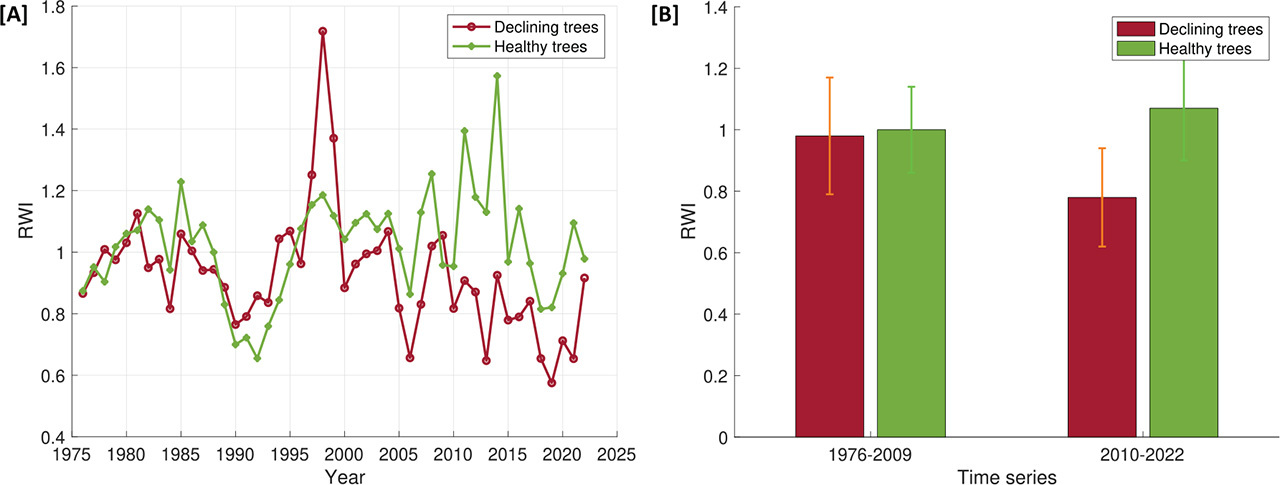
The main dendrochronological parameters are presented in Table 1. Conducting measurements of declining trees was straitened by the presence of very narrow and densely spaced increments, especially in the past 20 years of tree growth. Additionally, in the case of healthy trees, numerous false rings were observed (occurring mainly after 2000), which were not present in declining trees. The chronologies of RWIs of the two groups of trees until 2009 were characterised by a similar trend (Fig. 4A). There was no statistically significant difference between their mean values (p = 0.59) (Fig. 4B). Both chronologies were characterised by a downward trend in the years 1985–1990. From 1981 to 1998, the RWI values of both groups of trees noticeably increased (Fig. 4A). Since 2000, although the growth patterns were similar between the two groups, the chronology of declining trees was characterised by a progressive decrease in productivity (Fig. 4A). Indeed, we found that for the years 2010–2022 the mean RWI values for declining trees were significantly lower than for healthy trees (p < 0.0005) (Fig. 4B).
. Tree-Growth Response to Meteorological Conditions
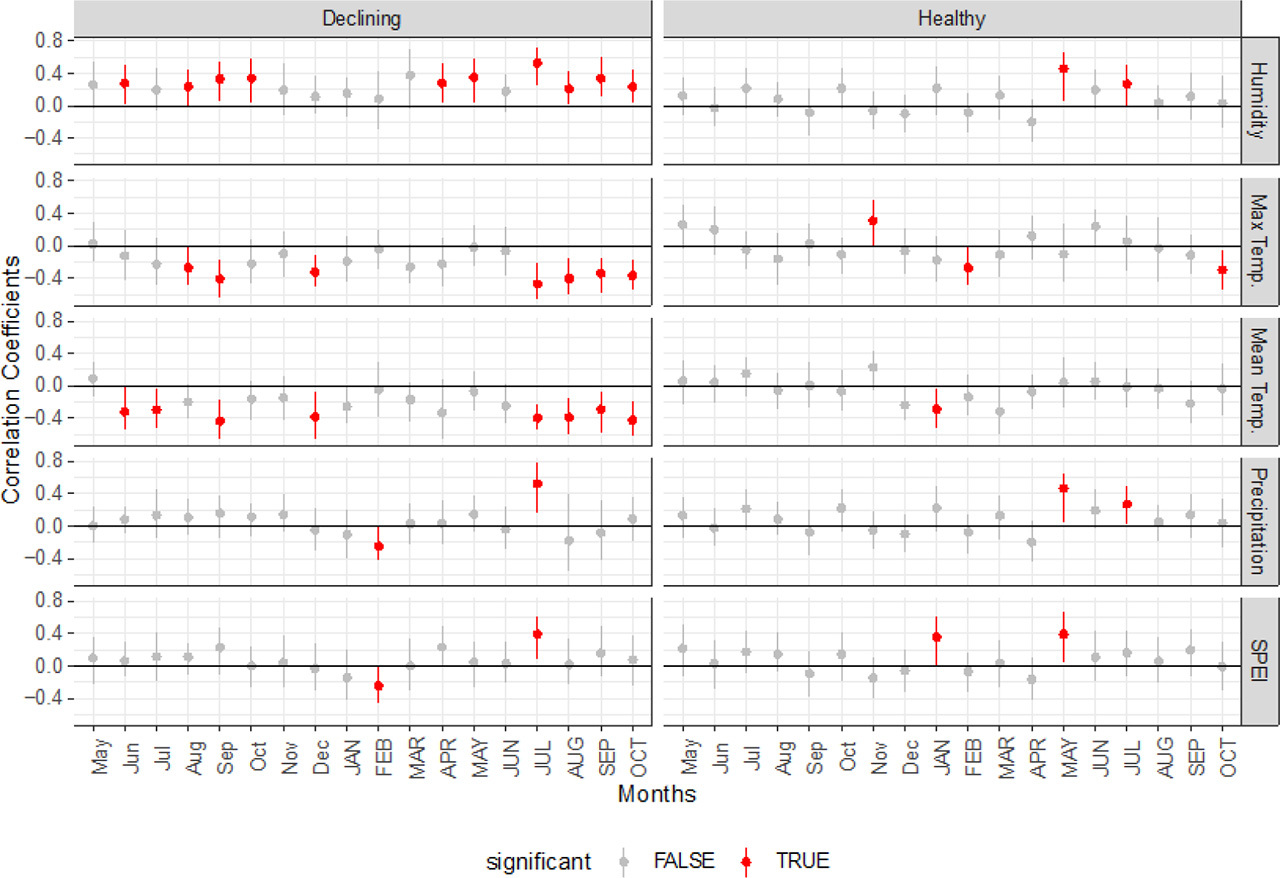
The majority of statistically significant correlations (p < 0.05) between tree growth and meteorological conditions were observed for mean and maximum temperature and humidity (Fig. 5). For temperatures, all significant correlations were negative and occurred in 8 (mean temperatures) and 7 (maximum temperatures) out of the 18 analysed months (Fig. 5). Most of them were observed in the summer and early autumn months, while one significant correlation occurred in previous December. In the case of healthy trees, statistically significant (p < 0.05) correlations occurred only in 1 month (for mean temperatures) and 3 months (for maximum temperatures) in the autumn and winter months (Fig. 5). Declining trees also showed 10 statistically significant (p < 0.05) correlations with relative humidity (Fig. 5). All observed correlations were positive and six of them occurred in the summer months, while the rest were observed in the spring and autumn months. Two statistically significant correlations with humidity were found for healthy trees (Fig. 5), which occurred in the current year of May and July. For both precipitation and SPEI, the number of observed statistically significant (p < 0.05) correlations were much lower than those observed for the other meteorological parameters. Two statistically significant correlations were observed between RWI and the total annual precipitation for both declining and healthy trees. For declining trees, a negative correlation was found with precipitation in February and a positive correlation with July of the current year. The same correlations were observed for declining trees in the case of SPEI. For healthy trees, two positive correlations with precipitation were observed for the current year of May and July. Positive correlations of RWI and SPEI (Fig. 5) were observed for the current year of January and May.
Fig 5.
Static correlation coefficients for the relationship between relative humidity, maximum temperature, mean temperature, mean monthly precipitation, SPEI and RWI chronologies for declining and healthy trees. Months in lowercase refer to the previous year, while months in uppercase refer to the current year. The point represents the mean correlation, while the error bar represents the 95% confidence interval of the correlation based on 1000 bootstrap samples (Zang and Biondi, 2015). RWI, Ring Width Index; SPEI, Standardised Precipitation–Evapotranspiration Index.
In tree-ring chronologies, significant decreases in RWI values were observed in several periods. Three periods of RWI reduction common for both groups of trees were identified around the years 1976, 1990 and 2006 (Fig. 4A). Low values of annual tree-ring width in the years 1990 and 2006 can be associated with the occurrence of very low total annual precipitation, as well as with noticeable peaks in the maximum temperature (Fig. 2B). We also noted 1 year with a significant increase in RWI, which occurred in 1998 (Fig. 4A) in both groups of trees; however, in the case of declining trees, the increase in value was greater. The high RWI values resulted to be correlated with the highest precipitation sum in the analysed period and with a sharp decrease in the value of the maximum temperatures (Fig. 2B). The fact that in the case of declining trees the recorded maximum RWI value was higher than for healthy trees may be related to the fact that declining trees showed greater sensitivity to changes in temperatures compared with healthy trees (Fig. 5).
. Quantitative Wood Anatomy
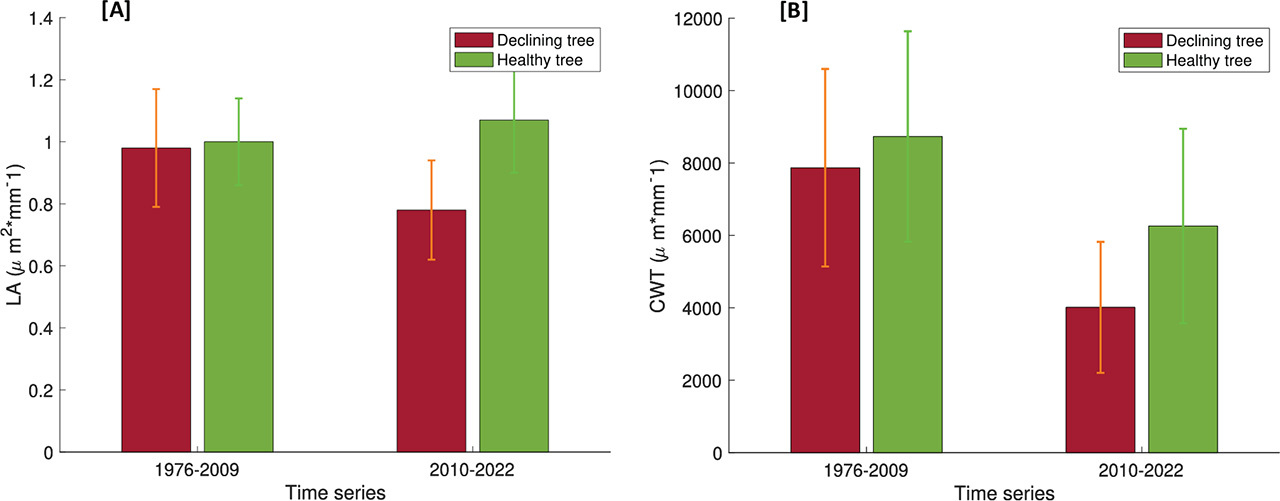
We prepared a detailed description of the quantitative wood anatomy (CWT, LA), for both declining and healthy trees from the 1976–2022 analysis period (Fig. 3). The mean LA of the cells of a healthy tree was about 1.5 times larger than that of the cells of a declining tree (healthy tree: 9.2 × 105 μm2 · mm–1, declining tree: 6.3 × 105 μm2 · mm–1). In both groups of trees, the mean LA decreased (p < 0.05) significantly (p < 0.05) after 2009 (30% in the case of a healthy tree and 47% for a declining tree). Also, in the case of CWT, the mean value for a healthy tree was 1.2 times higher than for a declining tree (healthy tree: 6.8 × 103 μm · mm–1, declining tree: 8.0 × 103 μm · mm–1). After 2009, the mean values for both trees decreased significantly (28% in the case of the healthy tree and 50% for the declining tree) (Fig. 6B). We observed a statistically significant difference between both groups of trees in the mean values of CWT for the period after 2009 (p < 0.05). In the previous period the values of this parameter were similar for both trees (p > 0.05).
. Discussion and Conclusions
The Opole region is characterised by high tree mortality due to drought, but so far, no dendrochronological studies or analyses of the wood anatomy that would cover also declining trees, have been carried out there. Our research confirms that P. sylvestris L. is a species that copes well with unfavourable meteorological conditions. The warming climate and increasingly frequent droughts did not limit the growth of healthy individuals. Over the analysed 47 years, no significant changes were observed in the anatomical features of healthy trees. However, our research also showed that even among species considered to be drought-resistant, there are weaker trees that react to unfavourable conditions in a completely different way than healthy trees. After 2009, the maximum and mean monthly temperatures recorded at the ‘Opole’ meteorological station were higher by 1.6°C and 1.0°C, respectively. August 2015 also saw record-low precipitation (8.1 mm), contributing to a severe drought in that year. We have shown that the changes noticed by Opole foresters in 2015, in dendrochronological and wood anatomy analyses were visible about 5 years earlier (significant reduction of RWI, LA, CWT in 2010–2022). We also demonstrated that declining trees are highly sensitive to changes in temperature and humidity, while healthy trees are resistant to changes in these parameters.
Since the average age of the stands of both groups differs by 7 years, and most of the trees belong to the same stand age class (IV) (Lasy Państwowe, 2023), the hypothesis that one group was more or less resistant to drought due to age can be excluded. None of the trees was subjected to additional external factors that could cause growth disturbances, as forest-fire, thinning or point source of pollution.
Research on pines in the vicinity of Opole was also carried out by Opała (2012), who created a local chronology of the RWI from living and historical wood samples for the period 1568–2010. The author noticed a decrease in the width of annual rings in 2 out of 3 years indicated by us (1976 and 2006). The author linked the occurrence of low RWI values with very low total precipitation in the mentioned years, in accordance with our results. In 1976, Upper Silesia experienced a drought in spring and June, while in 2006 all of Poland was affected by a catastrophic drought in June and July (Opała, 2012). Although the author did not record periods with particularly high RWI values in the time period analysed by us (1976–2022), she associated the earlier high values (e.g. 1966) with higher-than-mean annual precipitation (Opała, 2012). In our study case the greatest differences in the width of annual increments of both groups of trees were noticed after 2009; unfortunately, the RWI chronologies for this region found in the literature end in 2010 (Opała, 2012, 2015).
There are several studies on pines growing in Poland, which show that the temperature and water availability during the growing season determine the TRWs (Wilczyński and Skrzyszewski, 2002, 2003; Shestakova et al., 2019). Wilczyński and Skrzyszewski (2003) showed that trees growing close to each other are sensitive to similar climate elements. In our research, we observed something different: some of the analysed climate parameters, such as mean and maximum temperature and relative humidity, had a much greater impact on the growth of declining trees (Fig. 5). Climate correlations suggested that the high temperatures in the summer months caused a reduction in the width of annual rings in the declining trees, while healthy trees turned out to be resistant to this factor. Conversely, positive correlations between the ring width of declining trees and moisture suggest that these trees require higher moisture levels to remain healthy. This is evident in the summer months when trees need more water due to increased rates of evapotranspiration. The positive correlations found in the warmer months, in both healthy and declining trees, between growth, precipitation and SPEI, confirm that water availability is a crucial factor in this period. However, the less significant correlations with humidity for healthy trees suggest that they are more tolerant to changes in humidity.
Numerous studies have shown that trees growing in water-scarce areas have smaller LA (Bryukhanova and Fonti, 2013; Pellizzari et al., 2016; Pacheco et al., 2018) and thinner CWT (Pellizzari et al., 2016). However, several other studies have shown the opposite (Eilmann et al., 2011; Dario et al., 2013). These apparently contrasting results demonstrate that the response of trees to drought is complex, and the obtained findings should be treated with caution, considering other complementary data. Declining tree showed a decrease in LA and CWT after 2009 (when droughts were more frequent and severe). A decrease in CWT was also observed for healthy trees, but it was not statistically significant (p > 0.05). The decrease of LA (and so potential hydraulic conductivity, which is strongly dependent on the vessel size) in the case of the declining group highlights the role of the hydraulic conditions of the trees in the decline phenomenon (Fig. 4A). Differences in the anatomical structure of healthy and declining trees (affected by drought) are also reported by other studies (Pacheco et al., 2016, 2018; Pellizzari et al., 2016; Puchi et al., 2021; Niccoli et al., 2023). Pellizzari (2016), similarly to us, observed a decrease in LA in declining trees compared with healthy trees. The author justified this difference with genetic predisposition factors, as the changes were observed several decades before the droughts that caused extinction and mortality. This hypothesis is in accordance with our results, since a decrease in the LA of a declining tree was observed at least 5 years before the severe drought in 2015 (Fig. 6). Further confirmation is found in the fact that we observed similar changes in the case of CWT.
Our research shows that dendrochronology and quantitative wood anatomy analysis are useful tools for identifying differences in the structure and sensitivity of healthy and declining trees. All observed changes (in RWI, LA, CWT) occurred in trees several years before they were exposed to the stress factor (serious drought in 2015). This leads to the hypothesis that declining trees were genetically predisposed to greater susceptibility to vulnerability in case of unfavourable conditions. Conducting similar analyses on healthy trees could allow to identify early warning signals of weaker trees and take preventive silvicultural measures to reduce mortality in forests (Bunn, 2010).