
. Introduction
River terraces are ancient river beds that have been preserved on the valley slope (Zhu et al., 2022). The formation and geometry of terraces are known to be influenced by tectonic activity, climate change and erosion base level (Starkel, 2003). However, the process of terrace formation in inland areas is controlled mainly by tectonic uplift and climate change, as the influence of base-level variation on a river system is limited to the part of the river close to the estuary (Zeuner, 1935; Wang et al., 2021). In areas influenced by strong tectonic uplift, such as the Qinling Mountains of central China, river terraces are formed as a result of the combined action of tectonic uplift and climate change (Starkel, 2003; Tao et al., 2018; Luo et al., 2019). Both of the amplitudes of tectonic uplift and climate change deeply control the depth of river undercutting, whereas climatic characteristics mainly control the sedimentary process of terrace formation. River terraces in the Qinling Mountains are important geomorphological records of climatic and environmental change (Xue et al., 2004; Pang et al., 2014).
The Qinling Mountains, which extend across central China, represent a physical boundary between northern and southern China (Xue et al., 2004). During the late Cenozoic, the Qinling Mountains have been rapidly uplifted and eroded into an impressive landscape (Meng, 2017; Zhang et al., 2019), and their formation has played a crucial role in shaping the physiography, climate, biological features and human activity of central China (Meng, 2017; Zhang, 2019). The Qinling Mountains are a transition zone between the temperate and subtropical climate zones and are highly sensitive to climate change. The Han River, which originates from Panzhong Mountain on the southern flank of the Qinling Mountains, is the largest tributary of the Yangtze River. Multiple river terraces are developed on both sides of the upper and middle sections of the Han River. These stepped river terraces preserve ancient fluvial sediments and form an important geomorphological record of the staged uplift of the Qinling Mountains and climatic change (Pang et al., 2015; Mao et al., 2017).
Previous geochronological research on the Han River has focused mainly on the lower-most and second-lowest terraces (T1 and T2; Huang et al., 1995; Huang et al., 1996; Chen et al., 1997; Sun et al., 2012, 2014; Pang et al., 2013, 2017; Bahain et al., 2017; Mao et al., 2017; Zhu et al., 2022). However, owing to limitations in dating methods and suitable geological materials, a systematic chronological framework and stratigraphic sequence for terraces higher than T1 and T2 have not been established, resulting in uncertainty regarding the chronostratigraphy of the terrace sequence. The lack of dating results has hindered the understanding of regional tectonic activity, climate change and long-term environmental change in the upper Han River area.
The electron spin resonance (ESR) dating method has been successfully applied to dating Quaternary fluvial and lacustrine sediments (Beerten et al., 2006; Rink et al., 2007; Voinchet et al., 2007; Tissoux et al., 2008, 2010; Voinchet et al., 2010; Wei et al., 2020, 2023). After detailed field investigations, three representative higher terrace profiles were selected from Wufeng County, Qingqu County and the Yunyang Basin in the upper section of the Han River for ESR dating to determine the chronology of terrace stepping and infer the controls on their formation.
. Study Area and Sampling
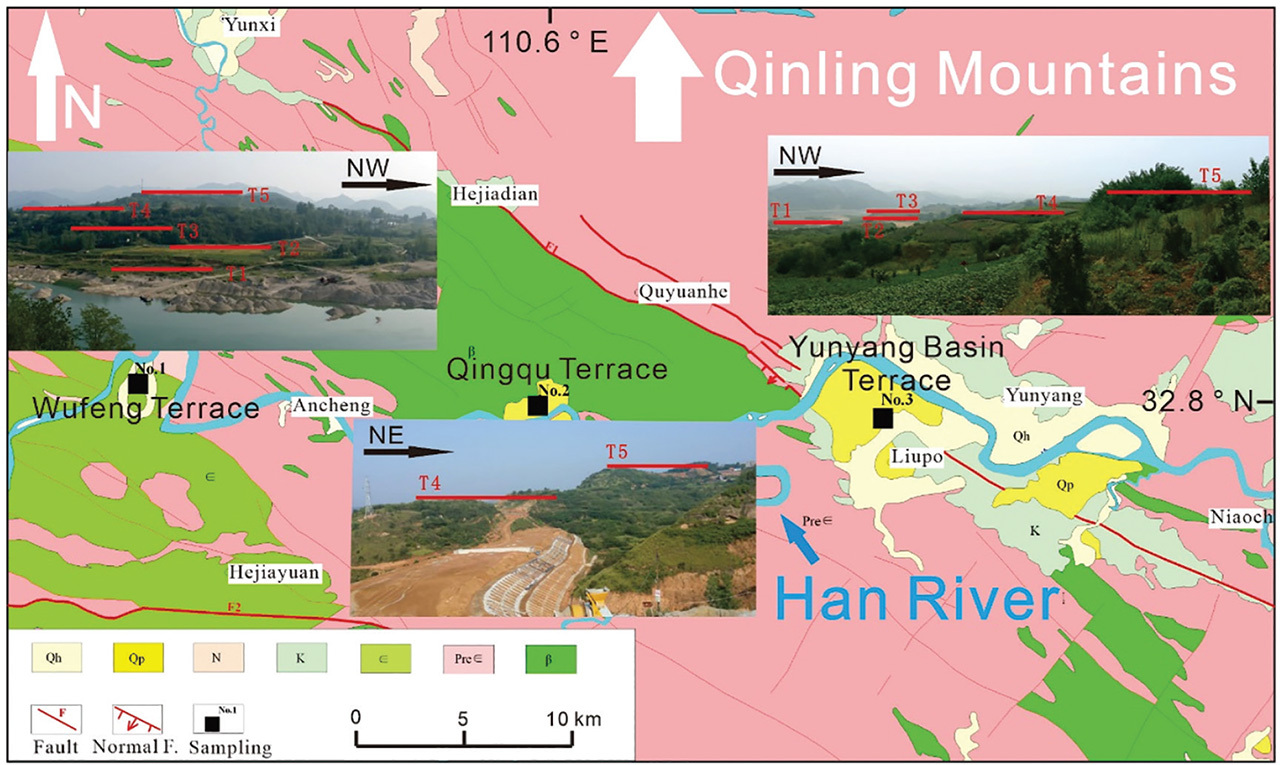
The upper sections of the Han River are located in the southern Qinling Mountains in the northern subtropical monsoon climate zone and receive a mean annual precipitation of 870 mm (Pang et al., 2015). This section of the Han River is ~925 km long and has a catchment area of 9.5 × 10⁴ km2. Gorges and basins are distributed alternately in this area. There are five levels of river terraces, T1–T5, in basins in the upper section of the Han River, which are at +10+15 m (T1), +30+40 m (T2), +60+70 m (T3), +90+110 m (T4) and >+130 m (T5) above the current river bed, respectively (Zhu et al., 1955). The lower terraces (T1 and T2) are widely distributed and well preserved, whereas the higher (T3–T5) terraces are cut, damaged and eroded to various extents and do not contain completely preserved accumulated fluvial–lacustrine sediments. This study focuses on terrace systems in Wufeng County (32°50′51.77″N, 110°22′16.97″E), Qingqu County (32°49′55.64″N, 110°34′43.63″E) and the Yunyang Basin (32°49′57.31″N, 110°44′53.98″E) in the upper section of the Han River (Fig. 1). The Wufeng and Qingqu terrace profiles are located on the left bank of the Han River, whereas the Yunyang Basin terrace profile is located on the right bank. Five terrace levels can be identified in each of these profiles (Fig. 1).
Of the five terrace levels, terraces T1 and T2 are accumulation terraces, whereas terraces T3–T5 are bedrock terraces partly covered by fluvial–lacustrine sediment. Detailed information about the three sampled terrace profiles is presented in Fig. 2 and Table 1.
Fig 2.
Sketch map showing the sampling profile stratigraphy and field photographs of the Wufeng, Qingqu and Yunyang terrace systems of the upper Han River, China.
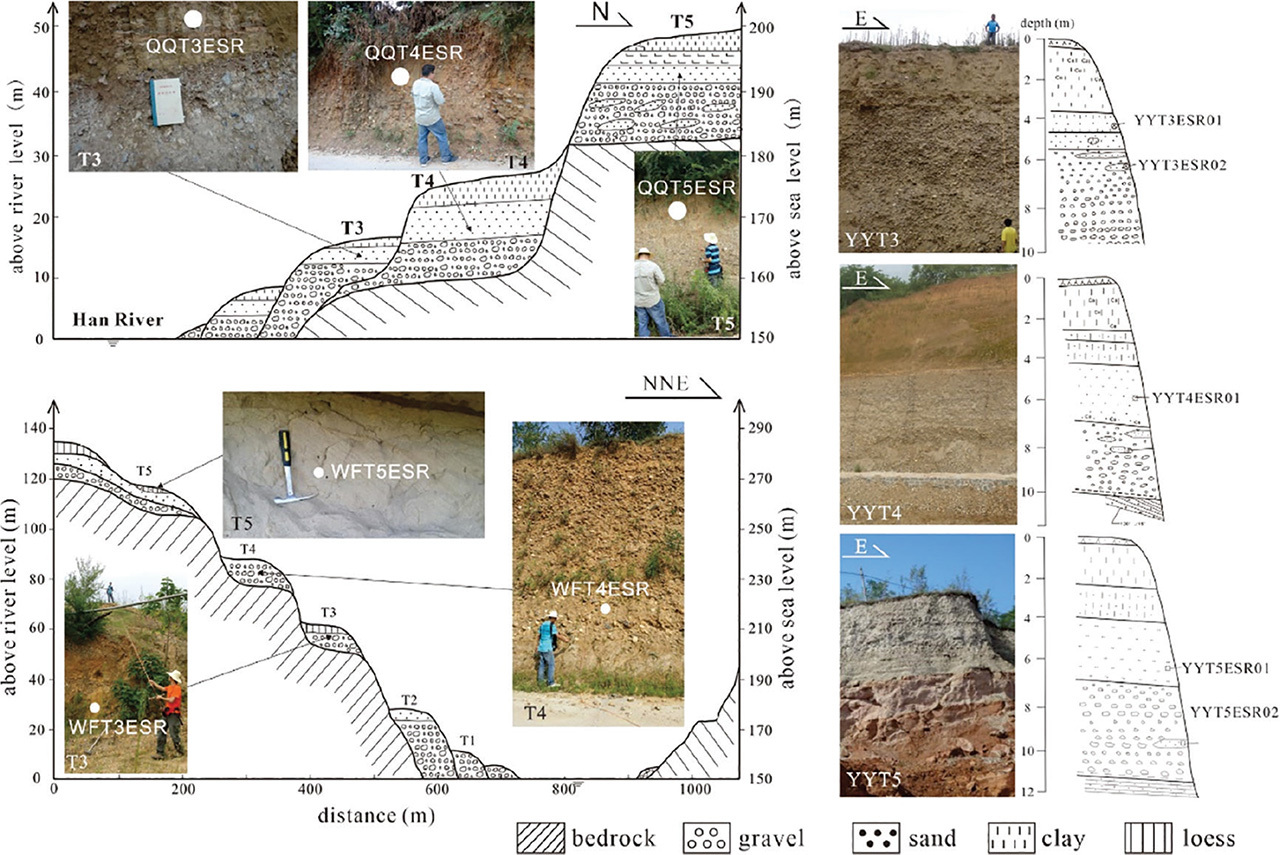
Table 1.
Results of ESR dating for the Wufeng, Qingqu, and Yunyang Basin terraces in the upper Han River valley.
In this study, a total of 11 samples were collected. One sample was collected from each of T3, T4 and T5 in the Wufeng and Qingqu terrace profiles, and one sample from T4 and two from each of T3 and T5 in the Yunyang Basin terrace profile. The two samples from terraces T3 and T5 of the Yunyang Basin were collected to check the reliability and repeatability of our dating results.
. Methods
. Quartz Extraction
The quartz purification experiment was conducted at the Institute of Geology, China Earthquake Administration in Beijing, China, following the procedures described by Liu et al. (2010) and Wei et al. (2020). All the samples were separated into the 75–145 μm size fractions using wet sieving. The 75–145 μm size fraction has been identified as the most susceptible to optical bleaching during transportation (Voinchet et al., 2015). Each sample was treated with 30% H2O2 for 24 h and with 40% HCl for 24 h to remove organic material and carbonates, respectively. After washing and cleaning with distilled water, the samples were subjected to heavy liquid separation (2.7 g/cm3) to remove heavy minerals, and mechanical magnetic selection to remove magnetic minerals. In order to remove feldspars and etch quartz grains, the remaining part of the sample was then treated with 40% HF for 40 min. The samples were then placed again into 40% HCl for >4 h to subtract fluorides produced by the former HF treatment. Subsequently, the samples were washed with distilled water to neutralise the acid and dried at low temperature (~43°C) for over 24 h. X-ray diffraction analytical results revealed that the purified quartz from 11 samples had high purity ranging from 97.19% to 99.99%.
. Gamma-Ray Radiation Dose
Quartz grains were dated by the ESR method using the multiple-aliquot additive dose method of Ti-related centres (Toyoda et al., 2000; Duval and Guilarte, 2015). Irradiation was performed using the 60Co source of the laboratory of Peking University, Beijing, China, with a dose rate of 42.25 Gy/min. Each sample was divided into 10 aliquots for irradiation at the expected doses of 0 Gy, 237.65 Gy, 433.1 Gy, 863.7 Gy, 1677.5 Gy, 2662.5 Gy, 3798 Gy, 4887 Gy, 6512.5 Gy and 8811.5 Gy, calibrated using reference standard alanine dose tablets.
. ESR Measurements
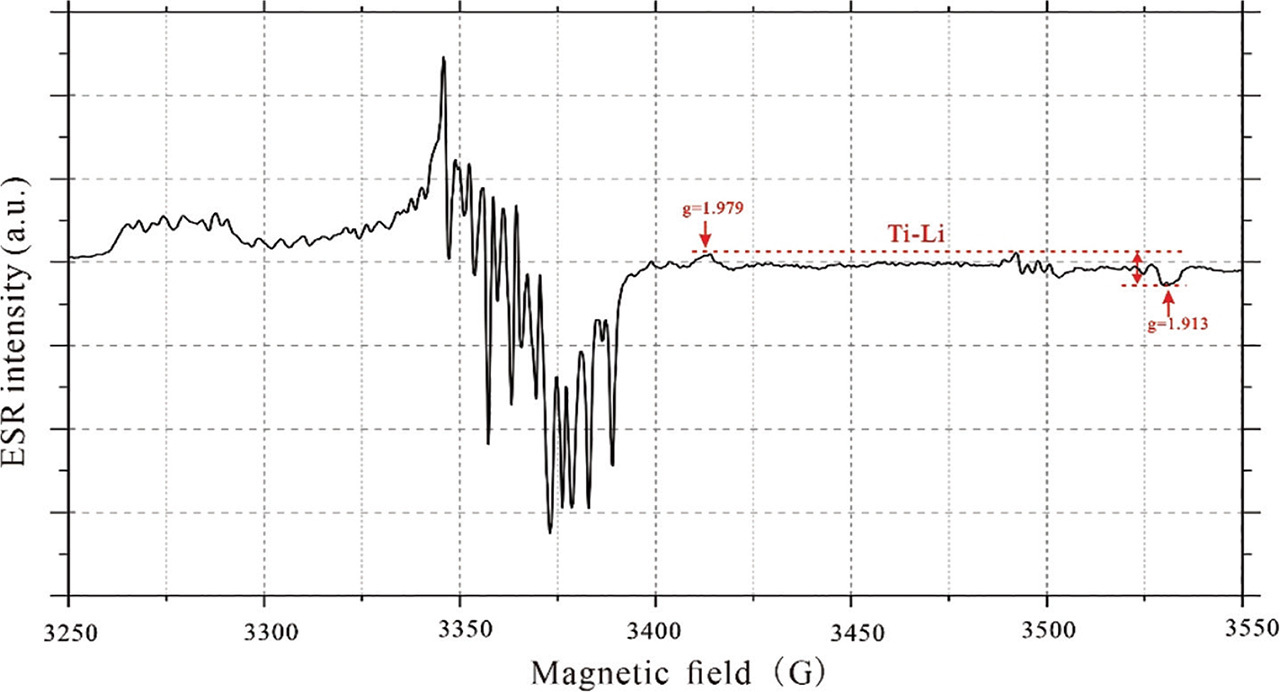
The ESR measurements were conducted using a BRUKER EPR041XG X-band spectrometer cooled to 77 K with liquid nitrogen in a finger-dewar at the State Key Laboratory of Earthquake Dynamics, Institute of Geology, China Earthquake Administration, Beijing, China. ESR measurements of the Ti–Li centre were performed with a microwave power of 5 mW and modulation amplitude of 0.16 mT. For the Ti–Li centre, ESR signal intensity was measured from the top of the peak at g = 1.979 to the bottom at g = 1.913 (Fig. 3; Rink et al., 2007; Tissoux et al., 2007; Liu et al., 2010; Duval and Guilarte, 2015). Given the anisotropy of the ESR signal intensity, each aliquot was measured at six angles (~60° interval) in the cavity, with the mean value being calculated to reduce the variation caused by the anisotropy of quartz.
. Equivalent-Dose Determination
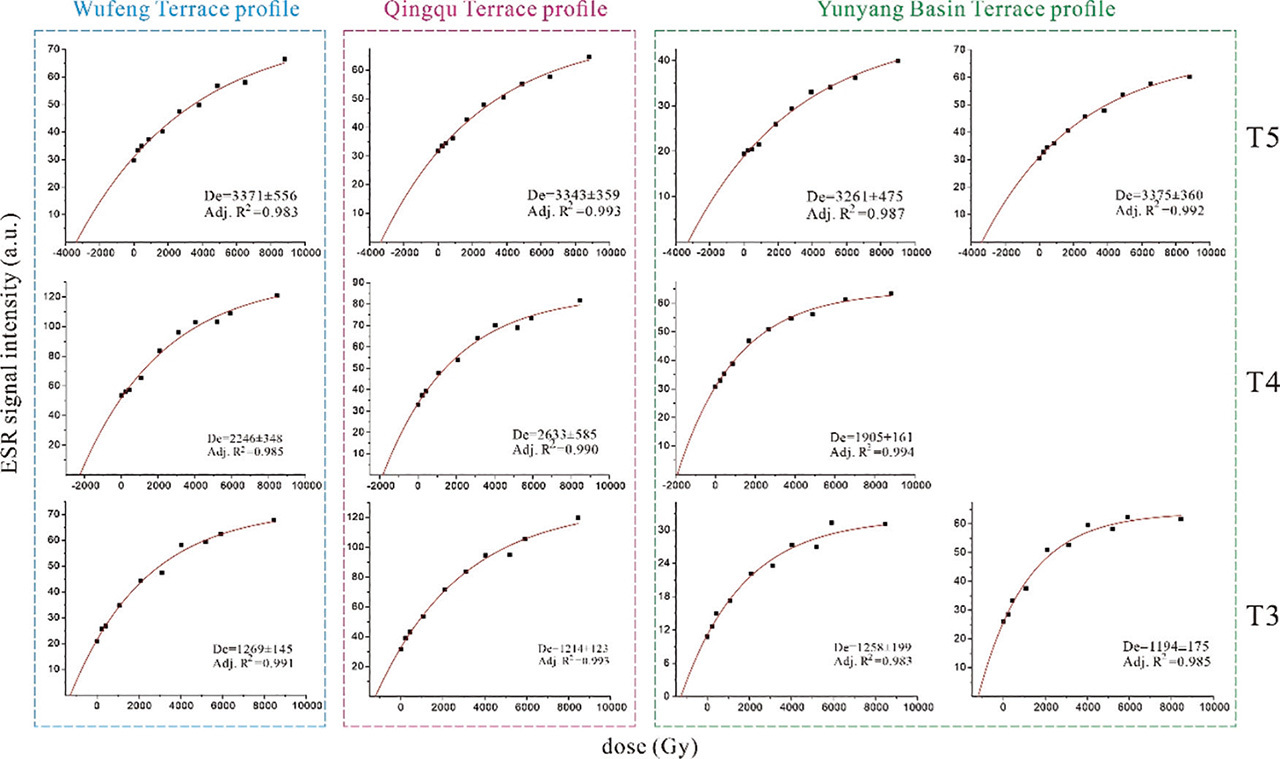
In the present work, SSE functions were applied to the Ti–Li centre data to determine the equivalent dose (Woda and Wanger, 2007; Duval and Guilarte, 2015; Wei et al., 2020). The goodness of fit of these functions was assessed using the error coefficient and adjusted R-square. Equations of the fitting functions and all DRCs of all samples are shown in Fig. 4.
. Dose Rate Calculation
Contents of uranium (U) and thorium (Th) were measured using inductively coupled plasma–mass spectrometry, and potassium (K) was measured using inductively coupled plasma–optical emission spectrometry at Chang’an University, Xi’an, China. Water content was measured by weighing the samples, which were taken from the same location as the dated samples, before and after drying. The cosmic ray dose rate was estimated for each sample as a function of depth, altitude and geomagnetic latitude according to Prescott and Hutton (1994). Total dose rates were calculated using the conversion factors of Guérin et al. (2011), and the results are provided in Table 1.
. Results and Discussions
. Distribution of Terraces
Field investigation and digital elevation model terrain analyses show that five terrace levels are widely distributed in the Han River study area (Fig. 1). The elevations of the sampled terraces in each of the three studied profiles are given in Table 1. The higher terraces T3–T5 can be recognised as flat landforms distributed continuously over long distances. Each terrace is composed of coarse-gravel layers and fine-sand lenses, which are partly covered by loess layers (Fig. 2). Those fluvial–lacustrine deposition characteristics are similar to the terrace sedimentary of the upper Jinsha River (Wei et al., 2023). The fine loess is not suitable for extracting quartz for ESR dating; therefore, sand from lenses in the fluvial–lacustrine sediments was collected for ESR dating.
. ESR Dating Results
Wei et al. (2020) showed that the Ti–Li centre ESR signal intensity of present-day Yangtze River fluvial sediments was zeroed by sunlight before burial. The sediment of the Han River, which is a major tributary of the Yangtze River, undergoes sediment transportation mainly by saltation (Sun et al., 2020), which favours zeroing of the ESR signal. Therefore, we consider that the quartz ESR signal of the Han River terrace samples was zeroed. In addition, Fig. 4 shows that the quartz ESR signal intensity increases markedly with increasing γ-ray dose. All of these data indicate that our ESR ages are reliable (Table 1). The ESR ages and uncertainties for T3, T4 and T5 of the Wufeng terrace profile are 417 ± 48 ka, 627 ± 97 ka and 1105 ± 182 ka, respectively; those for T3, T4 and T5 of the Qingqu terrace profile are 405 ± 41 ka, 622 ± 77 ka and 1129 ± 121 ka, respectively; and those for T3, T4 and T5 of the Yunyang Basin terrace profile are 422 ± 67 ka to 401 ± 59 ka, 621 ± 52 ka and 1102 ± 60 ka to 1099 ± 117 ka, respectively.
. Formation Ages of Terraces T3–T5 of the Upper Han River
We compared our ESR ages with previously determined OSL dating results for T1–T2 and paleo-magnetic dating results for the higher-level terraces. Pang et al. (2015) determined an age of 55–25 ka for T1, and Zhu et al. (2022) estimated an age of 220–180 ka for T2. Van Buren et al. (2020) determined an age of 693–625 ka for T3. Results of stratigraphic correlation have given age estimates for T4, T5 and T6 of 1.05–0.78 Ma, ~1.5 Ma and 1.82 Ma, respectively (Sun et al., 2017a,b; Zhu et al., 2023).
The results of our field investigation (see Fig. 2) show that the fluvial–lacustrine sediments at the same altitude of various terraces directly overlie bedrock; therefore, the samples collected are of ancient terrace deposits. In summary, our dating results show that the ESR central ages of terrace quartz sediments for each of T3, T4 and T5 in the three studied terrace profiles are highly consistent, in the ranges of 422–401 ka for T3, 627–621 ka for T4 and 1129–1099 ka for T5.
. Mechanism of Formation of Higher Terraces of the Upper Han River
The evolution of fluvial systems is highly sensitive to climate change, including the formation and preservation of terraces (Vandenberghe, 2003; Winsemann et al., 2015). In Fig. 5, we compare the formation ages of the upper Han River terraces with the deep-ocean oxygen isotope curve, which is a proxy for paleo-climatic conditions. This figure shows that it is only T3 and T4, but it is likely for all the dated terraces of the upper Han River to have formed during the transition from a glacial to interglacial period. This correspondence is consistent with rivers originating from mountain systems in temperate regions (Hatten et al., 2012). Indeed, changes in monsoon climate and vegetation have also resulted in changes in river runoff and sediment volume in the past (Zhang et al., 2023). During glacial–interglacial transitions, the moderate sediment supply would have led to partial exposure of the riverbed and strengthened undercutting, allowing terrace systems to form (Wang et al., 2015, 2021).
Fig 5.
Correspondence between the ages of upper Han River terraces and climate change recorded by marine δ18O.
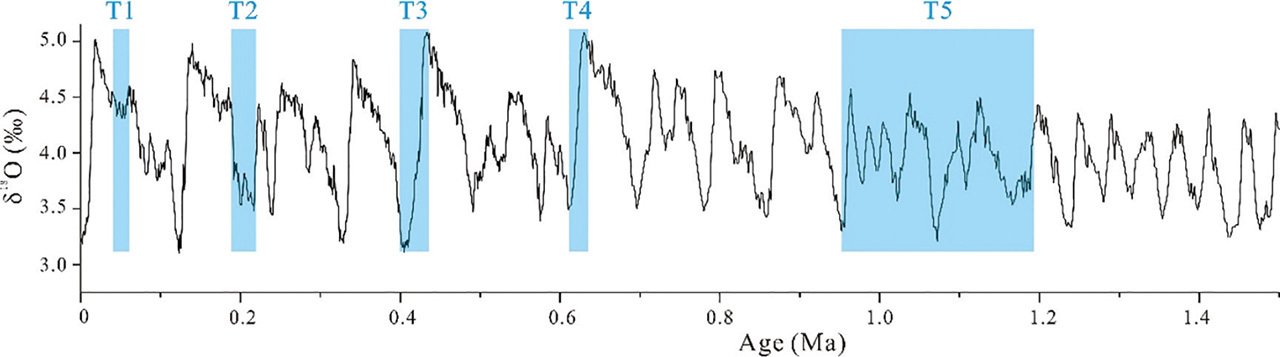
The age range (central value range) for the formation of terrace T5 determined in this study is 1129–1099 ka (i.e., slightly younger than ~1.2 Ma), which corresponds to the early stage of the mid-Pleistocene transition (MPT), when the periodicity of Pleistocene glacial cycles changed from ~41 ka to ~100 ka. It is possible that the small amplitude and short duration of climatic cycles before this time disfavoured the formation and preservation of terraces prior to the formation of T5. This interpretation is supported by studies of terrace sediments in other locations, which have indicated the terrace formation since the MPT has been closely related to the 100 ka climatic cycle (Bridgland et al., 2008). In addition, the increase in amplitude and duration of climatic cycles since the MPT may have led to phases of more intense river erosion and accumulation. This might explain why terraces were formed and preserved after 1.2 Ma (but not before) in the upper section of the Han River.
Uplift of the eastern Qin Mountains since 1.2 Ma has also influenced the development of the Han River terraces (Liu, 2004; Sun et al., 2016). High rates of tectonic uplift are inferred to have led to substantial elevation differences between river terrace levels and amplified the influence of climate change on the sedimentation–erosion process of the river, leading to the development and preservation of flights of terraces (Wang et al., 2015). In summary, after 1.2 Ma, the rates of uplift and erosion increased, and terrace systems were formed in the upper Han River, with cyclic climatic transitions amplifying these effects on terraceformation.
. Conclusions
In this study, through detailed field investigation, ESR dating and stratigraphic correlation, we determined the formation ages of the Quaternary higher terraces (T3–T5) of the upper Han River, central China. Terraces T3, T4 and T5 were formed at 422–401 ka, 627–621 ka and 1129–1099 ka, respectively. The formation times of the terraces correspond to glacial–interglacial transitions identified in the marine oxygen isotope record. Terrace T5 (i.e., the highest terrace) formed just after 1.2 Ma, which was the start time of the MPT. Integrating this information with the recorded uplift of the eastern Qin Mountains since 1.2 Ma, we propose that the terrace sequence of the upper Han River formed as a result of the combined effect of climatic transition and tectonic uplift.