
. INTRODUCTION
The first ESR dating attempt of optically bleached quartz grains extracted from Quaternary sediment was published more than 30 years ago (Yokoyama et al., 1985). Since then, a few research groups based in France, Germany, Spain, Canada, China or Japan have been working on this application over the last decades. In the absence of standardized measurement protocols, each team currently uses specific and different experimental conditions and setups (see overview in Table 1). We are not aware of any past ESR intercomparison study focused on quartz that would have evaluated potential biases among laboratories, unlike other materials such as tooth enamel (Wieser et al., 2005) or corals (Barabas et al., 1993). For example, most of the laboratories are equipped with either a Bruker or JEOL X-band ESR spectrometer and employ different measurement temperatures (from 77 K to 115 K). The latter does not have a significant impact on dose evaluation, provided that they remain overall constant throughout the experiment (Duval and Guilarte-Moreno, 2012). Similarly, one may reasonably expect that any type of ESR spectrometer would provide similar measurement results for a given quartz sample. However, the scarcity of data available in the literature about this potential issue suggests that such an assumption has apparently never been thoroughly verified.
Table 1
Overview of the different groups working on ESR dating of quartz over the last decades (non-exhaustive list). The description of the experimental setup is based on the information provided in the respective publications cited in the last column.
| Institution, city, country | ESR spectrometer (temperature of ESR measurement) | Reference |
|---|---|---|
| Museum National d’Histoire Naturelle, Paris, France | Bruker EMX (107 K) | Voinchet et al., 2010 |
| University of Cologne, Cologne, Germany | Bruker ESP 300 (115 K) | Beerten et al., 2006 |
| Centro Nacional de Investigacion sobre la Evolucion Humana (CENIEH), Burgos, Spain | Bruker EMXmicro 6/1 (90 K) | Duval et al., 2017a |
| McMaster University, Hamilton, Canada | JEOL FA-100 (77 K) | Burdette et al., 2013 |
| China Earthquake Administration, Beijing, China | Bruker ER041XG (77 K) | Liu et al., 2010 |
| Okayama University of Science, Okayama, Japan | JEOL PX-2300 (81–84 K) | Toyoda et al., 2006 |
Consequently, the present work aims at contributing to fill this knowledge gap. Taking advantage of the wide range of pieces of equipment available at the National Centre of Human Evolution (CENIEH), we measured a couple of quartz samples using different combinations of ESR spectrometers and resonators. We evaluated their performance, sensitivity and then compared the resulting ESR measurements and DE estimates.
. MATERIALS AND METHODS
Samples
We selected two quartz samples (BIZ1201, BIZ1202) from the Early Pleistocene site of Bizat Ruhama, (Northern Negev, Israel). Sample preparation was performed following Duval et al. (2017a).
Quartz extracts from each natural sample were divided into 14 multiple grains aliquots. Twelve of these aliquots (D1 to D12) were irradiated using a calibrated 137Cs Gammacell-1000 gamma source (dose rate = 7.16 Gy/min for SiO2) to the following doses: 98, 196, 393, 835, 1376, 2261, 3932, 6390, 9830, 16711, 24575 and 39320 Gy. The non-bleachable residual ESR signals of the Aluminum centre were obtained after exposing one aliquot of each natural sample in a SOL2 (Dr Hönle) solar light simulator for about 1460 h.
ESR measurements
Experimental setups
ESR measurements were performed in the ESR dating laboratory at CENIEH with two different ESR spectrometers (Bruker EMXmicro 6/1 and Bruker Elexsys E500) and three different resonators (two standard ER4102ST rectangular resonators and one cylindrical high sensitivity SHQE resonator). Full description of the three experimental setups employed in the present study can be found in Table 2. Experimental setup #1 has been used in routine for ESR dose evaluation of quartz since the start of the ESR dating laboratory in 2009 (e.g. Duval et al., 2015a, 2015b; Parés et al., 2018; Bartz et al., 2018 and del Val et al., 2019). Details about its performance and stability over time can be found in Duval and Guilarte-Moreno (2012). In comparison, the Elexsys E500 Bruker ESR spectrometer has been purchased in 2015, and since then experimental setups #2 and #3 have been installed and their performance tested for ESR dating of quartz grains.
Table 2
Description of Experimental Setups #1, #2 and #3.
Acquisition parameters
In order to obtain comparable data, the Al and Ti centres were measured with the three experimental setups using similar acquisition parameters (Table 3). The receiver gain value was optimized according to the ESR signal of the most irradiated aliquot of each sample and differs among the spectrometers (i.e., they work with different units). The other acquisition parameters were derived from those initially defined for experimental setup #1 in previous dating studies, which were optimized following international standards for ESR retrospective dosimetry (such as ISO/DIS 13304) and other reference books (Höfer, 2009 and Eaton et al., 2010).
Table 3
Acquisition parameters employed for the three experimental setups during the ESR measurements of Al and Ti centres.
Measurement conditions
In order to ensure similar resonance conditions in the resonator for all the aliquots of a given sample (i.e. the natural aliquot plus the gamma-irradiated ones), each aliquot was carefully weighed in an ESR tube. Depending on the quartz sample considered, the mass per aliquot was ranging from 223 to 255 mg. A maximum variation of 1 mg was tolerated for all the aliquots from a given sample (i.e. corresponding to a relative variability of < 0.2% in weight). Special attention was paid to the optimization of the vertical position of the sample in the resonator so that the centre of the aliquot matches the centre of the resonator (see Section 3 – Evaluating the performance of the different experimental setups).
Each sample aliquot was measured three times after ∼ 120º rotation in the resonator in order to take into account the uncertainty on the angular dependence of the ESR signal due to sample heterogeneity. Then, measurements were repeated three times over distinct days to evaluate the reproducibility of the DE values. The procedure was carried out for both the Al and Ti centres of the two samples and with the three different experimental setups.
The intensity of the ESR signal of the Al centre was extracted from peak-to-peak amplitude measurements between the top of the first peak (g = 2.0185) and the bottom of the 16th peak (g = 1.9928) (Toyoda and Falguères, 2003). Following the conclusions from Duval and Guilarte (2015), the ESR intensity of the Ti centre was measured by considering the peak-to-baseline amplitude around around g = 1.913–1.915 (Option D), as shown in Fig. S-1 in Supplementary information.
For a given aliquot, each ESR intensity was corrected by the corresponding receiver gain value, the number of scans, aliquot mass and a temperature correction factor (see Section 3 – Evaluating the performance of the different experimental setups – Influence of the temperature on the ESR signal of the Al centre in quartz). Then, a mean ESR intensity and the associated standard deviation was derived from the three angular measurements of a given time (day 1, 2 and 3).
DE evaluation
ESR dose evaluation for both Al and Ti centres was performed following the standard ESR dating procedure developed at CENIEH (e.g., Duval et al., 2015a, 2015b, 2017a). The fitting of the Dose-Response Curves (DRCs) was carried out with the Microcal Origin Pro 8.5 software using a Levenberg-Marquardt algorithm by chi-square minimization. For the Al centre, an exponential + linear function (EXP + LIN) was fitted through the experimental points, and data were weighted by the inverse of the squared ESR intensity (1 / I2). DE values were obtained by extrapolating the EXP + LIN function to the residual ESR intensity (Total bleach method, Forman et al., 2000). For the Ti centre, the Ti-2 fitting function (with no data weighting) was used as described in Duval and Guilarte (2015). For both centres, the goodness-of-fit was assessed through the adjusted r-square (r2) value, which accounts for the degrees of freedom of the system (see the Origin 8 User Guide for further details). Equations of the two fitting functions are provided in Supplementary information (Table S-1).
. RESULTS AND DISCUSSION
Evaluating the performance of the different experimental setups
In ESR dosimetry/dating, it is crucial to ensure constant experimental conditions, in order to eliminate, or at least minimize, the variations of the ESR signal that are induced by the system, and to make sure that only the variations derived from the sample itself are recorded. The main external factors that could impact measurement repeatability are: (1) the vertical position of the sample within the resonator and (2) the stability of the measurement temperature over time.
Optimizing sample position in the resonator
Because the resonator has a non-uniform volume sensitivity distribution (Barr et al., 2008 and Eaton et al., 2010), it is essential to obtain the signal intensity distribution of a resonator along the sample tube axis (i.e., vertically) in order to ensure that the sample is positioned at the centre of the resonator. This evaluation was performed by measuring a quartz sample at different vertical positions within each resonator.
The procedure was repeated several times with different quartz grains samples. The signal intensities distribution of all the resonators used in this work: two Standard rectangular (ER4102ST) and SHQE resonators are represented in Fig. 1.
Fig. 1
Vertical distribution of ESR signal intensities obtained for three different resonators. The ER4102ST (1) profile was obtained using an EMX micro 6/1 ESR spectrometer (setup #1), while the ER4102ST (2) and SHQE resonator profiles were derived from the Elexsys E500 ESR spectrometer (setups #2 and #3). To facilitate comparisons, ESR intensities were normalized according to the highest intensity value for each profile. Key: Distance = sample distance from the resonator centre. d = Distance from the centre to the top of the resonator.
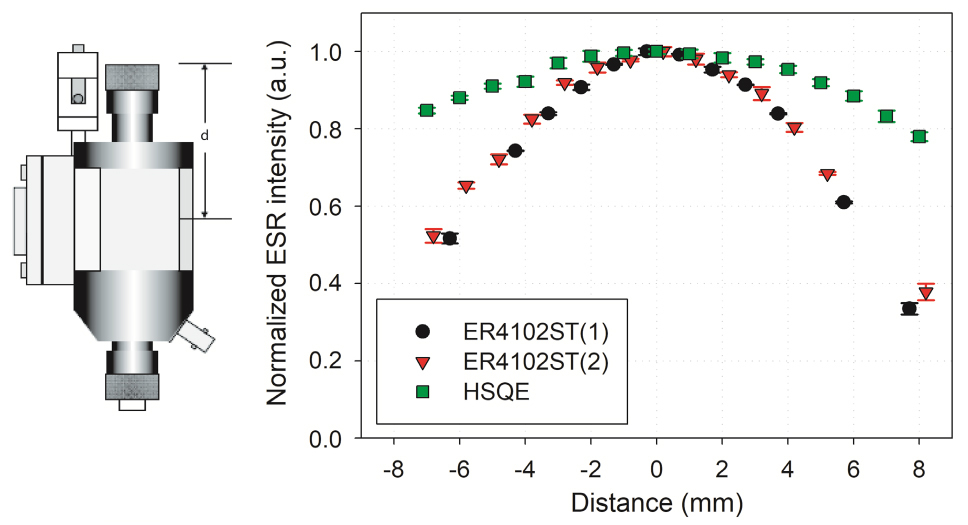
Results show a bell-shaped pattern for the three resonators, with a maximum signal intensity achieved at the cavity centre. The standard resonators (used in setup #1 and #2) show a very similar behaviour, with an intensity decrease of 4–5% for the first 2 mm around the resonator centre, and then up to 60–70% for a distance of 8 mm. Interestingly, the HSQE profile shows less curvature, with an intensity decrease of only 1.2–1.8% and 20–24% for a distance of 2 and 8 mm from the resonator centre. This indicates that a small variation of the sample vertical position within ±1 mm around the resonator centre will have much less impact on the resulting ESR intensity (1.0–1.5% for the standard resonators vs 0.5–0.7% for the HSQE). This is consistent with the fact that the HSQE has a higher filling factor than the standard resonators (Weber et al., 1998).
To sum up, these results imply that (i) the sample centre should match the cavity centre in order to obtain the highest ESR intensity, and (ii) the sample should be systematically placed at the same position within the resonator to achieve repeatable measurements. This could be achieved by measuring the distance (d, see Fig. 1) between the sample centre and the top of the resonator for each aliquot of a given sample. Our results show that d is similar for the three resonators (61.5 mm, 61.0 mm and 62.0 mm for setup #1, #2 and #3, respectively).
Stability of the system at low temperature
Following our standard measurement procedures (e.g. Duval, 2012; Duval and Guilarte-Moreno, 2012 and Duval and Guilarte, 2015), around 1 hour for the Al centre and 2–3 hours for the Ti centre are usually needed to complete the measurement of one sample formed by 12–14 aliquots. It is therefore crucial to make sure that the experimental setup is sufficiently stable in time to allow highly repeatable measurements at low temperature (<100 K) over several hours.
Consequently, the stability of setup #2 (see Table 2 for system details) was assessed following the same procedure employed a few years ago for setup #1 (Duval and Guilarte-Moreno, 2012), i.e., by leaving one aliquot in the resonator and running continuous measurements at low temperature over a given time.
Initial test showed that setup #2 could reach a minimum temperature of 90–91 K, but with questionable stability. Consequently, stability tests were performed at temperatures between 92 and 95 K for 1–5 hours (Fig. 2). A slightly higher variability is typically observed during the first 15–20 min of each experiment, which corresponds to the time needed by the system to stabilize. Overall, the ESR intensities show a coefficient of variation (CV = relative standard deviation to the mean) <3% for all temperatures considered, suggesting that setup #2 offers relatively good stability over a few hours. In particular, a slightly smaller variation has been observed at 95 K (CV = 1.5% over 5 hours) and 94 K (CV = 1.4% over 3 hours), while a CV of 2.0% (5 hours) and 0.96% (1 hour) has been obtained at 93 K, and a CV of 2.5% (2 hours) at 92 K. In other words, the lower stability observed at 92 K most likely indicates that the temperature system is closer to its limits. A similar study was previously carried out with setup #1 (see system details in Table 2) at temperatures of 85, 90 and 95 K (Duval and Guilarte-Moreno, 2012). The ESR intensities showed intensity variations < 1.5% over 1–3 hours.
Fig. 2
Evolution of the ESR intensity with time using setup #2. Different temperatures were tested. Al ESR intensities were normalized to the mean ESR intensity obtained for each aliquot. Acquisition conditions: 1 scan / 5 min for the 3−5 h tests, 1 scan / 2 min for the 2 h test and 1 scan / min for the 1 h test.
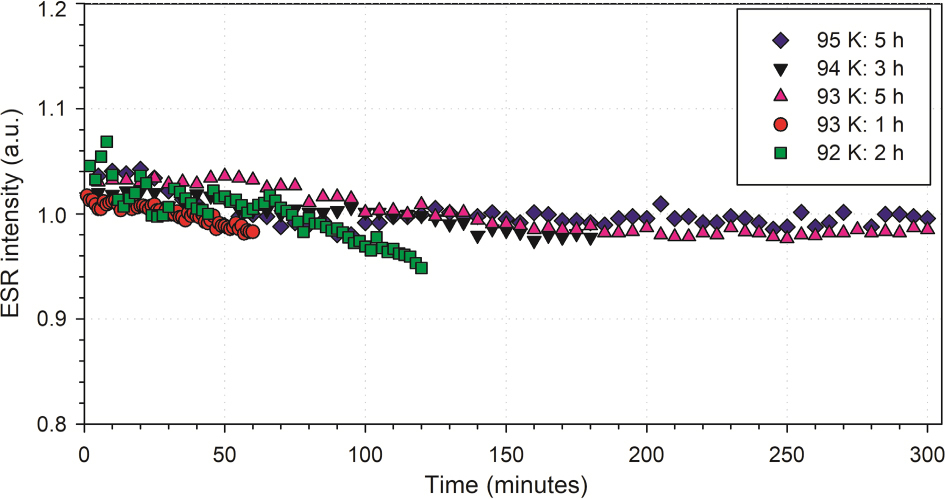
Repeated long measurements with both setups #1 and #2 do not show any systematic trend or significant drift in the ESR signal intensity with time. However, setup #1 offers comparatively higher performance than setup #2: it allows not only to reach lower temperatures (85–90 K) but also displays slightly higher stability over time. Based on our stability tests, 90 K was the temperature chosen to perform measurements with setup #1 and 94 K for those carried out with setup #2 and #3. These temperatures are low enough to obtain the spectra of Al and Ti centres with enough resolution and intensity and to ensure that the temperature systems are stable for several hours.
In addition, for both setups, it is advisable to wait for a minimum period of 20–30 minutes once the systems reach the required temperature before starting the ESR measurements, in order to avoid variations in the temperature and gas flow originated from the stabilization of the systems.
Influence of the temperature on the ESR signal of the Al centre in quartz
It is known that when measuring quartz grains (Al and Ti centres), the lower the temperature of the measurements, the better the resolution of the signal and the higher the signal intensity. However, the relation between the signal intensity and the temperature may be setup dependent. Consequently, we performed 2D scan measurements by acquiring 1 scan every 1 K from 92 to 130 K. This procedure was carried out with setup #2 and was repeated with two different quartz samples (some examples of the ESR spectra are shown in Supplementary information Fig. S-2A). Both samples showed similar behaviour with temperature, suggesting that this correlation is not sample dependent. The experimental data points were then fitted with a polynomial function (5th order), providing an equation that could be used to correct the ESR intensity according to the temperature in the resonator (Fig. S-2B in Supplementary information).
The resulting fitted curve was then compared to the data previously obtained by Duval and Guilarte-Moreno (2012) for setup #1 (Fig. 3). Interestingly, although setups #1 and #2 use a similar model of resonator, both setups show somewhat different trends (Fig. 3). Setup #1 shows a strong temperature dependence from 89 to 92 K with an intensity decrease of 7.0% / K, then 4.0% / K from 92 to 96 K and finally 2.2% / K from 96 to 102 K. Experimental setup #2 has not allowed to reach a temperature range of 89 to 92 K. However, data suggest a more linear temperature dependence than setup #1 for temperatures < 102 K, with an average intensity decrease of 3.2% / K from 92 up to 102 K. At higher temperatures, both experimental setups show a similar behaviour (Fig. 3).
Fig. 3
Comparison of the evolution of the ESR intensities (Al centre) with the temperature (intensities normalized for T= 117 K) for setups #1 and #2.
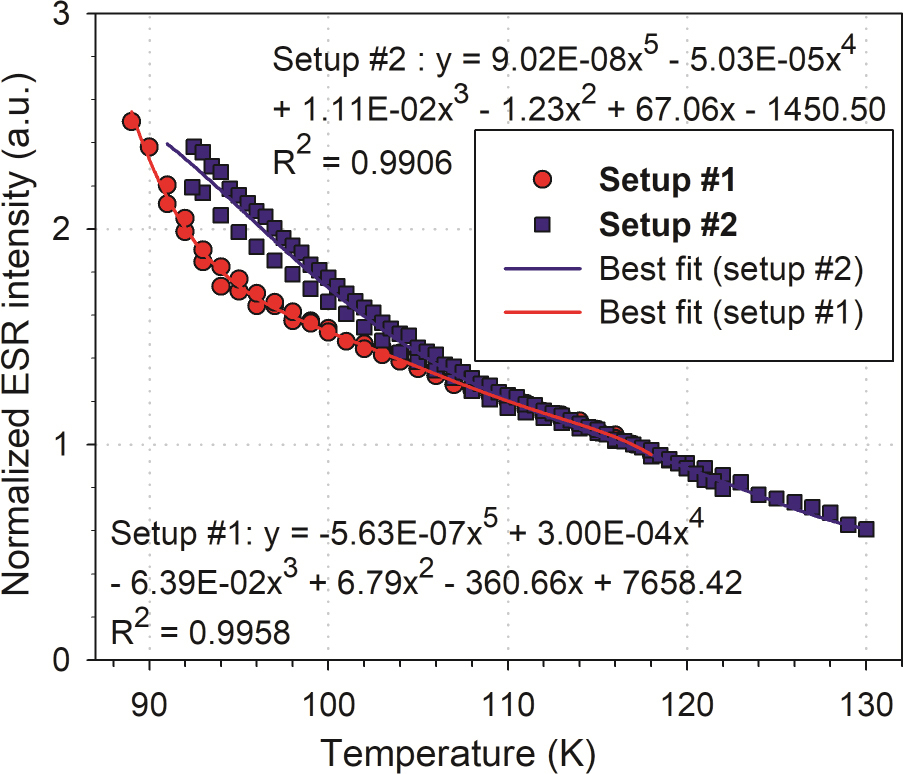
To conclude, when using a variable temperature unit, it is not uncommon to observe some slight temperature variations of up to 0.3 K among the measurements of the different aliquots of a given sample. For a given measurement, the temperature of the resonator is saved together with all the other acquisition parameters. Consequently, given the dependence of the ESR intensity on the temperature, it is recommended to systematically correct the corresponding ESR intensities in order to eliminate the small bias caused by variations of temperature during the measurement. For setup #1, a variation of about 0.2 K in the temperature range of 90 K may induce a systematic error of about 2% in the ESR intensity (Duval and Guilarte-Moreno, 2012).
The results reported in the next sections were obtained considering these preliminary studies. Each ESR tube was placed in the centre of the resonator to ensure that all the aliquots of a sample were measured under identical conditions, and all the ESR intensities were corrected by the corresponding temperature factor.
Comparison of the resonator sensitivities
We evaluated and compared the sensitivity of two of the most common types of resonators: the standard resonator ER4102ST and the high sensitivity cylindrical resonator (HSQE).
Fig. 4 shows the ESR spectra of sample BIZ1201 (natural aliquot) for the Al and Ti centres recorded with the Elexsys E500 spectrometer and both resonators (setup #2 and #3). We used the signal-to-noise ratio (S/N) as a proxy to estimate the sensitivity of each resonator. For the Al centre (Fig. 4A), the HSQE cavity provides a measurement sensitivity of almost four times higher than the standard resonator (S/N = 430 vs S/N = 120, using the same sample and acquisition parameters). In comparison, a factor of 2.6 (S/N = 26 for HSQE vs S/N = 10 for the standard resonator) has been derived from the Ti centre spectra represented in Fig. 4B.
Fig. 4
ESR spectra of sample BIZ1201 (natural aliquot) for (A): Al- and (B): Ti-centres, using both, a standard ER4102ST(2) and a HSQE resonators. ESR spectra of each centre were recorded with the same acquisition parameters. For Al centre: modulation frequency = 100 KHz, modulation amplitude = 1 G, microwave power = 10 mW, sweep time = 40.96 s, receiver gain = 60 dB and T = 94 K. For Ti centre: modulation frequency = 100 KHz, modulation amplitude = 1 G, scan = 2, microwave power = 5 mW, sweep time = 61.44 s, receiver gain = 81 dB and T= 94 K. All spectra were recorded with the Elexsys E500 ESR spectrometer.
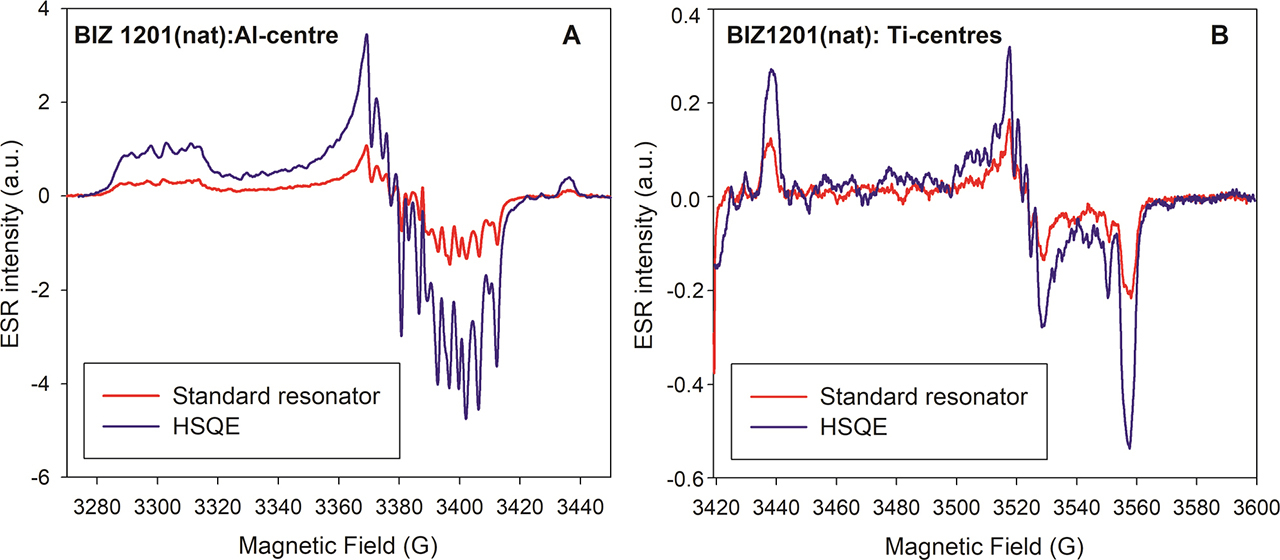
These data show the interest of using a high sensitivity resonator, such as HSQE, for quantitative ESR determination, especially when working with paramagnetic centres that generally have low signal intensities (i.e., like the Ti centres in quartz grains). Compared with a standard resonator, the number of scans required to achieve a reasonable S/N would be smaller, which would imply a considerable reduction of the acquisition time. However, a higher sensitivity is also usually linked to lower measurement repeatability, as it makes the signal intensity more vulnerable to small changes in the experimental conditions. This aspect will be evaluated in the following sections.
ESR dose evaluations
The Al and Ti centre DRCs of samples BIZ1201 and BIZ1202 were measured with the three different experimental setups and following the conditions detailed in Materials and Methods. The main objective was to gain knowledge about the precision of the ESR measurements using the three different experimental setups and to study its impact on the DE values.
Variability of the ESR intensities
Each aliquot of a given sample was measured at three different rotations in the resonator, resulting in the calculation of a mean ESR intensity, an associated standard deviation and a coefficient of variation (CV). Therefore, for each day of measurement, a mean CV value can be derived from the individual CV obtained for each aliquot of a given sample (see column 5 for Al centre, and column 7 for Ti centre in Table 4).
Table 4
Variability of the ESR intensities of samples BIZ1201, BIZ1202 (Al and Ti centres) derived from experimental setups #1, #2 and #3.
Considering the Al centre in sample BIZ1201, the CV values obtained for each day of measurement range from 0.82 to 1.05% (mean value 0.97 ± 0.13%) for setup #1, from 0.79 to 1.76% (mean value 1.27 ± 0.48%) for setup #2 and from 1.31 to 1.58% (mean value 1.48 ± 0.15%) for setup #3 (Table 4, column 5). BIZ1202 shows similar CVs, with mean values of 1.28 ± 0.24% for setup #1, 1.23 ± 0.19% for setup #2 and 1.80 ± 0.43% for the third one. The results show a good measurement reproducibility for the three experimental setups, with CV values systematically < 2.3%. Overall, setup #3 (HSQE resonator) display slightly higher variability for both samples, as it could have been expected given its higher sensitivity.
Regarding the Ti centre, the ESR intensity variabilities are higher than those of the Al centre for both samples and with the three experimental setups. This observation was expected (Duval and Guilarte, 2015), as this is simply the consequence of the much lower S/N response for the Ti centre in comparison with the Al centre. The ESR intensity variability of the Ti centre measurements is similar for the three setups. Hence, for the Ti centre, the CVs range from 2.39 to 4.08% (Table 4, column 7), with mean values of 3.68 ± 0.10% (BIZ 1201) and 3.44 ± 0.77% (BIZ1202) for setup #1, 3.15 ± 0.52% (BIZ1201) and 2.67 ± 0.25% (BIZ1202) for setup #2, and 3.52 ± 0.76% (BIZ1201) and 2.82 ± 0.25% (BIZ1202) for setup #3. Therefore, the results suggest that the three setups yield similar measurement precision.
The measurement of each complete sample was repeated over three different days with the three setups, in order to consider the reproducibility of the measurements. Then, a mean CV value was calculated by averaging the CV values achieved for the different aliquots of a sample, considering the three days (Table 4, column 6 for Al centre and column 8 for Ti centre). The Al centre shows CV values between 1.21% (BIZ1202, setup #1) and 2.02% (BIZ1201, setup #2) and the Ti centre values that range from 2.59% (BIZ1201, setup #1) to 5.00% (BIZ1202, setup #3). The results suggest that the ESR intensity variability considering the different days is practically the same as the variability obtained for each day. This observation is valid for both Al and Ti centres and shows that a good measurement reproducibility can be achieved with both spectrometers over successive days. However, once again, it is confirmed the lower precision of the Ti centre measurements in comparison with that obtained for the Al centre. This uncertainty associated with the Ti centre measurements may be slightly increased if measurements are carried out within different days, especially when a more sensitive ESR spectrometer and resonator are used (Table 4).
ESR dose-response curves (DRC)
For each sample, BIZ1201 and BIZ1202, the final ESR intensities (i.e. the mean intensity value of each aliquot, after considering the three days of measurements), were represented.
Al centre DRCs
Final DRCs derived from the three experimental setups are displayed in Fig. 5. To enable comparisons, intensities were systematically normalized to that of the corresponding natural aliquot, which is supposed to be stable over several millions of years (Imai et al., 1985 and Toyoda and Ikeya, 1991) and may thus be considered as a reliable ESR intensity standard.
Fig. 5
Comparison of the ESR intensities (Al centre) obtained from samples BIZ1201 and BIZ1202 with the three experimental setups. The spectra were recorded using the acquisition parameters shown in Table 3. ESR intensities were normalized according to the natural intensity of each DRC.
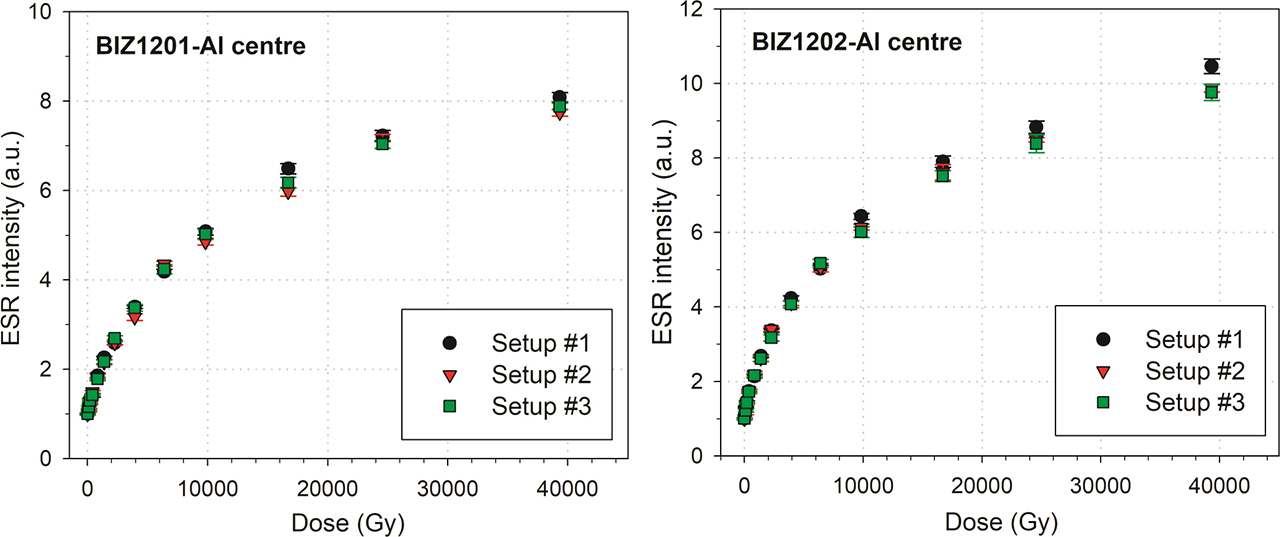
For samples BIZ1201 and BIZ1202, most of the ESR intensities achieved with the three different setups are within error (Fig. 5). In addition, the intensities derived from the different setups do not show any significant bias. It could be observed that measurements carried out with setup −1 yield similar intensities to those performed with setup −2, with a relative intensity difference of −1.31 ± 4.14% for sample BIZ1201 and −2.72 ± 4.16% for sample BIZ1202. The same observation is valid when comparing the intensities achieved with setup #1 and setup #3, giving a relative residual intensity of −0.14 ± 3.71% and −3.19 ± 3.30% for samples BIZ1201 and BIZ1202, respectively. Results also show that when using the same ESR spectrometer (i.e., setup #2 and #3), the type of resonator (standard or high sensitivity) has not any appreciable influence on the normalized intensity values, giving relative intensity differences of +1.27 ± 3.81% for BIZ1201 and −0.51 ± 3.15% for sample BIZ1202. In general, the magnitude of the associated errors illustrates a large variability of the values from one aliquot to another of a given sample, and therefore results suggest that the three different experimental setups provide similar intensity values.
Ti centre DRCs
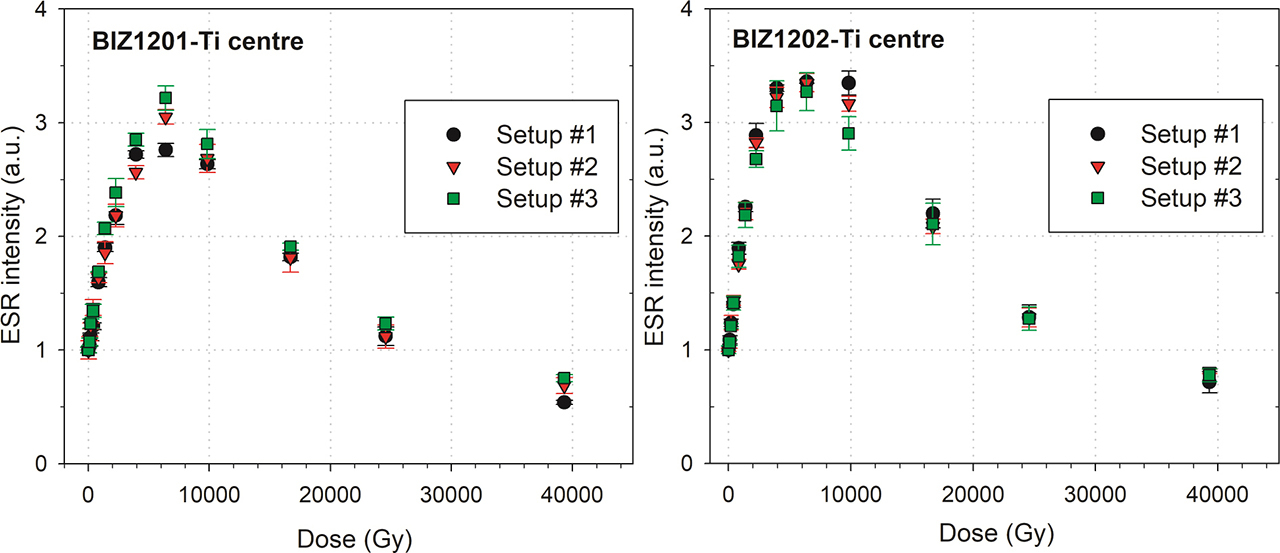
Fig. 6 shows the final DRCs of each sample for the Ti centre using the three experimental setups. It could be observed that measurements performed with setup #1 provide similar intensities to those carried out with setup #2, with a relative intensity difference of 4.76 ± 8.71% for BIZ1201 and −0.95 ± 5.02% for BIZ1202. The same observation is done for setups #1 and #3. It should be noted that for sample BIZ1201, the last point shows a large relative intensity difference of 27.3% when setup #1 and #2 were compared, and a difference of 39.4% with setups #1 and #3. This may be due to the low S/N ratio, especially with setup #1, with a value of S/N ∼ 5 for the last point measurements. Hence, the relative intensity difference without considering the last point for BIZ1201 decreases from the value of 4.76 ± 8.71% to 2.88 ± 5.72% when setups #1 and #2 are compared; and from a value of 10.10 ± 9.72% to 7.66 ± 4.32% for setups #1 and #3. When the same spectrometer was used and the only difference was the type of resonator, (i.e. setup #2 and #3), 5.18 ± 4.96% (BIZ1201) and −1.70 ± 3.07% (BIZ1202) were obtained. Consequently, results indicate that the type of resonator selected for ESR measurements does not induce any significant bias in the resulting ESR intensities.
Fig. 6
Comparison of the ESR intensities (Ti centre) obtained from samples BIZ1201 and BIZ1202 with the three experimental setups. Spectra were recorded using the acquisition parameters shown in Table 3. ESR intensities were normalized according to the natural intensity of each DRC.
In summary, data show that the three different experimental setups provide comparable intensities for both Al and Ti centres, which suggests that any of the setups could be used for quantitative ESR measurements.
DE comparison
Al centre
For each sample and setup, three DRCs were obtained: each one derived from the measurements performed on a different day (time 1, 2 and 3). A fitting process and a DE evaluation were carried out for each DRC as described in Section 2 – DE evaluation.
Results indicate that the reproducibility of the DE values is similar for the three different experimental setups. Actually, the DE variability over repeated measurements is ranging from 3.7% (BIZ1202) to 10.7% (BIZ1201) with setup #1, from 1.1% (BIZ1201) to 7.5% (BIZ1202) for setup #2, and from 6.2% (BIZ1201) to 6.8% (BIZ1202) for the third one. Although the DE reproducibility achieved with the setups show a large difference from one sample to another, except for setup #3 (both samples around 6%), the limited number of samples used in this study does not allow to draw any definitive conclusion. Moreover, the magnitude of the variability in the DE values is actually in the range of previous studies (typically between 3 and 10%, e.g., Duval et al., 2015b, 2017a). However, it is worth noting that for the three setups, all the DEs derived from the measurements performed on different days are within the error at one sigma (Fig. 7; numerical values are provided in supplementary information Table S-2).
Fig. 7
DE values (Al centre) obtained from samples BIZ1201 and BIZ1202 with the three experimental setups. DE values were obtained by the fitting of an EXP+LIN function through each DRC. Final DE values are obtained by averaging the ESR intenstities derived from the 3 repeated measurements.
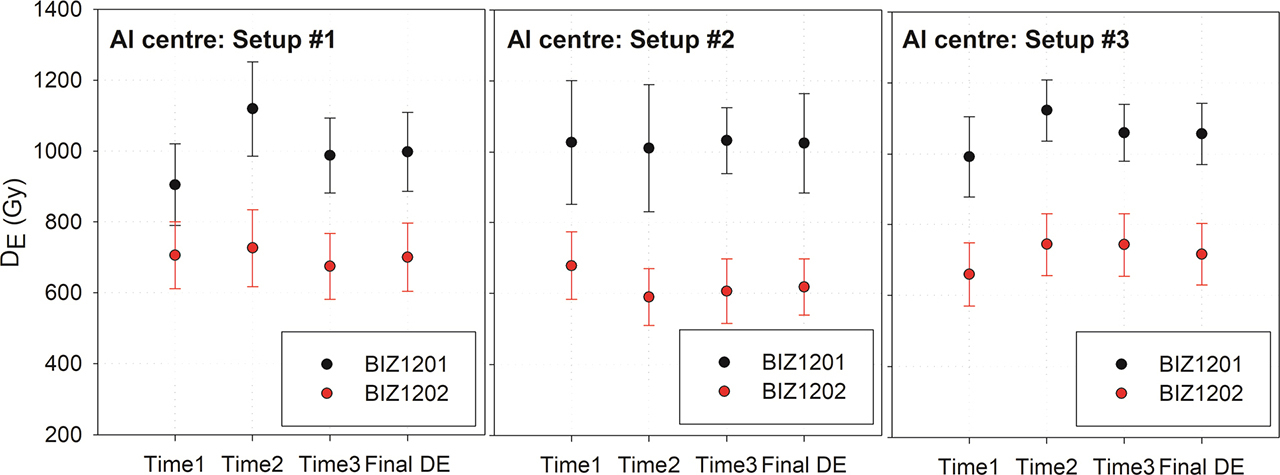
In addition, for each sample and each setup, a final DE value was obtained from the final DRC (Supplementary information Fig. S-3). Results are highly consistent for the three different setups (Table S-2 and Fig. 7).
Finally, calculated adjusted r2 values could provide an indication of the goodness-of-fit achieved by the EXP+LIN function fitted through the experimental data points. For all the samples, overall good fittings (adjusted r2 values > 0.98) were obtained when using the three different setups (Table S-2). Moreover, the magnitude of the DE error may also be used to evaluate the reliability and precision of the fitting. The relative errors in the DEs (1σ) range from 11.2 to 13.8% for setup #1, from 12.8 to 13.6% for setup #2, and from 8.1 to 12.1% for setup #3. Hence, the error values achieved are similar and indicate that the three systems provide comparable results.
Ti centre
Data show that for the three different setups, all the DEs derived from the measurements performed on different days are consistent within 1-sigma error (Fig. 8; numerical values are provided in supplementary information Table S-3). The reproducibility of the DE values is similar for the three different setups. The variability in the DEs over repeated measurements gives values of 1.6% (BIZ1201) and 11.1% (BIZ1202) with setup #1, 8.2% (BIZ1201) and 9.2% (BIZ1202) for setup #2, and 2.5% (BIZ1201) and 12.3% (BIZ1202) for the third one.
Fig. 8
DE values (Ti centre) obtained from samples BIZ1201 and BIZ1202 with the three experimental setups. DE values were obtained by the fitting of a Ti-2 function through each DRC. Final DE values are obtained by averaging the ESR intenstities derived from the 3 repeated measurements.
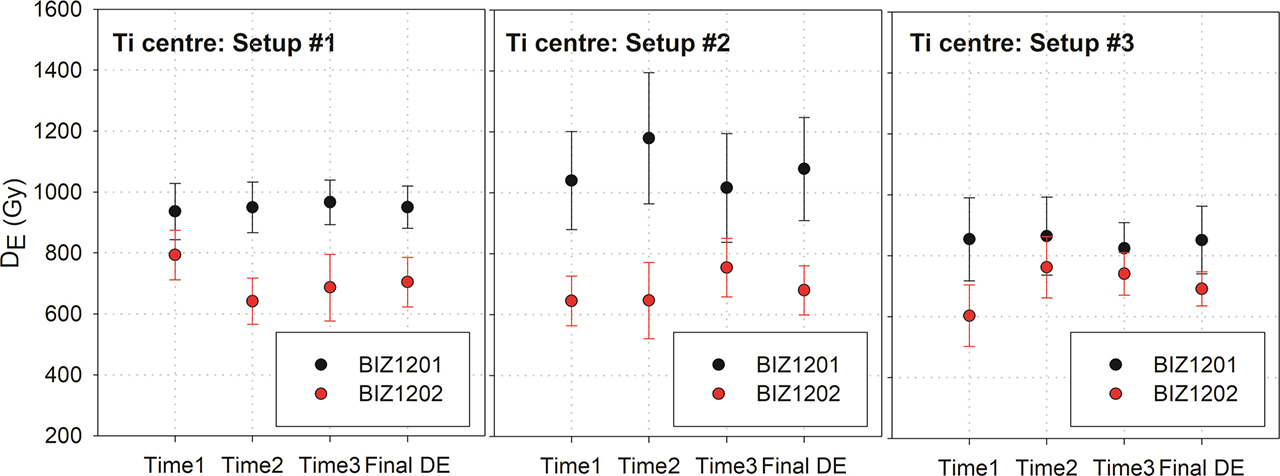
Final DRCs obtained by averaging the three repeated ESR measurements (Supplementary information, Fig. S-4) yield consistent DE values at 1 sigma for both samples measured with the three experimental setups (Table S-3 and Fig. 8). The Ti-2 function shows in general good fittings for the three different setups (r2 ∼ 0.99), except for sample BIZ1201 when the Elexsys spectrometer + any of the resonators were used (setup #2 and #3), giving r2 of 0.97–0.98, as shown in the supplementary information (Table S-3). The relative errors in the DE values (1σ) are similar with the three different setups: 7.3% (BIZ1201) and 11.5% (BIZ1202) for setup #1, 15.7% (BIZ1201) and 12.0% (BIZ1202) for setup #2, and 13.0% (BIZ1201) and 8.1% (BIZ1202) for setup #3. However, it is observed that for BIZ1201, setup #2 and #3 provide higher relative DE errors than setup #1, which could be explained by the slightly worse goodness-of-fit.
Overall, data show no appreciable difference in the calculated DEs for a given paramagnetic centre. Therefore, results suggest that any of the three experimental setups could independently be used for dose estimation of optically bleached quartz grains.
Finally, it is interesting to notice that setup #3 offers a significant reduction of the measurement time for the Ti centre, thanks to the higher S/N ratio achieved with the high sensitivity resonator in comparison with a standard one (see Section 3 – Comparison of the resonator sensitivities). For instance, for the Ti centre measurements of the present study, not only was the acquisition time halved (see Table 3, setup #2 and #3: 2–4 scans for the standard resonator vs 1–2 scan for HSQE), but the S/N ratio was also higher than with setup #2.
. CONCLUSIONS
This intra-laboratory comparison provides a further step in the standardization of the ESR method applied to optically bleached grains. It gives some insights about the potential impact of different experimental setups on measurement precision and dose evaluation of quartz grains. The main conclusions and recommendations of this study are:
Firstly, measurements should be performed under carefully controlled experimental conditions in order to ensure repeatable measurements. Among the factors to take into account, one could mention the measurement temperature (i.e., small variations between successive measurements and long-term stability of the system), the sample position in the resonator, the uniformity of the tubes used for the different aliquots of a given sample, or the sample size/mass in the tubes. These considerations are essential when using a standard resonator for quantitative measurements, but become crucial when an HSQE resonator is used in order to achieve reproducible results. Given the number of sources of uncertainty potentially impacting the ESR dating results, combined with the inherent difficulty to perform repeatable measurements at low temperature, our study indicates that the variability of the ESR intensities obtained for a given sample over repeated measurements is unlikely to be <1%, but rather lies somewhere between 1 and 5%. This is somewhat lower than the precision achieved on fossil tooth enamel (0.78–1.60%, Duval et al., 2013).
Secondly, our results show the interest of using a HSQE resonator for an improved measurement sensitivity. This resonator provides S/N ratios about 3–4 times higher than a standard resonator. Therefore, it is of special interest for measuring samples showing ESR signals with low intensity, as it could happen with the Ti centre signal in quartz samples from many site localities; or in cases where only a small quantity of sample is available.
On the other hand, the three experimental setups yield comparable results for both Al and Ti centres in terms of intensities, measurement precision and DE estimates. Dose values are all consistent within 1 sigma errors for both Al and Ti centres, suggesting that all the setups could be independently used for dose estimation of optically bleached quartz grains.
As a next step, a future inter-laboratory study would be of special interest in order to evaluate a possible bias on dose estimates due to the use of different analytical procedures. So far, this has never been really checked, although it appears to be essential in order to achieve a minimum standardization of the analytical procedure and data reporting (e.g. Duval et al., 2017b) in our field. These studies would be crucial so that the ESR dating method applied to optically bleached quartz samples could gain additional recognition within the community of Quaternary scientists.