
. Introduction
Fluvial systems represent one of the most widespread sedimentary environments on Earth, spanning diverse climatic zones (Bridge and Demicco, 2008; Miall, 2014). The evolution of rivers is intricately tied to factors such as base-level changes and climate fluctuations (Blum and Tornqvist, 2000). In the Late Pleistocene in Poland, the north-westward flow of rivers mitigated the impact of eustatic sea-level changes, placing greater significance on climate variations and transgressions of the Scandinavian Ice Sheet (SIS) in shaping river systems (Starkel et al., 2015).
The response of lowland fluvial systems to climate shifts is evident in discernible erosion-aggradation cycles observed across numerous sites (Kozarski et al., 1988; Busschers et al., 2005; Vandenberghe, 2008). Within the glacial zone, successive SIS transgressions interrupted the development of fluvial systems, while in the extraglacial zone, fluvial processes exhibited greater continuity (Peeters et al., 2016; Zieliński et al., 2019; Sokołowski et al., 2021). Fluvial systems in the extraglacial zone serve as valuable archives of climate changes, offering opportunities for the detection and reconstruction of palaeoenvironmental changes and the construction of time-climate models through multi-proxy studies (Gabris and Nador, 2007; Gębica et al., 2015; Panin and Matlakhova, 2015).
A pivotal period of climate change occurred during the decline of the last glaciation, resulting in a fundamental shift in the sedimentation style of river systems in the European Lowlands from braided to meandering sedimentation style. This transformation transpired during the transition from the Late Pleniglacial to the Bølling Interstadial (Vandenberghe et al., 1994; Mol et al., 2000; Vandenbeghe and Sidorchuk, 2020). Subsequent developments in fluvial processes during the Holocene led to the formation of smaller meanders, characterised by well-preserved organic sediments within cut-off palaeo-meanders (Kasse et al., 2010).
The Prosna River, an extraglacial river in the Polish Lowlands and a left-bank tributary of the Warta River in western Poland (Fig. 1A), showcases pronounced large meanders from the Late Glacial period alongside generally Holocene-age smaller meanders, as described in the lower Prosna River valley (Rotnicki, 1987). This intricate network of palaeo-meanders offers a unique opportunity to study in detail various critical aspects of fluvial processes and to pinpoint the chronological evolution of these features. To address this, we selected a palaeo-meander near the Rokutów village as a case study (Figs. 1B,C). This specific meander was chosen for its well-preserved depositional forms from two distinct phases of meandering processes, as observed along the present-day Prosna River channel in the cut-bank of the river. Our research objectives include as follows: (i) determining the morphology of these meanders; (ii) reconstructing depositional processes; and (iii) establishing the timeframe of meander formation processes based on optically stimulated luminescence (OSL) dating.
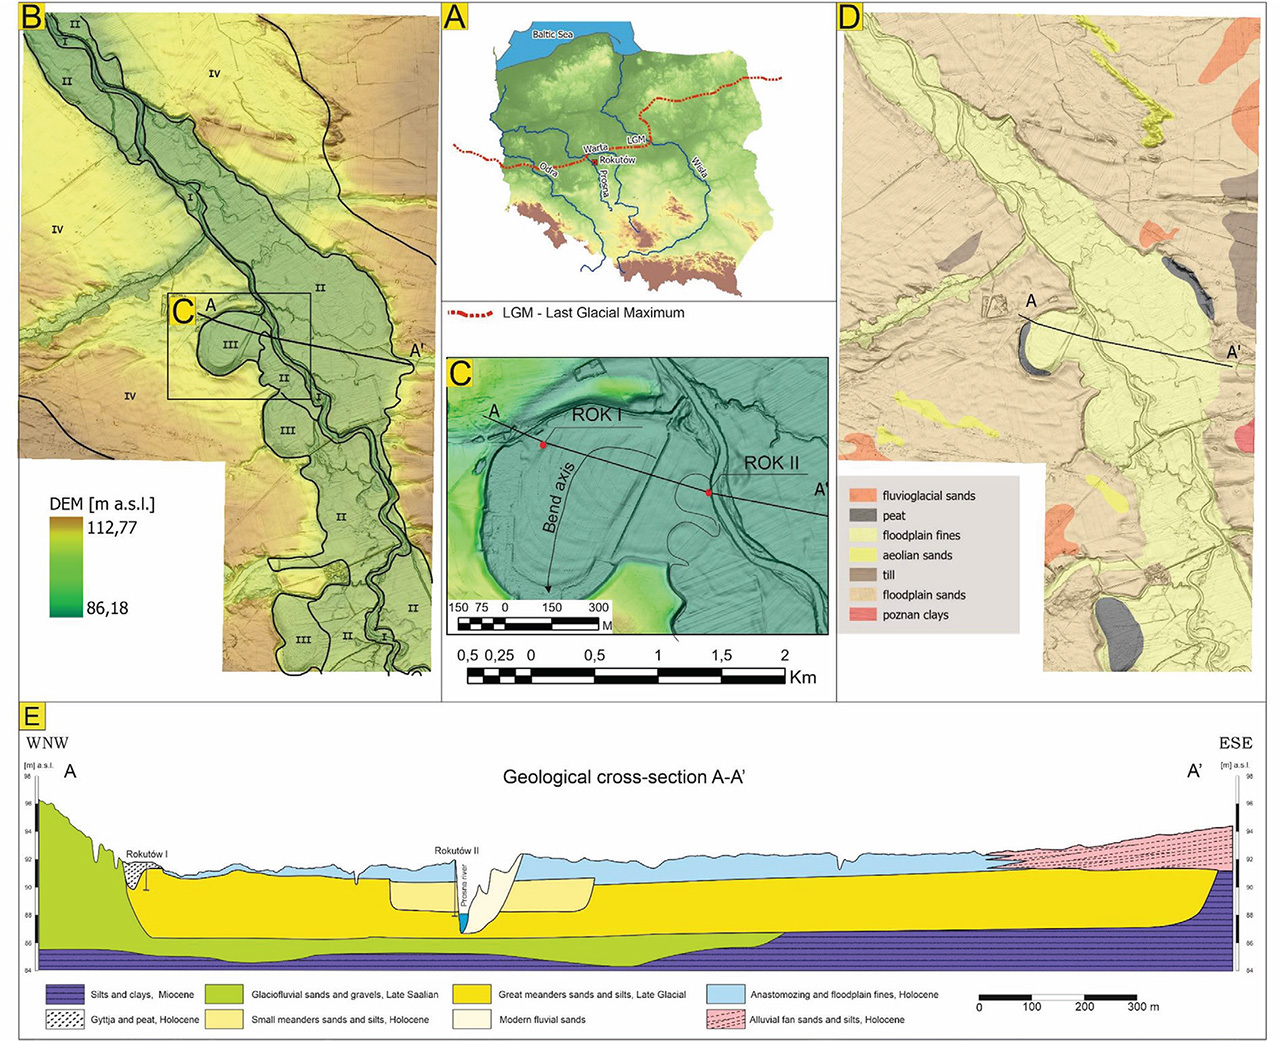
Fig 1.
A – Location of study area on the map of Poland; B – DEM with fluvial terraces; C – Detail DEM of the study area with location of studied profiles; D – Generalised geological map (after – Szałamacha 1999), modified. E – Geological cross-section through the Prosna Valley. DEM, Digital Elevation Model.
. Regional Setting
The study site is situated along the left bank of the Lower Prosna River valley in the eastern section of the Wielkopolska region, western Poland (Fig. 1A). During the one before last glaciation (the Warta glaciation, final part of the Marine Isotope Stage 6a) the area was covered with the SIS. Positioned approximately 20 km southeast of the Last Glacial Maximum (LGM), as established by Rotnicki and Borówka (1990) and Marks et al. (2016), the study site reveals a rich geological history and at least four fluvial terraces formed after Marine Isotope Stage (MIS) 6a glaciation (Figs. 1B,D). Beneath the Quaternary series, the presence of Upper Miocene clays is evident (Fig. 1E). The Quaternary deposits within the Lower Prosna River valley exhibit varying thickness, ranging from 2–3 m to 12–18 m, as reported by Szałamacha (1999) and Rotnicki et al. (2005). The higher Prosna River terraces primarily consist of glacial till, directly overlaying Miocene clays. This till, deposited during the Late Saalian (Marine Isotope Stage 6a) SIS transgression, is succeeded by glaciofluvial sands and gravels, reaching thicknesses of 5–7 m (Fig. 1D). The deposition of this series occurred during the recession phase of the Late Saalian glaciation. The investigated fluvial deposits lie approximately 8.5 m below the upper terrace (Fig. 1D).
The formation of the Prosna River valley occurred in several phases. The initial phase develops during the concluding stages of the Warta glaciation (Marine Isotope Stage 6a), marked by the southward flow of melt-out water during deglaciation (Szałamacha, 1999). The second phase transpired during the Eemian interglacial, characterised by a northward flow direction (Rotnicki, 1987). In the Weichselian glaciation (sensu lato), six terraces were formed (Rotnicki and Borówka, 1990). Throughout the last glaciation, the Prosna River valley functioned as an extraglacial river, serving as a tributary to the pre-Warta river system. The Prosna River mouth, situated approximately 20–30 km to the north, fell within the direct influence of the LGM extent. In the latter part of the Late Pleniglacial, a braided-river system prevailed, accompanied by aggradation of sandy series within the valley. The transition from a braided to a meandering system likely occurred at the onset of the Late Glacial period (Kozarski et al., 1988). During the Late Glacial period, heightened river incision and the formation of sandy terraces and large meanders facilitated the intensification of aeolian processes, giving rise to inland dunes with palaeosols (Moska et al., 2022, 2023). Throughout the entire Holocene, the lower segment of the Prosna River operated within a meandering system, contributing to the formation of at least two generations of meanders (Rotnicki and Borówka, 1990).
. Materials and Methods
Thorough investigations were conducted at two distinct exposures. The initial exposure was situated in the north-western section of the expansive meander, delving to a depth of 1.6 m (Fig. 2). Material for the survey was meticulously collected from a depth of 0.5 m below the groundwater level, using a steel pipe for extraction and secure handling. The second exposure was situated in the erosional undercut of the Prosna River within the confines of a smaller meander. In this instance, sediments with a depth of up to 4.5 m were meticulously analysed across an approximately 30 m width. Sediment samples were gathered from both exposures, laying the groundwork for subsequent laboratory studies.
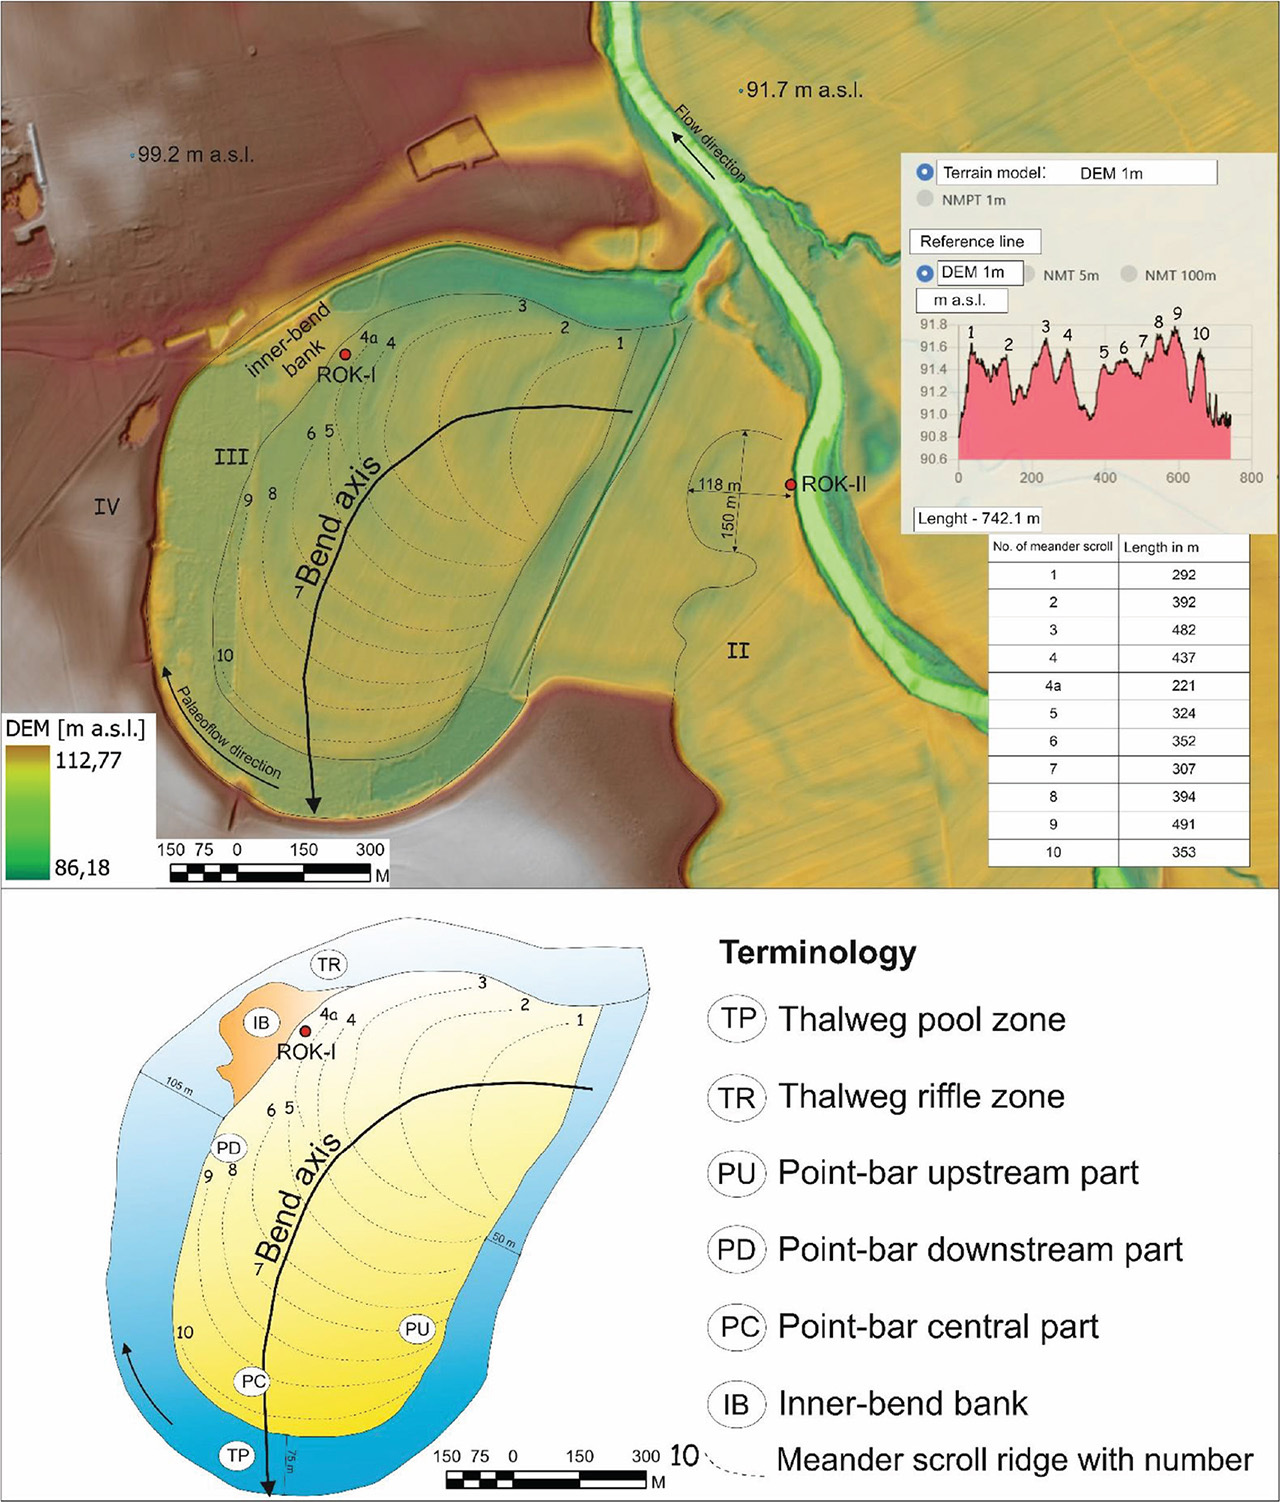
Fig 2.
Morphology and morphometry of the great meander in the Rokutów site. Terminology of meandering elements after Ghinassi et al. (2014), modified.
. GIS Analysis
The Geological Information System (GIS) analysis was conducted using a digital elevation model (DEM), specifically a raster data type generated from asc extension files. These files are essentially text files that construct a raster matrix separated by spaces. The analysis focused on the Prosna River valley segment stretching from Budzynek to Bogusław (Fig. 1B), with GIS data sourced from the open-access platform www.geoportal.gov.pl. The initial horizontal resolution of the raster data was 1 × 1 m, but resampling to a 2 × 2 m resolution was executed to eliminate fine-scale disturbances like ploughing marks in the fields. The raster data underwent processing through the Topographic Position Index (Weiss, 2001; Newman et al., 2018), with the results used to generate the relief maps in Figs. 1 and 2. Various geospatial functions were applied in the GIS analyses, including resampling, aggregation, calculation of flow direction and flow accumulation, slope and DEM no sinks. These geostatistical operations were crucial for calculating the Topographic Wetness Index (TWI, Sørensen et al., 2006), employed to delineate the spatial extent of meanders. The GIS analysis proved instrumental in pinpointing the locations of documentary sites within the Prosna River valley study area. The study identified four separate river terraces, detailing their altitude and fluvial characteristics (Fig. 1B). Furthermore, for the great meander at the Rokutów site, the number, length, height and width of scroll bars were precisely determined (Przedwojski, 2006).
. Lithofacial Analysis
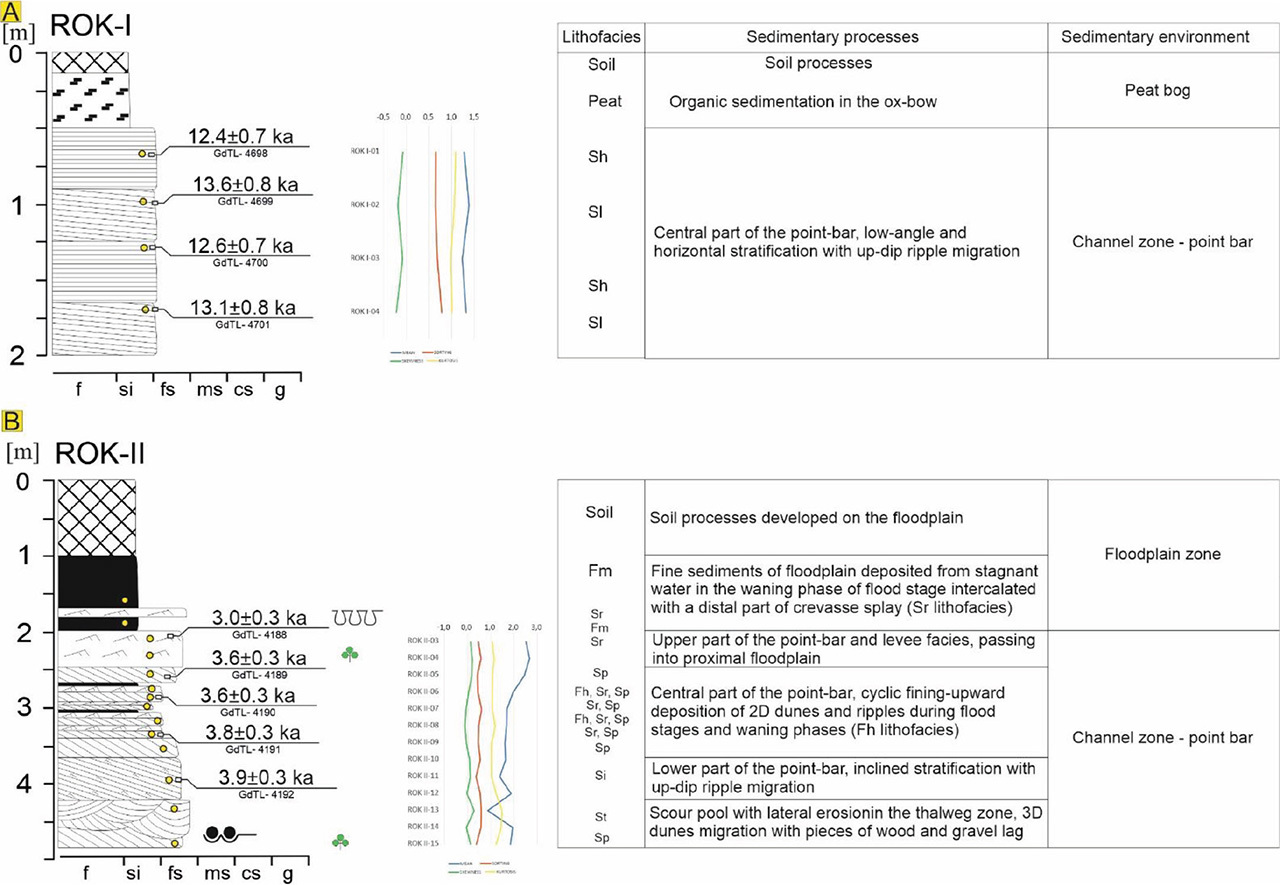
A comprehensive lithofacial analysis was conducted to reconstruct sedimentary processes and their chronological sequence, with the outcomes presented in Figs. 3 and 4. Structural aspects such as size, shape, stratification or lamination, along with textural considerations like grain-size distribution, were systematically examined to identify lithofacies types. The analysis adhered to the methodology proposed by Miall (1978, 2006) and incorporated additional recommendations by Zieliński (2014). Nineteen samples were meticulously collected from both profiles for granulometric analysis, as illustrated in Fig. 3. Approximately 400 g of sediment sample was utilised for this analysis. The results were used to generate grain-size curves on a logarithmic scale, and subsequent statistical parameters – including mean diameter, sorting, kurtosis and standard deviation (skewness) – were calculated, as present in Fig. 4 (Rząsa and Owczarzak, 2013). The granulometric analysis was processed using the methodology outlined by Folk and Ward (1957) and implemented through the Gradistat software.
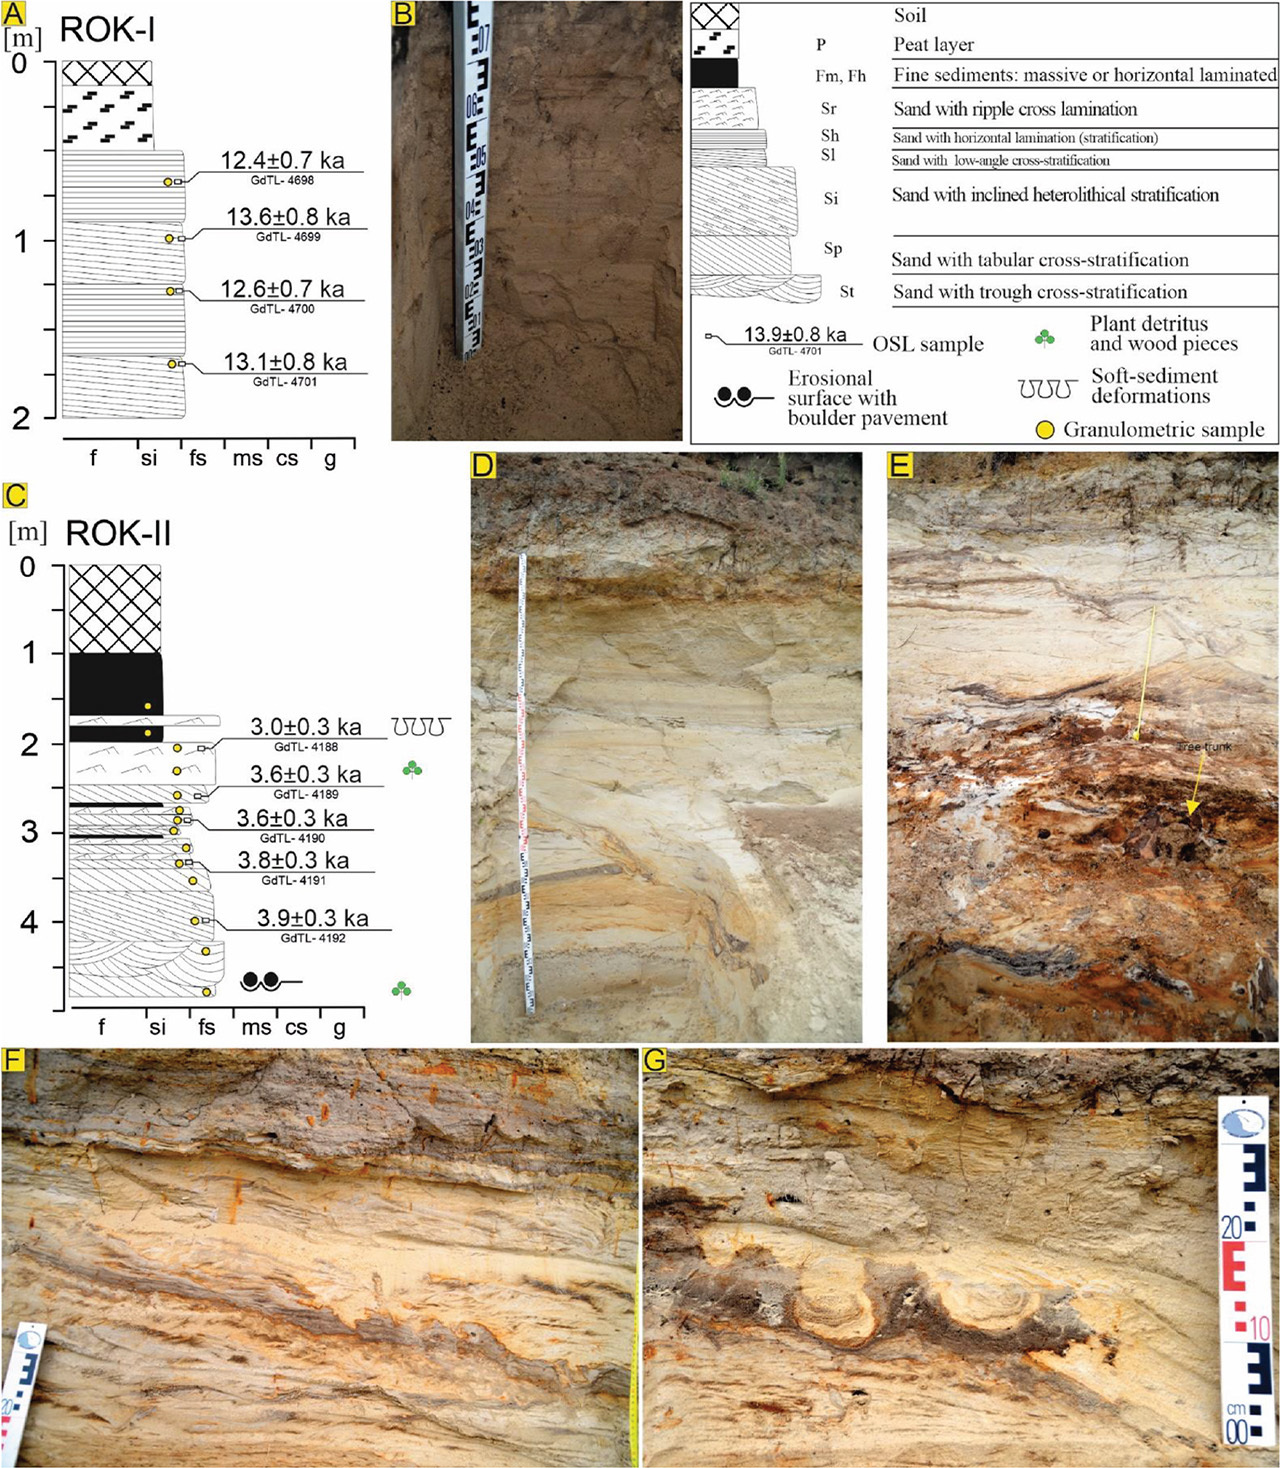
Fig 3.
A – Profile ROK-I; B – Stratified sands in the ROK-I profile; C – Profile ROK-II; D – Fining-upward succession of the point bar with erosional channel in the central part; E – Lower part of the point-bar succession with tree trunks (yellow arrow) in the lower part of the point bar; F – Transition of upper part of the point bar (sands with ripple cross-lamination) into fine sediments of the floodplain; G – SSDs in the upper part of the point bar. SSDs, soft-sediment deformations.
. OSL Dating
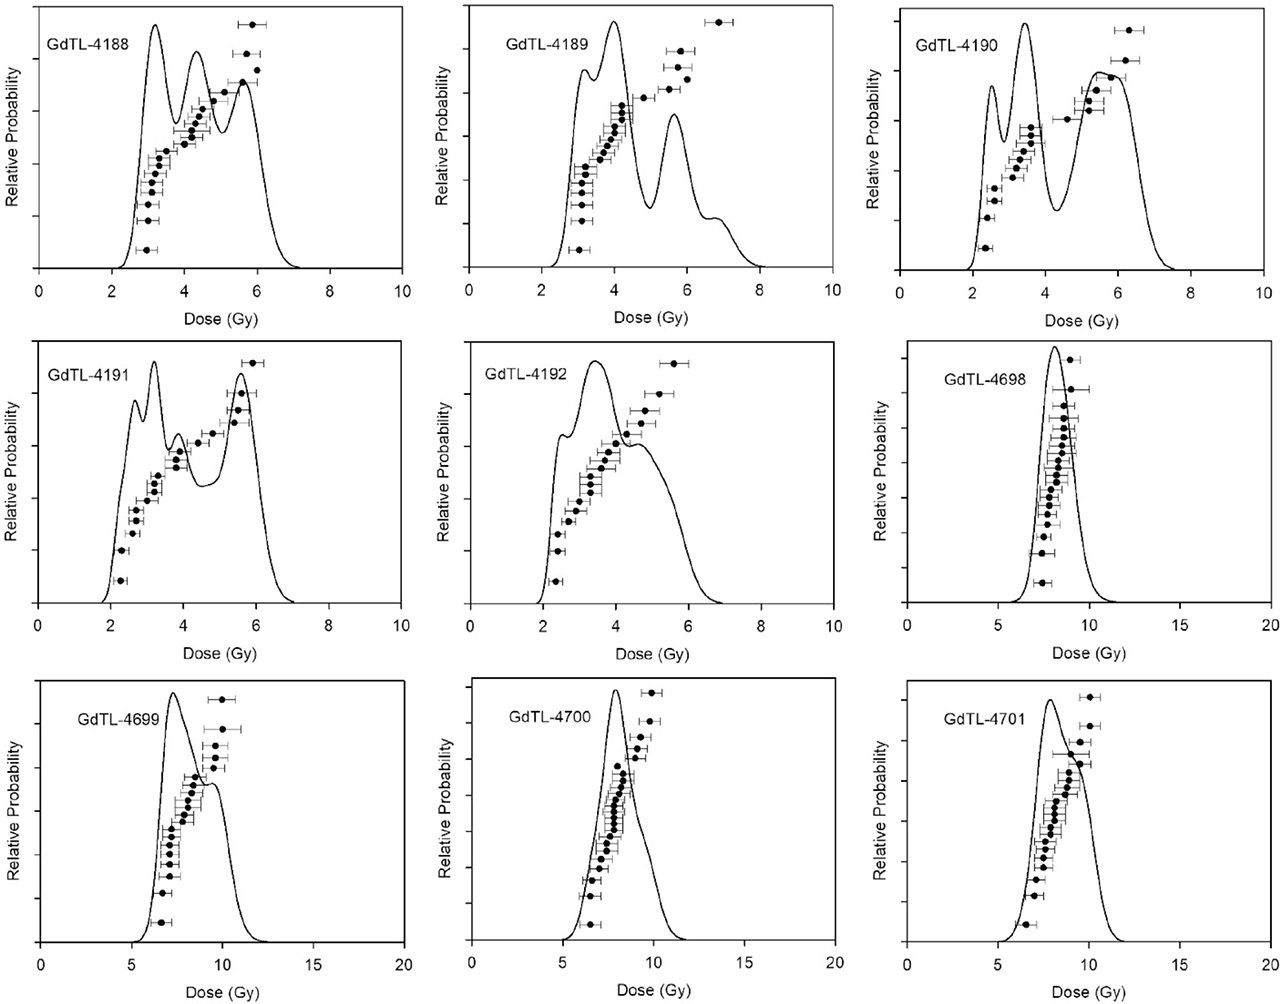
Four samples from the ROK-I profile and five from the ROK-II were taken for OSL dating (Fig. 3). Samples from the ROK-I profile were collected from upper part of the point-bar succession (lithofacies Si). In the ROK-II profile samples were taken from all main parts of the point-bar succession and different lithofacies (Fig. 3). The measurements have been carried out in the Gliwice luminescence dating laboratory (Moska et al., 2021). For dose rate determination high-resolution gamma spectrometry using an HPGe detector manufactured in Canberra was used in order to determine the content of U, Th and K in the sample according to the laboratory protocol (Moska et al., 2021). Dose rates were calculated using online dose rate calculator (Tudyka et al., 2023), which contains all the latest conversion factors. We assumed that the average water content was 15 ± 3%. All necessary data for dose rate calculations are presented in Table 1 and Fig. 5. For OSL measurements, coarse grains of quartz (125–200 μm) were extracted from the sediment samples by routine treatment with 20% hydrochloric acid (HCl) and 20% hydrogen peroxide (H2O2) (Aitken, 1998).
Table 1.
All important data for investigated luminescence samples: sample names, depth, radionuclid concentration, overdispersion parameter, dose rate, equivalent dose (CAM model) and final age.
The grains underwent a sieving process, followed by separation based on density using sodium polytungstate solutions, resulting in grains with densities ranging from 2.62 g/cm3 to 2.75 g/cm3. Eventually, the grains underwent etching with concentrated hydrofluoric acid (HF).
All OSL measurements were performed using an automated Risø TL/OSL DA-20 reader fitted with a calibrated 90Sr/90Y beta source delivering about 6.0 Gy/min to grains at sample position and a 6 mm Hoya U-340 filter was mounted during OSL measurements. Equivalent doses were determined using the single-aliquot regenerative-dose (SAR) protocol (Murray and Wintle, 2000). Final equivalent dose (De) values were calculated for all samples using the Central Age Model (CAM) or Minimum Age Model (MAM) (Galbraith et al., 1999) using R package ‘Luminescence’ (Kreutzer et al., 2020). All obtained age distributions are presented in Figs. 3,4 and Tab. 1, where the age distribution is presented in terms of relative probability density functions (Berger, 2010). Overdispersion parameter for samples from ROK-II profile was higher than 20% with not unimodal distributions, so for those samples MAM was used. For samples from ROK-I profile series, distributions are unimodal and overdispersion parameters are much lower than 20%, therefore it can be assumed that the tested material represents a group of the well-bleached quartz (Moska, 2019) and CAM model can be applied for final equivalent dose calculation.
. Results
. Morphology
Based on the analysis of the DEM, we identified four distinct river terraces (Fig. 1B). The highest terrace (IV) is situated at an elevation of 98–97 m above sea level (a.s.l.) and is thought to represent the Late Pleniglacial phase of fluvial aggradation. Terraces III and II were delineated due to visible river incision, leading to the formation of a meandering system. Terrace III, positioned at an elevation of 91.5–91.0 m a.s.l., comprises what are referred to as large meanders. These meanders exhibit a diameter following meander accretion of 742 m, with a perpendicular dimension of 495 m (Fig. 2). The difference in elevation between the oxbow infill surface and the culminations of point-bars does not surpass 1.8 m. The large meander is characterised by 10 scroll bars (swale and ridge pairs) spanning the entire width of the meander, along with one shorter scroll (scroll No. 4a, Fig. 2). The lengths of the scroll bars range from 221 m to 491 m, with individual heights not exceeding 0.7 m. The point bar axis extends for 742 m (Fig. 2), altering its trajectory from an initial westward orientation to a southern direction. Interestingly, this change is in direct contrast to the primary outflow direction in the valley (North - West).
Terrace II is situated at an elevation of 91.0 m a.s.l. and features a small-meander system along with sinusoidal channels characteristic of an anastomosing system. The observed second meander spans a length of 118 m and a width of 150 m. Remarkably, it exhibits no discernible signs of rotation or translation. Unfortunately, potential scroll bars within this meander are concealed beneath a thicker layer of floodplain sediments, measuring up to 2 m in veils indepth. Consequently, the morphology lacks distinguishable and measurable meander scrolls. Located at the base of this meander, within the Prosna River undercut, is the ROK-II profile. Terrace I, recognised as a flood terrace, is believed to have formed in the Late Holocene and has been influenced by human activities. It is positioned at an altitude of 90 m a.s.l.
. Sedimentary Succession
The examined profiles showcase two distinct generations of meander formation. The ROK-I profile unveils an older and more expansive meander, while the ROK-II profile exposes a sequence associated with a younger and more compact meander.
The cumulative thickness of sediments in the ROK-I profile measures 2 m (Fig. 3A). These sediments are characterised by medium-grain sands exhibiting low-angle and horizontal stratification (Fig. 3B). The analysed sediments display homogeneity in grain size (Fig. 4A). Immediately above the sands, a 0.5 m thick layer of peat is present, which has undergone transformation due to agrotechnical processes. This sandy peat, cultivated for agriculture, is adorned with the roots of contemporary plants and, consequently, has not been sampled for radiocarbon dating.
The sedimentary sequence in the ROK-II profile reaches an impressive thickness of nearly 5 m (Fig. 3C). This sequence follows a fining-upward (Fig. 3D). Towards the lowermost section of the profile, a prominent erosional surface is observed. Just above it, there is a layer of mid-grained sand with fine gravels and fragments of tree trunks exhibiting a massive to through-stratified structure (Fig. 3E). Progressing upward, the sediments transition from medium-grained sands with planar cross-stratification to fine-grained sands featuring ripple cross-lamination. Within the central portion of the profile, an erosional channel is discernible, filled with inclined cross-stratification and displaying ripple marks in its upper segment. Above the channel infill, fine-grained sands with ripple cross-lamination gradually transform into silty sands containing dispersed plant detritus (Fig. 3F). Notably, these lithofacies exhibit small soft-sediment deformations (SSD) with thicknesses of up to 10 cm. The uppermost segment of the profile comprises silts and organic muds interspersed with sandy strings forming ripples, showcasing both horizontal and massive structures (Fig. 3G).
. OSL Dating Results
Four sediment samples were collected from the ROK-I profile for age dating using the OSL method. The obtained dating results span from 13.6 ± 0.8 ka (GdTL-4701) to 12.4 ± 0.7 ka (GdTL-4698) in the upper segment of the profile (Table 1 and Fig. 5). These results strongly suggest that sediment deposition occurred within the timeframe of 13.5–12.5 ka.
In the case of the ROK-II profile, OSL dating results ranging from 3.9 ± 0.4 ka (GdTL-4192) in the lower portion to 3.0 ± 0.3 ka (GdTL-4188) in the upper section (Fig. 3C). Remarkably, the temporal span of depositional processes did not exceed 1000 years.
. Discussion
Through morphometric and morphological analysis, we successfully distinguish two distinct generations of meanders. These findings find reinforcement in OSL dating and lithological features, notably preserving shared characteristics of meander point bars such as lateral accretion perpendicular to the valley axis, fining-upward profiles and the prevalence of overbank and ox-bow facies at the summit (Ghazi and Mountney, 2009; Ghinassi et al., 2014).
. Sedimentary Processes
The progradation of the great meander in the Rokutow site indicates its upstream rotation with a contraction (Lin et al., 2021). This is rather uncommon, given that meanders typically exhibit expansion perpendicular to the valley axis or downstream translation with rotation, as noted by Ghinassi et al. (2014). The distinctive rotation and contraction in this instance may be attributed to the relatively narrow valley in comparison to the meander radius and the specific lithology of the substrate (Fig. 1E). This challenging scenario may have arisen due to difficulties in eroding in a direction consistent with the valley gradient, a phenomenon well-documented by Nanson and Hickin (1986) and Parker and Andrews (1986). The resistant Miocene clays, positioned at depths ranging from a few to several meters beneath the ground surface (as indicated by Szałamacha, 1999), served as the resistant substrate in this context. It is presumed that the meander effectively ‘slid’ down the inclined surface of the Miocene clays, moving in a direction almost opposite to the valley gradient. Further studies involving an in-depth examination of other large meanders in the Lower Prosna valley, combined with a comprehensive survey of their respective substrates, will help substantiate this hypothesis.
The prevalence of medium-grained sands in the examined outcrop within the expansive meander unveils insights into two key factors: the fraction of available material sourced from the eroded outer bank and the energetic dynamics of the river stream. Due to elevated groundwater levels, excavation of the outcrop to a greater depth was impossible. Nonetheless, it is reasonable to infer that the average grain size is larger than what is typical in fining-upward point bar profiles (as outlined by Galloway and Hobday, 1996; Miall, 2006). This suggests a predominant sandy fraction, resulting in an estimated potential specific stream power (ωpv) of approximately 101 W/m2 (according to Kleinhans and van den Berg, 2011). The channel width exhibited variations, ranging from 50 m in the upstream section to 105 m in the downstream section, with a central section width of 75 m (Fig. 2). The presumed depth of the channel at full-bank discharge reached approximately 6 m (Fig. 1E). In comparison, the average width of the contemporary Prosna channel in the study area is around 25 m, while the channel depth in the meander apex reaches 3–4 m. This allows us to assume that, as with other rivers of the European Lowlands, the flows in the Prosna River in the Late Glacial were clearly higher than modern flows.
The subsequent generation of meanders, as examined in the ROK-II section, is positioned at the same altitude as the older meander (Fig. 1). This suggests that the Holocene erosion in this segment of the Prosna River valley was predominantly of the lateral type, setting it apart from other rivers in the Polish Lowlands (as noted by Kozarski et al., 1988; Pożaryski and Kalicki, 1995). The analysed profile provides a full succession of the laterally migrating point bar (Fig. 4B), with the overall sediment thickness indicating that the full channel flow reached depths of around 4 m. The lower boundary is characterised by an erosional type, evident in the gravel lag and tree trunk pieces (Fig. 3E). The presence of numerous crystalline rocks in the gravel-sized material, originating from Scandinavian area (primarily from the SIS), suggests reworking during post-Saalian fluvial processes (Rotnicki, 1987). The preserved shape of the meander indicates a straightforward expansion perpendicular to the main valley axis (Ghinassi et al., 2014). The size of the meander, particularly the width of the palaeochannel (20 m), closely mirrors that of the present-day Prosna River, implying a relatively consistent fluvial regime. The mean grain size reveals a fining-upward (Fig. 4B). Thick overbank deposits (up to 2 m) in the upper section of the profile were deposited during frequent flood episodes in the Upper Holocene, followed by the sedimentation of fine material with dispersed organics. Small SSDs observed in the upper part of the point bar (Fig. 3G) formed due to rapid deposition on the slope of the outwash, influenced by frequent changes in the river water level and partial liquefaction of the deformed sediments (Pisarska-Jamroży and Weckwerth, 2013). Considering the large thickness of overbank sediments, the lower Prosna valley displayed a general trend of slow aggradation during the Late Glacial and Holocene, primarily of fine sediments. Notably smaller Holocene meanders, comparable to those in other river systems of the European Lowlands, are interpreted as a consequence of reduced discharge in the Holocene compared with the Late Glacial (Vandenbrghe et al., 1994; Rotnicki and Młynarczyk, 1998; Vandenberghe, 2015). The 4-m deep incision of the Prosna River occurred after 2 kyr ago and is presumed to be associated with historical times and human regulation of the river (Małecki and Ptak, 2015). Further exploration beyond the scope of this article is required to delve into this aspect.
. Chronology of Fluvial Processes
The genesis of the first generation of meanders took place during the Late Glacial period. OSL dating results point to their formation occurring in the Allerød, extending possibly into the Younger Dryas (Fig. 6). Similar conclusions on the formation of great meanders in the middle and lower sections of the Prosna River valley were previously proposed by Rotnicki and Latałowa (1986). It is important to note that our analysis specifically focused on the upper part of the point-bar succession, which is part of the great meander of terrace III. The exploration of oxbow lake infilling at the Grodzisko site, situated on the left bank of the Lower Prosna River approximately 6.5 km northwest of the Rokutów site, provides additional insights. These studies suggest that the cut-off of meanders coincided with the Younger Dryas (refer to Gałka et al., 2020). The synchronicity in the timing of the formation and cutting of the great meanders is consistent across the Eastern and Central European Plains (Vandenberghe and Sidorchuk, 2020). Comparisons with larger rivers in central and western Europe, such as the Warta River in Poland, the Niers-Rhine Rivers in western Germany and the White Elster River in eastern Germany, reveal that braided channels became inactive at the outset of the Bølling and were succeeded by extensive meandering systems (as documented by Kozarski et al., 1988; Kozarski 1991; Mol et al., 2000; Kasse et al., 2005; Starkel et al., 2007). Our findings suggest that the process of great meander formation at the Rokutów site might have commenced somewhat later than observed in these larger rivers (Fig. 6). The potential for a differing age of large meander development is hinted at by results from the Pannonian Plain and Eastern Europe, where such meanders formed during the Late Pleniglacial (Sidorchuk et al., 2001; Kasse et al., 2010). This intriguing issue warrants further investigation, particularly focusing on the primary segment of the large meander at the Rokutów site.
Fig 6.
Synthesis of fluvial system changes of the lower Prosna River (this study, Poland), Warta River (Poland, Vandenberghe et al., 1994; Bohncke et al., 1995), Maas River (the Netherlands, Huisink 1997; Van Huissteden and Kasse 2001), Tisa River (Hungary, Kasse et al., 2010) and Eastern Germany (Kasse et al., 2003).
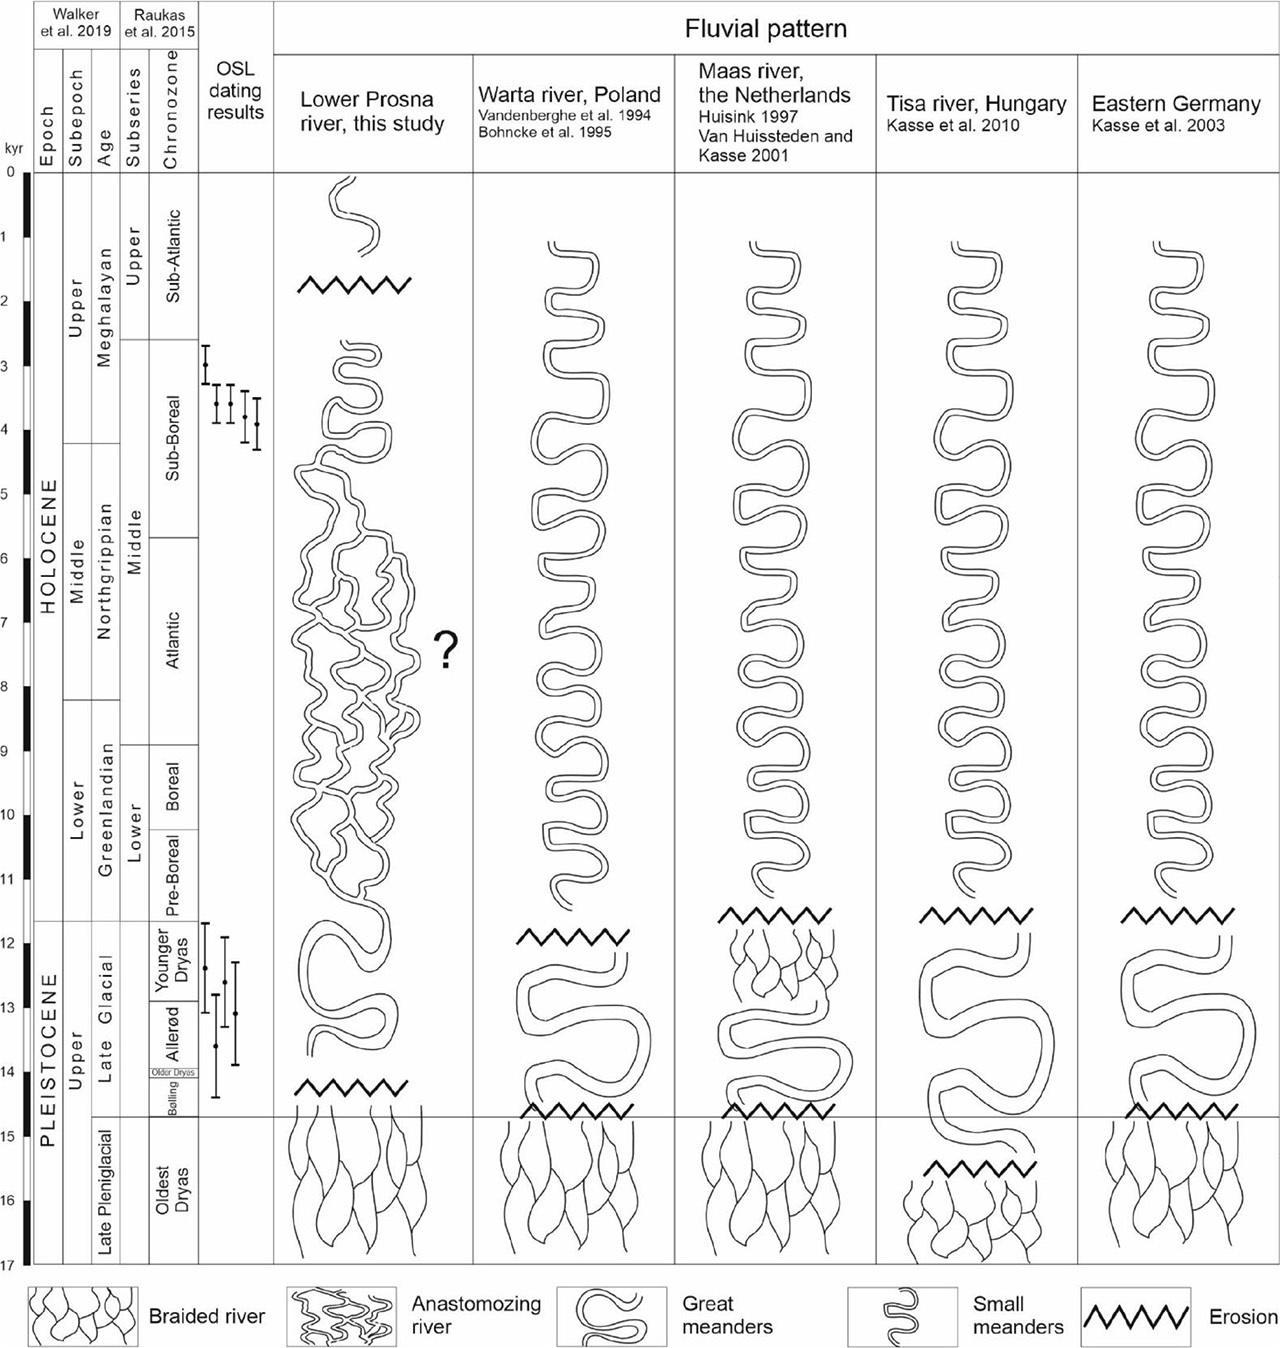
In the European Lowlands region, following the formation of great meanders, fluvial processes develop in diverse scenarios (Fig. 6). In western Europe, the development of great meanders ceased due to pronounced climate deterioration during the Younger Dryas, leading to the resurgence of a braided style of fluvial processes (as documented by Vandenberghe et al., 1994; Kasse et al., 2005). Conversely, in central and eastern Europe, as well as in the Pannonian Plain, a shift to a braided river did not occur during the Younger Dryas (see Kozarski et al., 1988; Sidorchuk et al., 2009; Kasse et al., 2010). During the Early Holocene, the size of meanders underwent reduction due to changes in the hydrological regime, with smaller meanders becoming predominant and the formation of several river terraces (see Kozarski, 1991). In the Lower Prosna River valley, the post-formation history of fluvial processes following the great meanders of the Late Glacial period appears to exhibit a slightly different pattern. The analysis of the DEM of terrace II suggests the possibility of an anabranching/anastomosing style of fluvial processes (Fig. 6). This is evident in the network of small, sinuous channels dissected by minor meanders. Notably, all morphological elements in the study area are situated at the same altitude, without apparent traces of river incision post the formation of great meanders (Fig. 1B). The assumed anastomosing phase is presumed to have occurred during the Lower and Middle Holocene, facilitated by the relatively low gradient of the river (averaging 0.82‰, according to Kaniecki, 1976). However, the absence of dating results from these sediments limits stratigraphic verification of this assumption.
Around 3.6–3.9 kyr ago, the anastomosing system was transformed back into a meander system (Fig. 6). At this stage of the research, pinpointing the precise cause for this shift is challenging. It is presumed, however, that climatic fluctuations during that period led to slightly higher amplitudes of annual flows in the Prosna River. This, in turn, triggered a return to more energetic river flows and the subsequent formation of point bars within a single-channel system. Given the relatively diminutive size and limited preservation of the point bars from this era, it can be conjectured that the development of the meanders was disrupted, potentially resulting in a reversion to a multi-channel (anastomosing) river system (see Kaniecki, 2011). This hypothesis is substantiated by an examination of archival topographic maps, revealing that as recently as 400 years ago, the Prosna River exhibited a multi-channel pattern (as noted by Małecki and Ptak, 2015). Substantive alterations to the river’s pattern did not manifest until the 19th and 20th centuries.
. Conclusions
The studies of the lower Prosna River valley infill gave an insight into evolution of extraglacial fluvial systems in Poland in the Late Glacial–Holocene period. On its basis we can reveal the following conclusions:
The aggradation of deposits in the Prosna River valley likely occurred until the onset of the Late Glacial period. Preserved sediments on terrace IV suggest a predominant braided river style of sedimentation during this phase. Following this, the river incised into its bedrock, reaching a depth of 9–10 m.
After a period of subdued erosion, large meanders emerged, albeit somewhat later compared with other river systems in the Polish Lowlands, occurring approximately 1000 years later. The analysed great meander displayed an unusual upstream rotation with a contraction, influenced by the slope direction of the resistant sub-Quaternary surface.
A period of great meandering was followed by a relatively long period (8–10 kyr) of stabilisation in the valley and the development of an anastomosing system with slow aggradation, mainly of overbank facies.
Around 3.6–3.9 kyr ago, the anastomosing system was transformed back into a meander system. The anastomosing system underwent a transformation back into a meander system. These meanders formed through simple expansion perpendicular to the valley’s main axis. However, they were significantly smaller than the great meanders of the Late Glacial period, with the entire episode lasting no more than 600–900 years.
The period of small meanders, the Prosna River reverted to a multi-channel system. This configuration persisted until the 19th and 20th centuries when the river underwent regulation, in which it was incised into the bedrock by approximately 4 m, returning to a single-channel model.