
. Introduction
The timing of periglacial events on the Polish Lowland is reconstructed primarily on indirect premises: (1) dating of biogenic sediments in periglacial deformations (Klatkowa, 1990, 1996; Goździk, 1996; Petera, 2002), (2) the relationship between these structures and periglacial evidence to glacial phases of the last ice sheet and (3) the dating of periglacial mineral sediments (Mojski, 2005; Turkowska, 2006; Marks et al., 2016).
Periglacial sediments and landforms are common in the Polish landscape and comprise slope features, river valleys, denudational plains and drainless depressions (Dylik, 1967; French, 2007). Periglacial processes transformed older landforms and created new ones. In Central Poland, there are many small buried depressions of the Saalian Glaciation (MIS 6) age which were filled with lacustrine-terrestrial deposits during the Eemian or the Early Vistulian, covered with mineral deposits and deformed in a periglacial environment during the Last Glacial Termination (LGT).
In the second half of the 20th century, Central Poland was intensively studied and traces of the Vistulian (Weichselian) periglacial processes were identified (e.g., Dylik, 1963, 1967, 1969; Dylikowa, 1964; Goździk, 1973), including at the Józefów site. In the 1960s, research at Józefów was based primarily on the examination of periglacial features in the exposures. The age of the deposits was determined based on a pollen analysis of underlying sediments, which were correlated with the Amersfoort-Brörup interstadial (Dylik, 1969). The Józefów site consisted of four fossil depressions, in which sediments and deformation structures were identified as fragments of a relict pingo (Dylik, 1963, 1967), and so far the only documented fossil pingo in Poland.
This study aimed to determine the lithostratigraphy of the Vistulian deposits supported by their sedimentological features at this site. Recently, research at Józefów has resumed in the most accessible shallow, closed basin with a dry bottom, which allowed the geological work to be performed using drillings and outcrops.
The Optically Stimulated Luminescence (OSL) method has been used successfully to date periglacial deposits at many Vistulian sites in Poland and aeolian deposits in the Polish part of the European Sand Belt: in the Silesian Lowland, the southern Mazovian Lowland and the Sandomierz Basin (Dobrowolski and Fedorowicz, 2007; Kalińska and Wyszomierski, 2010; Gębica et al., 2016; Moska et al., 2020, 2021b, 2023). These results show that aeolian deposits were formed during the Late Pleistocene when large ice sheets covered much of northern Europe. As the climate warmed up and the ice sheet retreated, vast amount of sand was exposed and mobilised by wind and therefore, this area is extremely interesting due to the high dynamics of changes.
Another significant area in Poland is its loess region, which allows to select the lithostratigraphic sequences spanning hundreds of thousands of years. The Polish extensive loess covers are known particularly from the central and eastern parts of the country. Loess has been widely used for optically stimulated luminescence dating (OSL; Moska et al., 2012, 2015, 2017, 2019; Gębica et al., 2016).
Periglacial sediments are well suited for OSL dating, but a single field reconnaissance and sampling strategy constitute a key consideration. We expect that OSL dating and lithological methods, which have not previously been applied at this site, may provide new input about the origin of sediments. This is a starting point for a more detailed approach to the recognition of processes and climatic conditions during the Vistulian, which is very diverse in terms of climatic conditions.
. Study Site
The Józefów site (51°49′59.32″N, 19°53′24.7″E) is located on the Łódź Upland, in the third-rank watershed separating the Mroga and Jeżówka and Rawka river catchments. This area was formed primarily during the Warta Stadial of the Odranian (Saalian) Glaciation (Figs. 1A,B and Table 1) and is dominated by tills, glacial and glaciofluvial sand and gravel (Nowacki, 1993; Trzmiel, 1994) and slope sand and silt, activated by Vistulian denudation processes.
Fig 1.
(A) Location of the study site in relation to extents of ice sheets, (B) Location on the geological background (according to SMGP 1:50,000). Holocene: 1 – fluvial sand and mud; Vistulian: 2 – mineral-organic mud, 3 – deluvial sand and mud, 4 – fluvial sands; Warta Stadial: 5 – glaciofluvial sand, 6 – glaciofluvial sand and gravel, 7 – glacial sand with gravel, 8 – sand, gravel and boulder (morainic), 9 – glacial till; 10 – study site.
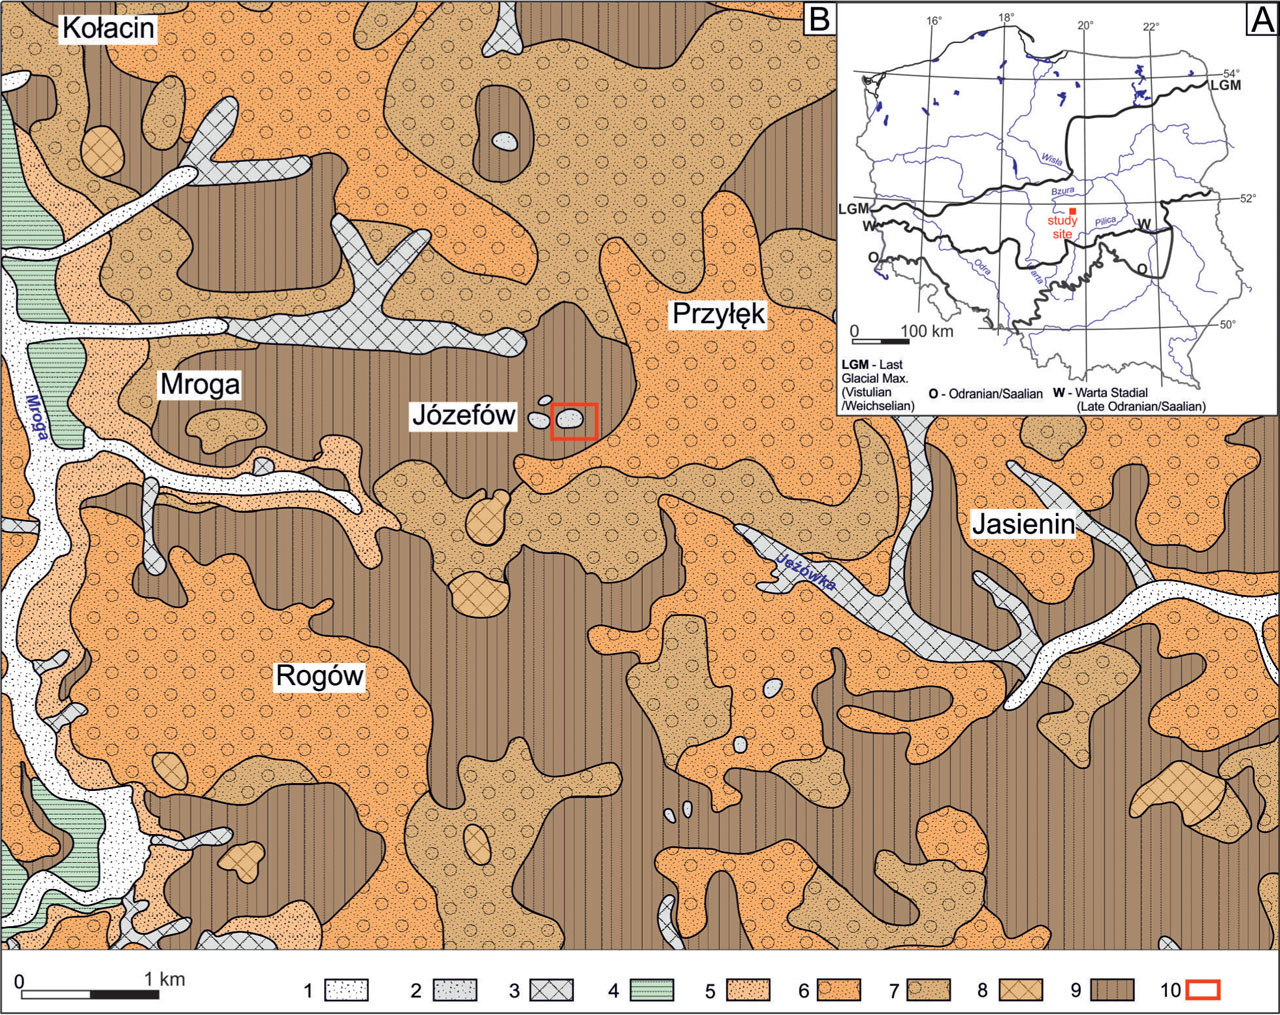
Table 1.
Results of lithological analysis for most samples of deposits used for luminescence dating.
The examined Józefów basin is amidst a dozen or so such features located on a glacial moraine plateau which is cut off from the surrounding area by denudation valleys that run westwards to the Mroga River valley and eastwards to the Rawka valley. The studied depression lies at about 200 m a.s.l., reaching to 211.5 m a.s.l and 212.7 m a.s.l. about 1 km to the south-west and north-east.
. Material and Methods
Five outcrops were examined, two of which were partially exposed with walls of excavations made in the 1960s (sections II and V, on Fig. 2).
Fig 2.
Orthophotomap view of the Vistulian deposits sequence in sections I-V (their location is marked on topographic sketch below) with distinguished lithofacies (Table 2) and sampling sites for luminescence dating (Table 3).
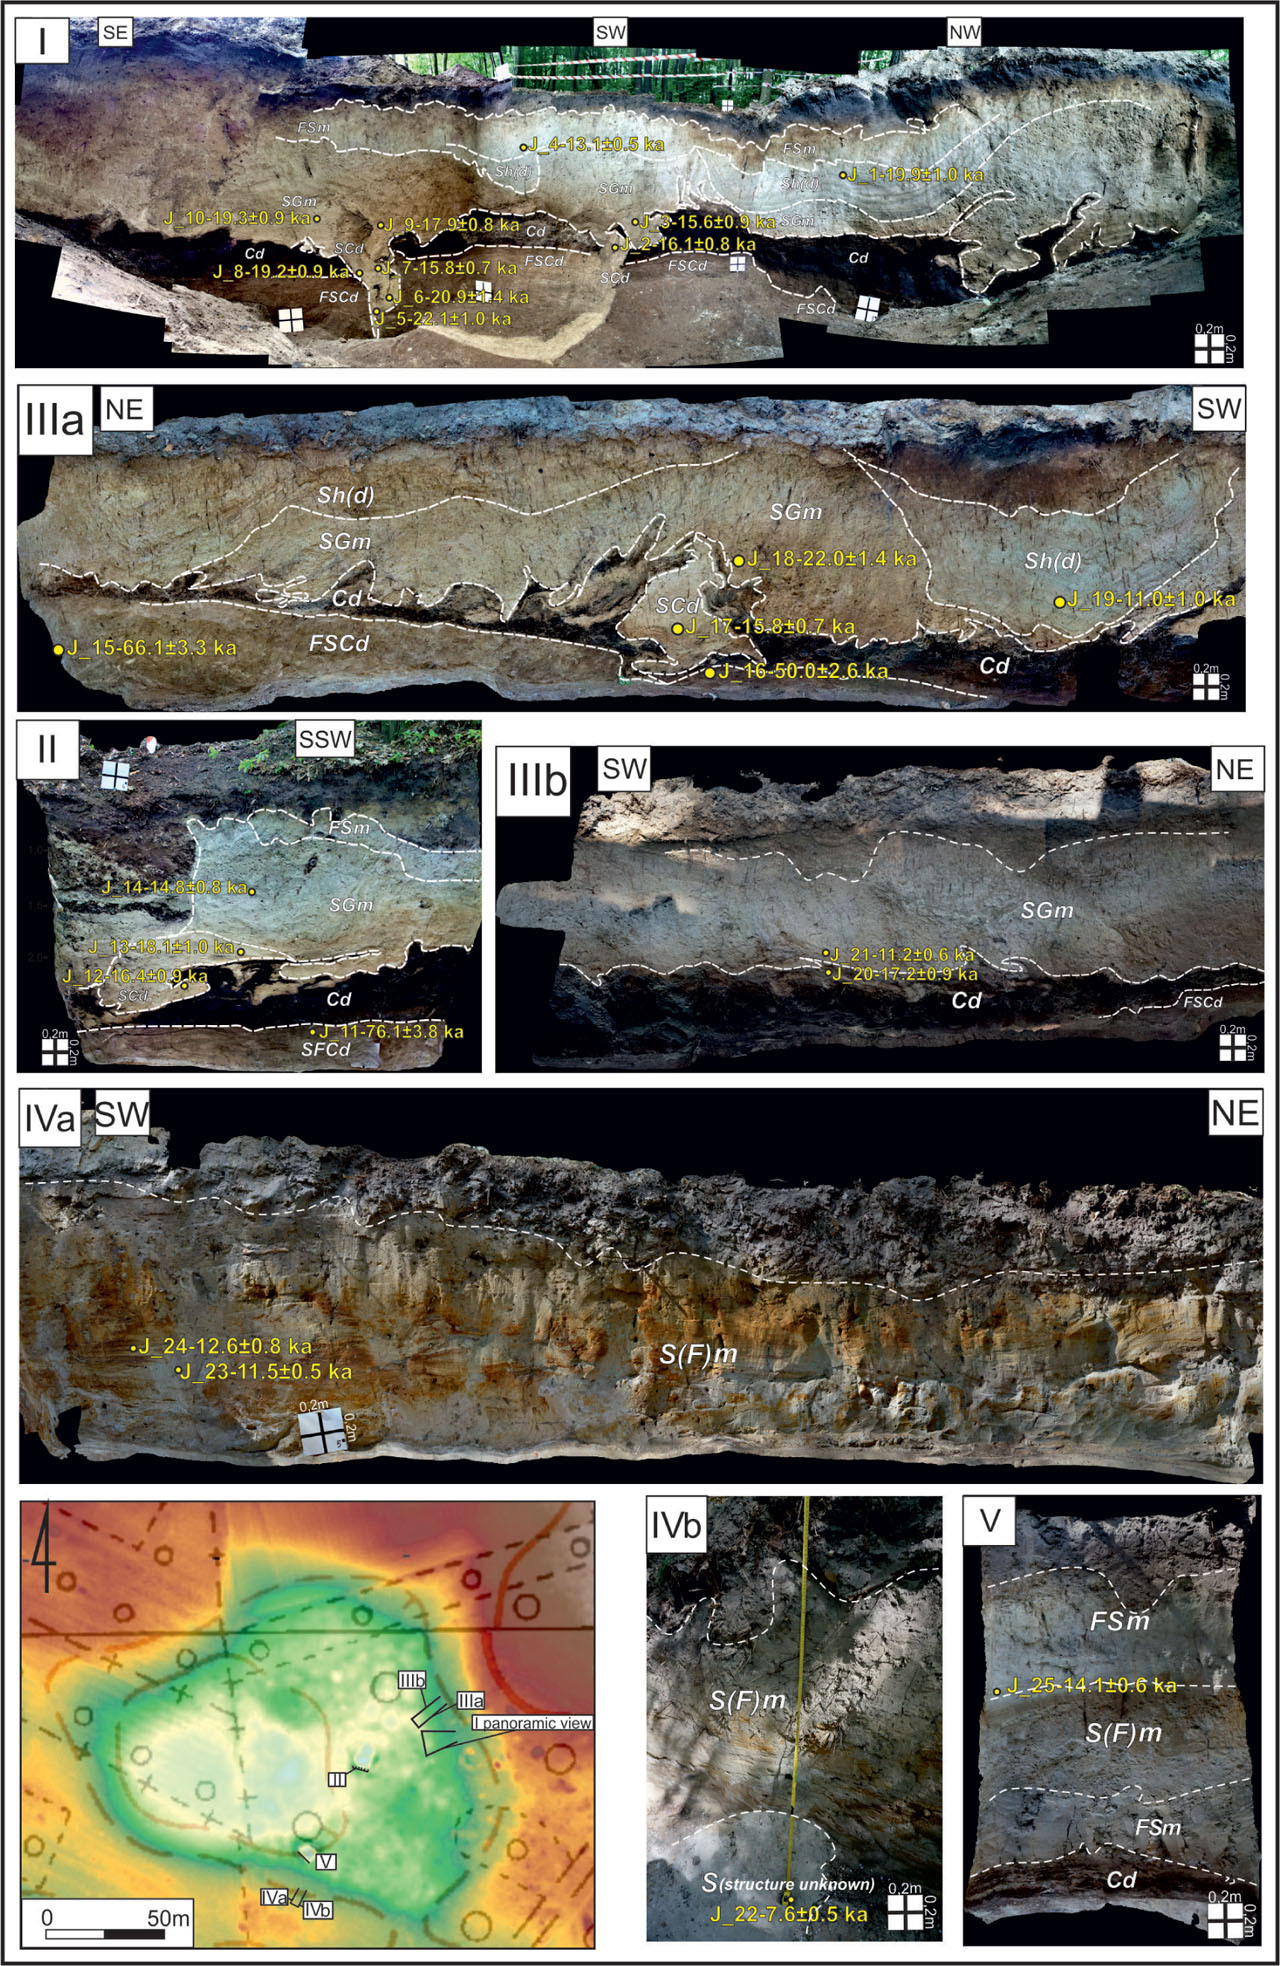
Table 2.
Lithofacies code used in this study.
| Code | Texture |
| G | Gravel |
| S | Sand |
| F | Silt |
| C | Organic matter |
| Code | Structure |
| d | Deformed |
| m | Massive |
| h | Horizontal |
Table 3.
All important data for investigated luminescence samples: sample names, depth, radionuclide concentration, overdispersion, dose rate, equivalent dose (CAM model) and final age.
. Lithological Analysis
Samples were collected from the same layer used for the dating. The grain-size analysis included examination of material using sieves (intervals 0.3–0.5 φ; dry sieving method) (Mycielska-Dowgiałło, 1995) for each of the documented sections in outcrops (Fig. 2). Using the Folk and Ward's formula (1957), the particle coefficients were determined for each sample: mean grain diameter (Mz), sorting (σI) and skewness (SkI). Sedimentary environments were determined based on the roundness and morphoscopy of quartz grains (fraction 0.63–0.8mm) by the modified Cailleux method (Cailleux, 1942; Klatkowa, 1991; Manikowska, 1993). Five types of grains were determined: RM – round, mat (abraded in aeolian transport); EL – shiny (typical of fluvial environments); M – mediate; C – cracked (with earlier processing); NU – non-processed, fresh grains. The results are presented partially in this article, and selected samples of deposits are OSL dated (Table 1). Deposits were divided into lithofacies based on codes proposed by Zieliński (2015) (Table 2).
Sediment structures, their post-sedimentary deformations and contacts between the series were documented for all examined outcrops. Their detailed analysis will be presented in a subsequent paper.
. Luminescence Dating
All samples for luminescence dating were taken from the sections with most characteristics, from a clean vertical outcrop using thin-walled steel pipes. The measurement was carried out in the Gliwice luminescence dating laboratory (Moska et al., 2021a). For dose-rate determination, high-resolution gamma spectrometry was performed using a HPGe detector manufactured in Canberra in order to determine the content of U, Th and K in the sample according to the laboratory protocol (Moska et al., 2021a). Dose rates were calculated using an online dose-rate calculator (Tudyka et al., 2023), which contains all the latest conversion factors. We assumed that the average water content was 15 ± 5%. Data for dose-rate calculations are presented in Table 3.
For OSL measurements, grains of quartz (90–125 μm) were extracted from the sediment samples by routine treatment with 20% hydrochloric acid (HCl) and 20% hydrogen peroxide (H2O2) (Aitken, 1998). The quartz grains were sieved before they were separated using density separation with the application of sodium polytungstate solutions, leaving grains of densities between 2.62 g/cm3 and 2.75 g/cm3. Finally, grains were etched with concentrated hydrofluoric acid (HF, 40 min).
All OSL measurements were performed using an automated Daybreak 2200 TL/OSL reader (Bortolot, 2000) fitted with a calibrated 90Sr/90Y beta source delivering about 2.7 Gy/min to grains at the sample position. Daybreak 2200 uses blue diodes (470 ± 4 nm) delivering about 60 mW/cm2 at the sample position after passing through BG39 filters. Equivalent doses were determined using the single-aliquot regenerative-dose (SAR) protocol (Murray and Wintle, 2000). The OSL SAR protocol used in our measurements comprised the following steps:
Irradiation with the regenerative beta dose Di
Preheat at 260°C for 10 s
Blue light stimulation at 125°C for 100 s
Irradiation with the test dose Dt (~10% of natural dose, but not <1 Gy)
Cut-heat at 220°C
Blue light stimulation at 125°C for 100 s
Intensities measured in steps 3 and 6 were used for equivalent dose determination. For equivalent dose calculation, the first second of the signal was used and the background was estimated from the last 10 s.
A preheat plateau test was performed for a few samples to establish the most appropriate preheat temperature. The preheat temperatures were varied from 200°C to 300°C in 20°C steps. No systematic variation in De with preheat temperature was observed. Preheating the sample can also cause recuperation of the OSL signal (Aitken, 1998). Totest for this, a 0 Gy regenerative dose step was added into the SAR protocol (Murray and Wintle, 2000). The luminescence signal should then be zero. Any grains for which this sensitivity-corrected recuperated signal was >5% of the corresponding natural signal should be rejected, but for all measured aliquots of investigated samples, this signal was <5%.
Final equivalent dose (De) values were calculated for all samples using the central age model (CAM) (Galbraith et al., 1999) using the R ‘Luminescence’ package (Kreutzer et al., 2020). All obtained luminescence results are presented in Fig. 2, where the De distributions are presented in terms of relative probability density functions (Berger, 2010). The overdispersion parameter was calculated for each sample; these were 20% or less for all samples, so CAM was applied for final equivalent dose calculations. For an overdispersion parameter <20%, the dose distributions are usually unimodal and it can therefore be assumed that the tested material represents the well-bleached quartzes (Moska et al., 2019).
. Results
. Lithological Analysis
In all outcrops, mineral deposits were distinguished as mineral and organic sediments. Eight lithofacies were distinguished in the sections. The oldest is a mineral-organic silt with sand (FSCd) in the central part of the basin, below 1.5 m to 2.2 m depth (section I, II, IIIa, b, Fig. 2). This layer is 2.5 m thick in the centre and disappears at the edge of the basin (section IIIa). In terms of grain size, these are silty-sandy sediments, with a dominant very coarse silt (28.1%). The admixture of sandy fraction is significant (29.1%), among which very fine sand (22.2%) decidedly predominates, and the admixture of organic parts reaches only 5%. The average grain diameter (Mz) is 4.9 φ and the sorting factor (δ) is 0.0–0.7 φ. At the top, there is a large share of RM (round, mat) quartz-grain processing, reaching even 37% (sample J_11, Table 1). All documented sections exhibit significant deformations of the FSCd layer, resulting from a secondary mixing of silt and sand, originally with horizontal stratification.
Overlying deposits contain much organic matter (Cd), resembling a peaty gyttja; the average content of organic matter is 75.9%. It lies below 1.6–2.0 m depth in the central part of the basin and is 0.2–0.4 m thick (sections I, III). In a marginal part of the basin, the layer disappears at about 1.5 m depth (section III, Fig. 2). This layer has strong post-sedimentary deformations and is intersected by mineral-organic silt with sand (FSCd), as well as contains fissures filled with sand (wedge structures) of a sandy lithofacies (SCd), with admixture of dispersed organic matter and broken fragments of the underlying peaty gyttja.
The sand is well or moderately well sorted with a high share of RM (round, mat) grains in quartz-grain processing, from 38% to 52% (J_8, J_12, J_17, Table 1). The sandy lithofacies (SCd) was documented only in fissure structures, open at the top of the organic lithofacies. The top part of the fissure structures is disturbed with the overlying layer and the boundary of these two lithofacies cannot be captured.
The overlying layer is composed of vari-grained sediments and varied thicknesses (sections I, II, IIIa). It is composed of sand with gravel (SGm) including coarse- and vari-grained sand, mostly with an admixture of gravel to a 45% or admixture of fines (3.8–15.7%). These deposits are massive and poorly or very poorly sorted (SD = 1.5–3.1 φ), but if a fine material predominates, the sorting is 1.1–1.4 φ. Quartz-grain processing indicated a predominance of aeolian grains (RM = 35–49%) with a low share of shiny grains (EL), cracked (C) and non-processed grains (C + NU) (Table 1).
In the central part of the basin, the overlying deposits are the lacustrine sediments. They do not form a continuous layer, but they fill small basins at the top of the SGm lithofacies. Deformations of these deposits may result from the uneven subsidence of the basin's infilling. It is composed of sand and silt, with horizontal alternating laminae (Sh(d)). The laminae are not deformed, but the whole series is co-shaped to a basin formed at the top of the underlying deposits (sections I, IIIa, Fig. 2). Laminae of coarse silt and fine and medium-grained sand prevails. The content of aeolian grains (RM) is varied, with most samples exhibiting a large share of them, especially in the poorly sorted layers composed of fine sand and silt. These deposits also contain a large share of mediate (M) and cracked grains (C) (J_1, J_19, Table 1).
The top layer at the marginal zone of the basin is composed of sediments comprising fine-grained sand with an admixture of silt (S(F)m) and, in the central part of the basin, silt with an admixture of sand (FSm). These deposits are massive but deformed, presumably resulting from soil processes (sections I, II, III, IV, V, Fig. 2). The quartz grains at the bottom of the layer contain strongly aeolized material, with the RM content up to 46.6%; in the upper part, it decreases to 34–38%. The sum of cracked and untreated grains remains above 20% (J_23, J_24, J_25).
The youngest OSL dated deposits were sands (S [structure unknown]) documented on the very southern edge of the basin (Fig. 2) where they occurred in the fissure infilling which, unfortunately, could not be traced as it was removed by the excavator. This deposit contained abundant aeolian grains (RM), up to 45%.
. Geochronology
The luminescence dating (OSL) helped to establish a geochronology of deposits. The 25 samples tested indicate the age from 76.1 ± 3.8 ka to 7.6 ± 0.5 ka (Table 3). Unfortunately, deposits were subjected to post-sedimentary disturbances (Fig. 2) and it did not allow to construct of the age-depth model. All important data for the investigated luminescence samples are presented in the Table 3. The results of dating of specific lithofacies with diagrams of relative probability density functions for equivalent dose distribution are presented in Table 4.
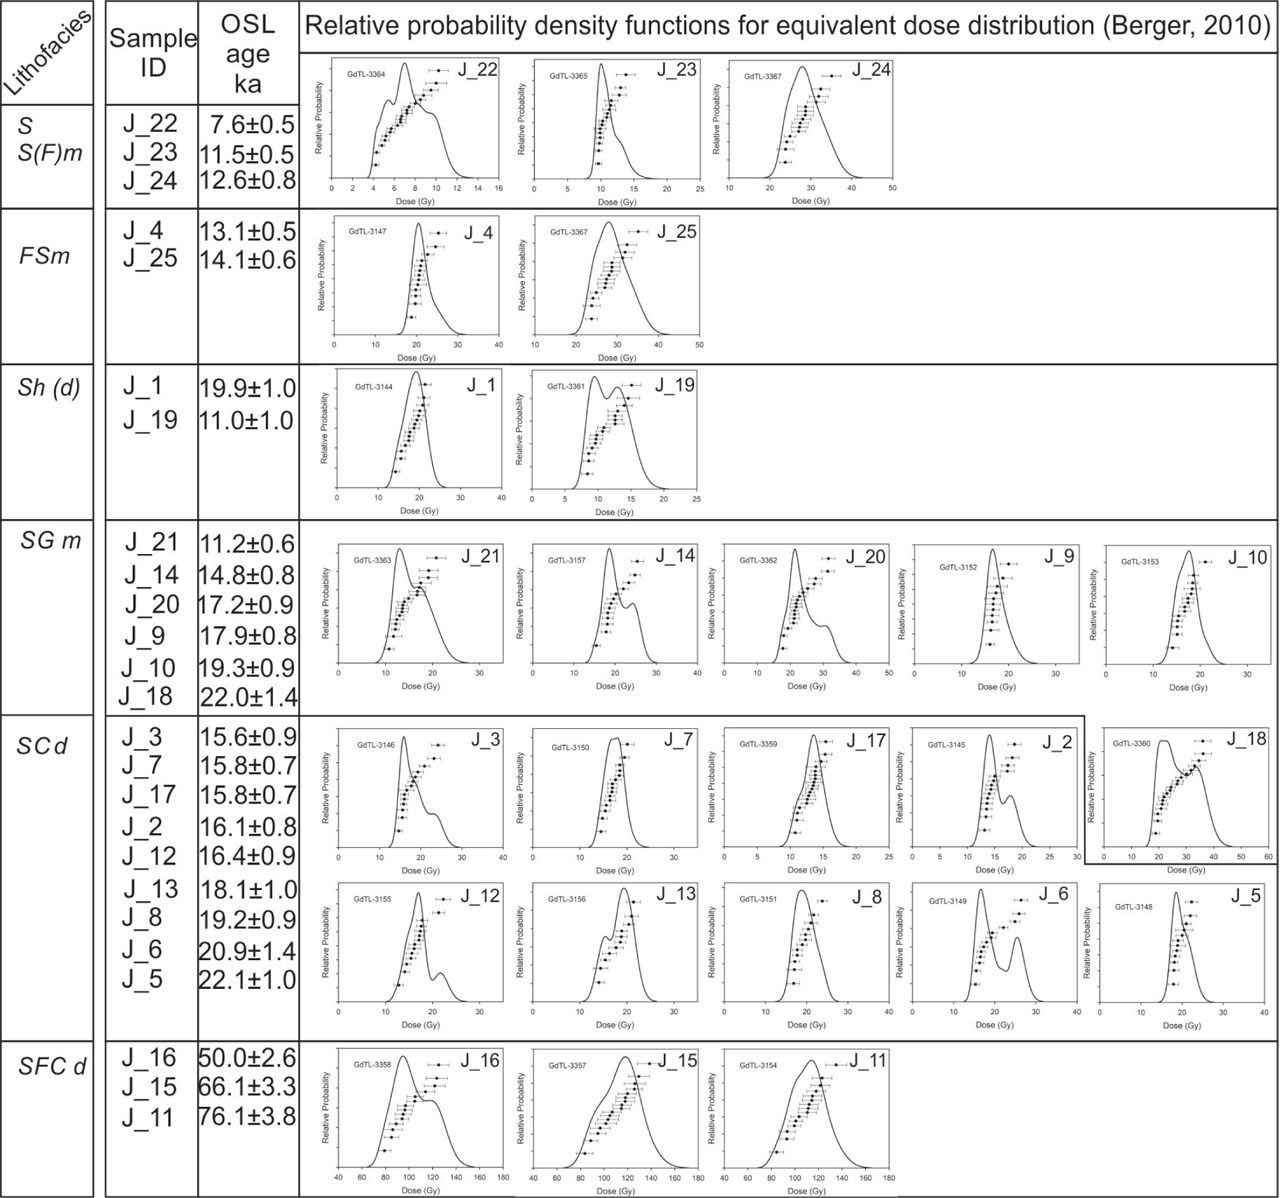
Table 4.
Luminescence dating (OSL) results for documented lithofacies, with relative probability density functions for equivalent dose distribution (Berger, 2010).
. Discussion
In the Polish Lowland, there are many fossil basins filled with biogenic deposits and mineral coverings which reflect their age and origin (e.g., Klatkowa, 1989, 1990, 1996; Majecka et al., 2019). Generally, deposits from closed catchments in central Poland are the source of the most complete information about the climate in the Late Pleistocene. Based on the results, a lithostratigraphic subdivision of the Vistulian deposit sequence at the Józefów site was made. Our luminescence dating of mineral deposits provides a geochronology of the events (Fig. 3).
Fig 3.
Lithostratigraphical scheme of the Vistulian deposits at the Józefów site with OSL age results in relationship to the Vistulian climatostratigraphy. OSL, optically stimulated luminescence.
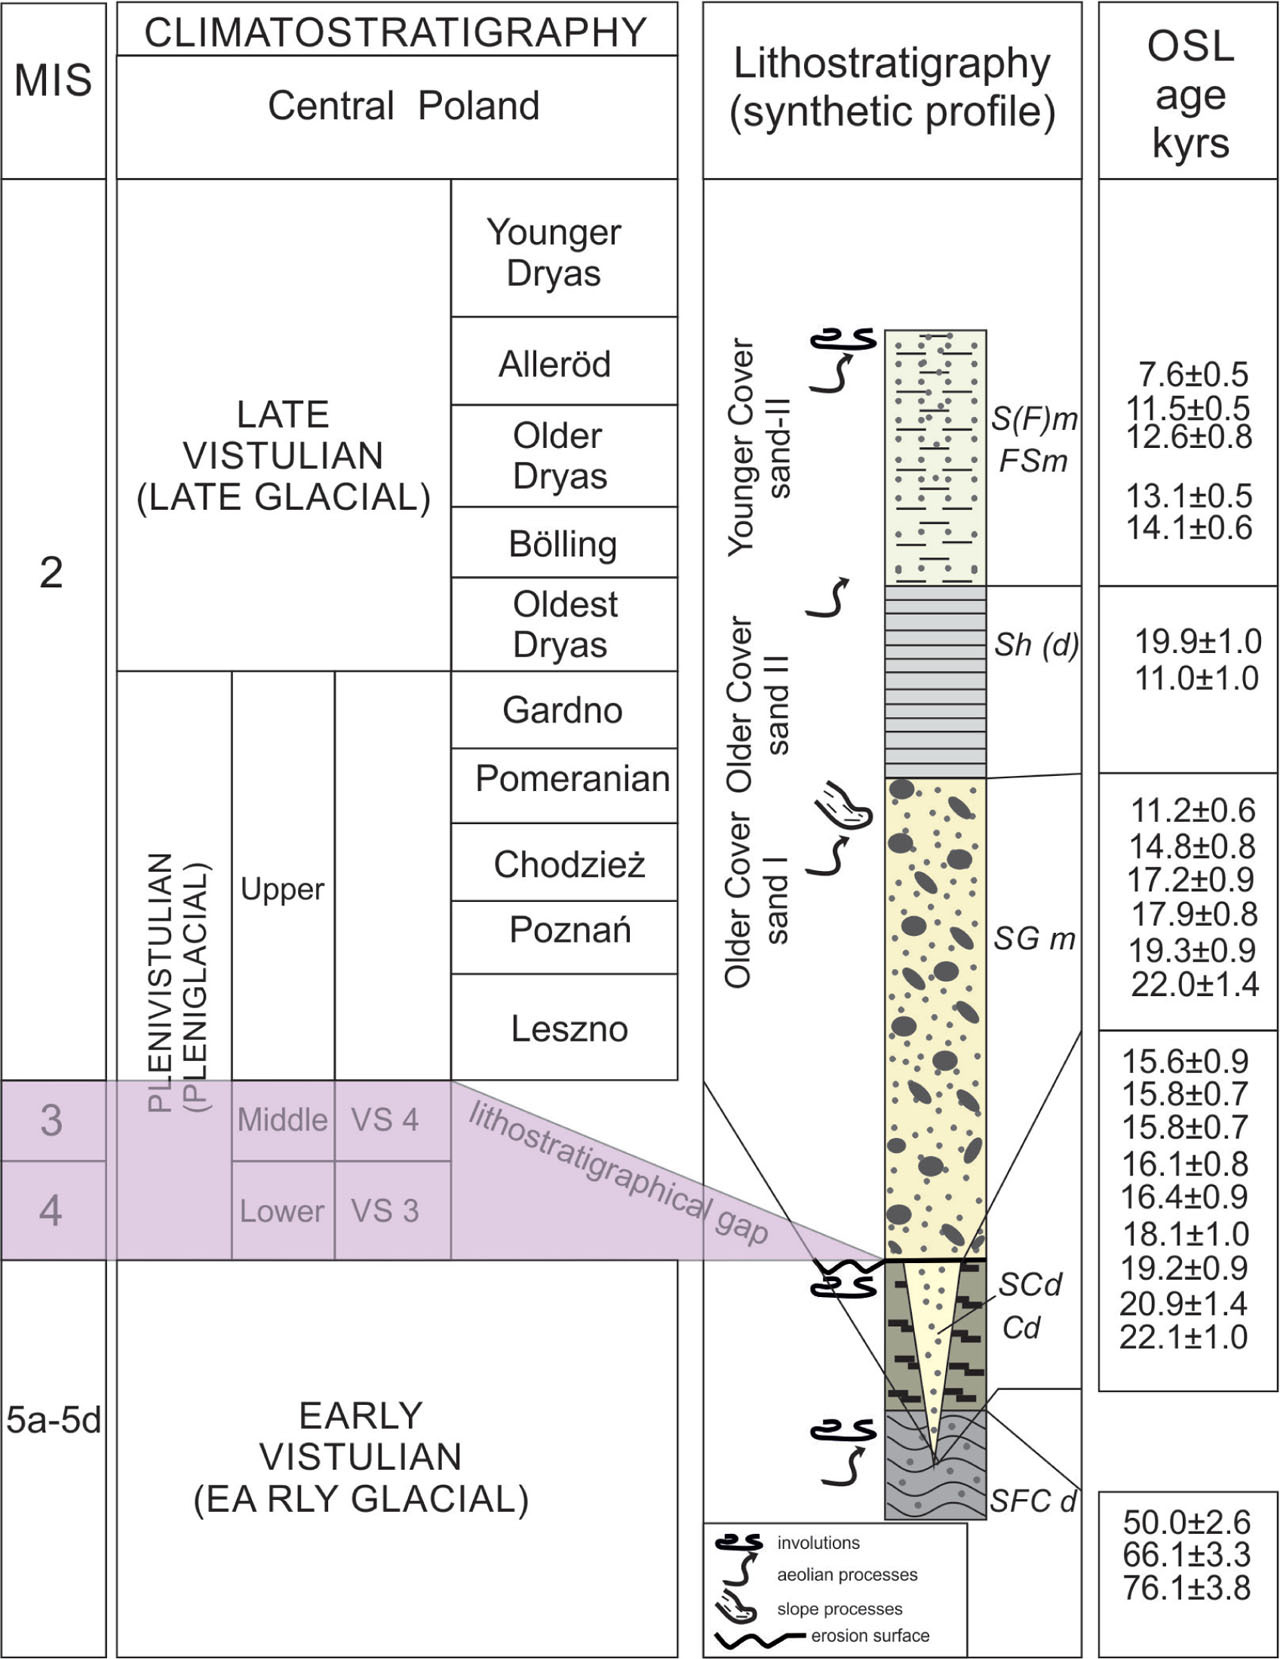
The oldest lithofacies FSCd, dated at 50.0–76.1 ka (GdTL-3358, GdTL-3357, GdTL-3154, Table 2) corresponds to the period from Early Vistulian to the Middle Plenivistulian (Helmens, 2014; Marks et al., 2016). In regional studies, such a series of sand with silt and organic material is correlated with the Early Vistulian (Klatkowa, 1990, 1996). These results seem too young, but this may be due to their rejuvenation due to cryoturbation of sediments. Significant enrichment of the top part with aeolized mineral deposits proves the occurrence of aeolian processes in a cold climate during stadials of the Early Vistulian. Based on the OSL dating of this series, the overlying organic layer (Cd) could have been deposited during the Early Vistulian or the Middle Pleniglacial. The first option is more probable since sites with fossil soils and biogenic sediments with pleniglacial flora are generally rare in central Poland (Mamakowa, 1989; Tobolski, 1991; Balwierz, 1996; Granoszewski, 2003). There is a stratigraphic gap in central Poland covering the older part of the Plenivistulian, e.g. in the sediments of the north-western Uniejów Basin (Petera, 2002) or in valleys and closed depressions in the Łódź Upland (e.g., Klatkowa, 1996).
On the assumption that the Cd lithofacies was deposited at the end of the Early Vistulian (MIS 5a) and the SCd and SGm lithofacies were deposited in MIS 2, as indicated by OSL dating, a period of about forty to fifty thousand years correlates with MIS 4 and 3 (Helmens, 2014; Marks et al., 2016) but not represented by any deposits in the Józefów basin, similarly as in other closed depressions in central Poland (Klatkowa, 1996, 1989; Majecka et al., 2019).
The accumulation of the SGm lithofacies at the Józefów site is associated with permafrost and the deposition of gelifluctional sediments flowing down on a thawing active layer. This series is enriched with aeolian sand and it could have been blown directly into the basin or deposited on slopes and then incorporated into gelifluction deposits. The OSL ages of 17.2–22.0 ka (Table 4) indicate that these deposits formed concurrently with the Leszno Phase (Marks, 2012). At this time, fluvial and aeolian processes developed intensively in a periglacial cold climate in the extraglacial part of the European Lowland (Huijzer and Isarin, 1997; Vandenberghe et al., 1998). The development of the Józefów basin was probably not related to fluvial processes, but certainly with aeolian and slope processes. Furthermore, a scheme of cover sand was adopted, based on the type of material and its relation to biogenic sediments and palaeosoils for the European aeolian sandy formations (Maarleveld, 1960). This scheme is referred to based on OSL dating. The Older Cover-sand I is OSL dated at 15.4–25.2 ka, but mostly at 20–22 ka in the Netherlands (Bateman and van Huissteden, 1999). The lithofacies SGm can therefore be correlated time-wise with this level and its deformations may have arisen during the flow of successive gelifluction lobes into the basin that were then transformed by thermokarst processes (Fig. 2). The two datings indicate clearly an earlier period than the others, but the correctness of the result may be a subject to secondary rejuvenation through possible bioturbations at the site caused by the presence of burrow-forming animals like moles, foxes or badgers during the Holocene. These results were obtained from the top of the SGm series, which could have been subjected to post-depositional displacement closer to a topographic surface, even before the FSm lithofacies, and thus also exposed to rejuvenation due to exposure to daylight.
SCd lithofacies filling a fissure forms different structures which were also very important to determine the periglacial events and their age. We did not find convincing evidence that they could belong to a polygonal system and so they are probably dilatation cracks formed due to the growth of a frost mound, the existence of which was proven earlier (Dylik, 1967). The infillings contain both well-sorted sand with abundant aeolian quartz grains and material from the SGm lithofacies that flowed into cracks from the immediate vicinity. Luminescence ages (Lab. Code: GdTL-3145, GdTL-3146, GdTL-3148, GdTL-3149, GdTL-3150, GdTL-3151, GdTL-3152, GdTL-3155, GdTL-3359) are dispersed from 15.6 ka to 22.1 ka (Tables 2 and 4; Fig. 2), but samples with a large amount of aeolian material are dated to about 22.0 ± 1.4 ka (J_18, Table 1 and Fig. 2) and 14.8 ± 0.8 (J-14, Table 1 and Fig. 2), which may indicate the time of the most harsh conditions and the development of the cracks.
The SCd lithofacies were deposited slightly earlier or synchronously with the deposition of the SGm series, and the gap fillings (dilatation or contraction structures) included both wind-provided material, which confirms a large share of RM grains or material from the immediate surroundings, which could have already constituted the lithofacies SGm. The latest results may indicate the rejuvenation of the sediments, but a certain biphasic nature in the formation of the cracks and their filling cannot be ruled out.
Typically, ice-wedge structures or sand wedges have often been described in the Vistulian deposits (Kolstrup, 1986; Kasse and Vandenberghe, 1998; Murton et al., 2000; Petera, 2002; French, 2007). Sand-filled wedges and patterned grounds are often OSL dated from the Late Saalian through the Middle Vistulian, but the majority of structures are dated from 22 ka to 14 ka (Briant et al., 2004; Murton and Bateman, 2007; Buylaert et al., 2009). Such a large time interval of changing climatic conditions makes it impossible to indicate precisely the exact event of wedge formation. The thermokarst and collapse of deposits laid down on ice were initiated by warming. In the case of the Last Glacial Maximum (LGM) ice sheet, this may have been either an interphase after the Leszno Phase dated at 24 ka or after the Poznań Phase at 19.0 ka (Marks, 2012) when the warming became more pronounced (Dzieduszyńska and Forysiak, 2019). The significance of the warming after 16.6 ka for thermokarst development is accentuated (Van Vliet-Lanoë et al., 2019) and it can be correlated with the ice sheet retreat after the Pomeranian Phase (Marks, 2012). Therefore, varied OSL ages for the fillings of thermal contraction structures could be reasonably expected (Fig. 2).
The lithological features of the lithofacies Sh(d) indicate their deposition in small, water-filled basins and that they come from washing of fine material, but the significant share of aeolian sand grains suggests cold climate conditions. The OSL ages are too divergent (11.0–19.9 ka) so it is difficult to specify accurately the time of deposition (Table 3 and Fig. 3). In areas with aeolian and fluvio-aeolian deposition in a similar stratigraphic setting, there is the Older Cover-sand II (Kasse et al., 2007). According to Bateman (2008), this layer was formed at 13.2–17.6 ka, with most ages grouped around 15 ka, which is in the Oldest Dryas (Vandenberghe et al., 1998; Ammann et al., 2013). The emergence of post-depositional deformations could be associated with the final thawing of buried ice during the warming at the end of the Oldest Dryas and in the Bölling. Such situations were documented in buried depressions of central Poland, where a segregation ice melting occurred, followed by a quick collapse of deposits during the Late Vistulian (Goździk and Konecka-Betley, 1992).
The upper lithofacies FSm, lying in the central part of the basin, and the slope lithofacies S(F)m are characterised by abundant RM grains. Two OSL ages indicate 13.1–14.1 ka (GdTL-3147, GdTL-3367) for sandy silt, which correspond to the Bölling–Alleröd and 11.5–12.6 ka (GdTL-3365, GdTL-3366, Table 3) for sandy slope deposits, which allows these sediments to be associated with the cold climate of the Younger Dryas (Vandenberghe et al., 2004; Dzieduszyńska and Forysiak, 2019). During this last cold period of the Vistulian, a discontinuous permafrost may also have been reactivated in north-western and central Europe (Petera-Zganiacz and Dzieduszyńska, 2017). In the European Lowland, deposition of aeolian sediments terminates with the Younger Cover-sand II. The fissure structure documented in section IVb on the southern slope of the basin is filled with well-sorted sand with a large proportion of RM-type quartz grains. Its age of 7.6 ± 0.5 ka (J-22, Table 3 and Fig. 2) is, like its origin, difficult to interpret because it corresponds with the Atlantic Period of the Holocene. It is possible that this is the sediment that filled the fissure, as a result of slope processes, immediately after its formation. Currently, the origin of this fissure cannot be explained. The age of 7.6 ka is highly underestimated and it is difficult to accept it from the paleogeographical point of view. This underestimation can be justified by possible bioturbations in this series.
Despite significant differences in the dating of samples collected from the same series, it seems that the OSL results confirm the temporal distribution of the depositions of successive lithofacies. It should be emphasised that dynamics of post-depositional disturbances were very high in the studied formations, so the precise matching of material packages to subsequent lithofacies has become problematic. Despite this high variability of structures, the lithostratigraphic arrangement of the series is generally confirmed by the OSL dating, which shows that, despite the high variability of sediments and the presence of post-sedimentary deformations, it is possible to reconstruct the age and sequence of events recorded in the sediments at Józefów.
. Conclusions
The site at Józefów is very important for the regional stratigraphy of the Vistulian in the European Lowland, mainly due to the well-documented depositional succession of mineral deposits and their chronology. First of all, the depositional processes are dated here, so it supports the paleoclimatic considerations for the Vistulian. This is a period with vast climatical diversification and so difficult to unambiguously define due to different proxies obtained from different sedimentary environments. These are mostly environments that bear the hallmarks of periglacial processes, i.e. certain post-sedimentary disturbances. Therefore, another well-documented site is very important here to determine a complementary set of climatic conditions for the region.
The sequence of sediments begins with lacustrine sediments deposited during the Early Vistulian with traces of cool intervals recorded in aeolian material delivery to the basin. The deformation structures are a record of cryogenic processes in cold climate conditions. A lack of deposits corresponds to MIS 4 and 3 and may indicate that erosion processes dominated here, but they have not been recorded in the sediments.
The accumulation of the gelifluction sandy-gravel series enriched with aeolian sand is associated with flowing down a thawed active layer in permafrost conditions during the LGM (Fig. 3). During the harshest climatic conditions, fissures developed and were successively filled with the inflowing gelifluction material, a thickness of which was getting increased as the supply of aeolian material increased in the cooling intervals (Fig. 3). During a degradation of the ice lens, small but numerous depressions were formed in the already buried basin, in which the sandy-silt deposit was probably the cause of their collapse and the deformation of the older series lying below. It is difficult to date unambiguously these processes as they were associated with increased humidity and thus degradation of permafrost, but the content of aeolian material indicates still there are intensive aeolian processes in the region. The top series filling the depression proves that strong aeolian processes occurred in the region during the final phase of the Visulian (Older Dryas, Younger Dryas).
Such a sedimentary record is a testimony to the thermal conditions of the Vistulian in the extraglacial zone of the Vistulian ice sheet. The gaps in the sedimentary record of the Lower and Middle Plenivistulian are specific to the region and also reflect the nature of the conditions and processes at that time.
The presented results were obtained with the support of the Polish National Science Centre, contract number: DEC-2014/15/B/ST10/03809.