
. Introduction
The usable doses measurement of equivalent dose impacts significantly on the ESR dating method accuracy and reliability. The optical bleaching characteristics of the ESR signals in sedimentary quartz is the key to acquire accurate equivalent dose. Pioneering studies demonstrated that the Al centre and multiple Ti centres can be bleached to a steady residual condition or to zero. Hence, both of the two centres are suitable for ESR dosimetry (Yokoyama et al., 1985; Toyoda et al., 2000; Voinchet et al., 2003; Tissoux et al., 2007; Rink, 1997; Rink et al., 2007; Liu et al., 2010; Duval et al., 2017). Jin et al. (1993) found that the ionizing radiation-induced E1’ centre’s ESR signal intensities of the samples collected either in loess or in faults were not erased by exposure to sunlight and other artificial light sources, but the radiation-induced E1’ signals of quartz from loess increased after exposure to sunlight and an ultraviolet lamp. Thus, the bleaching characteristics of the signal intensity of E1’ centre (g = 2.0005) showing an obvious increase of ESR intensities within 120 h light exposure, then a slow increase between 120 and 400 h and bleaching curves showing a tendency towards saturation after 400 h, makes it controversial for ESR dating (Zhao et al., 1991; Jin et al., 1991). Falgueres et al. (1994) studying the thermal annealing and dose response of the E1’ signals in a variety of rocks and heating sediments showed that while the E1’ centre is absent in the natural sample and does not appear in the irradiated sample when the initial heating was higher than 550°C. The E1’ centre appears after irradiation when the initial heating is between 400 and 550°C. Toyoda et al. (2000) reported a rapid increase of the intensity of the E1’ centre within the first 72 hours, then followed by a slow increase between 72 h and 200 h, and a decrease afterwards. They concluded that the formation and decay of the E1’ centre is closely related to its precursor (refer to diamagnetic oxygen vacancies), therefore, this signal would be ineffective for ESR dating (Toyoda and Hattori, 2000). This research showed the increase of E1’ ESR signal with different optical bleaching conditions, but did not investigate it after 350 h of artificial sunlight bleaching. Therefore, the availability of the E1’ centre for ESR dosimetry remains unclear.
Recently, the E1’ centre in quartz has been found to be useful for fingerprinting sources of sediments (Ono et al., 1998; Attanasio et al., 2000; Toyoda and Naruse, 2002; Crook et al., 2002). The heat-treated E1’ centre, refers to that the ESR intensity of the E1’ centre firstly with gamma ray irradiation to more than 200 Gy, and then heated at 300°C for 15 minutes, was proposed by Toyoda and Ikeya (1991). They hold the opinion that the ESR signal intensity of the heat-treated E1’ centre is proportional to the age of quartz from older host rocks, hence, for the sediments provenance tracing with different host rock formation ages (Ono et al., 1998; Toyoda and Hattori, 2000; Toyoda and Naruse, 2002; Sun et al., 2007). After that, the heat-treated E1’ centre analyses together with crystallinity index have been the most successful methods applied to quartz provenance studies (Nagashima et al., 2007, 2011; Sun et al., 2007, 2008, 2013; Toyoda, 2011; Yamamoto et al., 2013; Shimada et al., 2013; Toyoda et al., 2015). Wei et al. (2017) reported that natural signal intensities of quartz E1’ centre have significant dependence on lithology, both in bedrocks and in deposits, and natural signal intensities of quartz E1’ centre can reflect the mixture ratio of deposits with different types of source bedrocks. Thus, the nature E1’ centre has a potential use in sediment provenance tracing. But it is worth noting that the changeable characteristics of nature E1’ centre of the quartz in sediments after different transportat distance remains inscrutable.
The factors affecting the E1’ signal intensity variation mainly include faulting stress, heating effects and light bleaching. Fukuchi (1992) reported that the E1’ centre can be completely reset by faulting stress. Toyoda and Schwarcz (1997) showed that the E1’ centre signal increased up to 300°C on heating and then decreased to disappear at 500°C. The sunlight bleaching characteristics of the E1’ centre is also known to increase and then decrease. Jani et al. (1983) attributed the increase to an electron process in which a hole is released from a hole centre such as the Al centre and transferred to a diamagnetic oxygen vacancy to recombine with one of the pairs of oxygen vacancies. Toyoda et al. (2000) proposed that the E1’ centre itself decays with exposure to light after the mentioned electronic process ceases. Then, Toyoda and Hattori (2000) confirmed that the formation and decay of the E1’ centre are closely related with the precursor, the diamagnetic oxygen vacancies, therefore, it cannot be used for the purpose of dating. Furthermore, they also noticed that the signal of the E1’ centre was not zeroed after two weeks. However, they were not able to investigate the E1’ centre bleaching characteristics after 350 h of artificial sunlight bleaching.
In this study, we collected one bedrock sample, one current fluvial sediment sample and one Holocene sediment sample to investigate the optical bleaching characteristics of quartz E1’ centre up to 900 h of artificial sunlight exposure, in order to discuss the potential use of quartz E1’ centre for sediment dating and provenance tracing.
. Experimental methods
Study area and sampling
The study area lies on the southeast margin of the Tibetan Plateau which resulted from the collision of the India and Eurasia continental plates. The sampling sites are located on the middle reaches of the Dadu River between 3500 ~ 5000 m above sea level (Yang et al., 2009), Fig. 1a). Three samples coded MN05 (bedrock), MN06 (current river sediment) and DTZG03 (Holocene sediment) were collected from small river drainage basin that composed of granitic bedrock, Fig. 1b). Bedrock type of the three sediment samples were S type granite (Chappell and White, 1992; Chappell, 1999). MN05 and MN06 originate from Mian’ning River drainage, whose bedrock formed about 113 Ma ago. DTZG03, whose bedrock dates to about 821 Ma, was derived from the Diaotengzigou River (age data of the three samples are from China Intrusive Rock Isotope Age determined by K-Ar dating method). This mountainous relief region, subject to a strong soil erosion, has a high sediment production, probably the highest of the Tibetan plateau, is the ideal place for studying the sediment source and deposition history. The granitic bedrock sample (MN05) was taken out of the bedrock with rock crusher while the current river sediment sample (MN06) was collected from the surficial deposits of the floodplain. The Holocene sediment (DTZG03) was extracted at 0.7 m beneath the surficial deposits within Diaotengzigou river drainage. Table 1 lists sample information.
Fig. 1
Sketch map showing study area, sampling sites as well as geomorphological and geological setting of sampling sites. a) Study area located on eastern Tibet Plateau and its geomorphological map; b) geological setting and sampling site of Mian’ning River and Diao’tengzi River. Due to that the Mian’ning River is too small to be marked on the map, we represent both of the two sampling sites as one spot in Fig. 1b). The bedrock age data came from China Intrusive Rock Isotope Age Figure by K-Ar dating method.
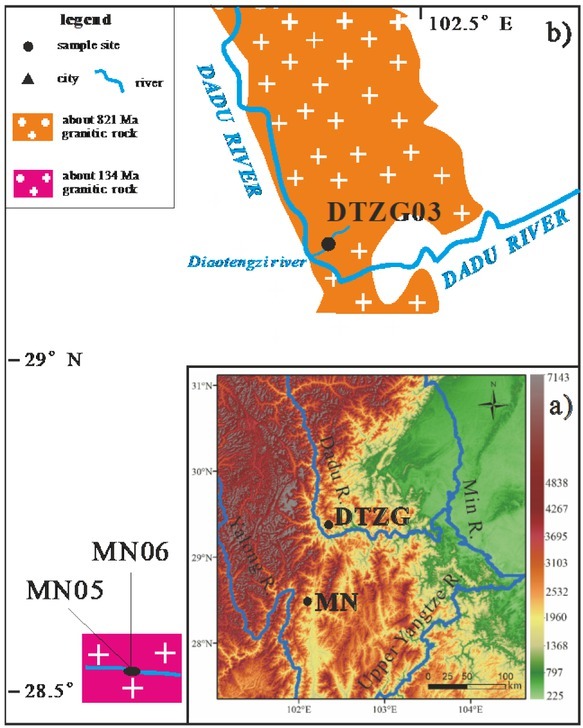
Table 1
List of sample information used in this study. All samples were collected from the southeast margin of the Tibet Plateau, which is located in the junction between the first and second ladder of China terrain. The quartz extracted from bedrock (MN05) was sampled 10 mm beneath its surface; DTZG03 was sampled at 0.7 m beneath the surface deposits; MN06 was collected from the modern floodplain. MN05 and MN06 were collected from the same river drainage with unitary lithology of granite.
Sample preparation
The whole block bedrock sample (MN05) was firstly grinded with an iron rod and iron mortar, and then fractioned to100–200 μm by hand sieving in order to eliminate the grain-size effect and to retain the bedrock’s original information. The size fraction of 100–200 μm of the two sediment sample (MN06 and DTZG03) was separated by wet sieving. After that, three samples were treated with 30% H2O2 for one day for organic material removal then with 40% HCl for another day to remove carbonates. They were then washed and cleaned with distilled water. Magnetic minerals were removed by magnetic selection. Sodium polytungstate was used to separate the minerals of the density ranging between 2.57 and 2.73 g/cm3, then they were etched in 40% HF for 40 min to remove feldspars and the part of grains affected by alpha particles. Subsequently HCl was used again to remove the fluorides created by the HF etching. Finally, all samples were rinsed in distilled water to neutralize the acid and dried at 40°C to obtain pure quartz grains.
Bleaching experiment
All pure quartz samples acquired from above methods started optical bleaching without addition of any artificial irradiation. Each sample was deposited in a clear plastic dish with 10 cm diameter. The quartz mineral particles were evenly dispersed on dishes as a monolayer. The dishes were placed into a 43 cm × 43 cm × 60 cm SOL 2/500S simulator made by Hönle, Germany. Its operating parameters are as follows: the intensity of light is 120,000 lux and 910 W/m2; light spectrum (UVA+VIS+IR) between 320 nm to 3.000 nm and its illumination intensity was 6.5 times higher than outdoor nature light (more detailed information on www.hoenle.de). All dishes were placed 30 cm below the light, and the temperature was kept lower than 30°C. The samples were exposed to the illuminator continuously up to 900 h. In order to make a more clearly and high-resolution bleaching pattern, each sample has been divided into 22 aliquots for the bleaching experiment. The details of the bleaching duration of each measured point are listed in Table 2.
Irradiation experiment
After 900 h exposed to artificial sunlight, another 13 aliquots of each sample were prepared for irradiation experiments. The added gamma dose are 100, 200, 400, 800, 1200, 1600, 2000, 2500, 3000, 4000, 5000, 6000, 7000 Gy, respectively, by gamma ray irradiation. The irradiation experiment was carried out in the 60Co laboratory of Peking University, with a dose rate of 42.25 Gy/min.
ESR measurements
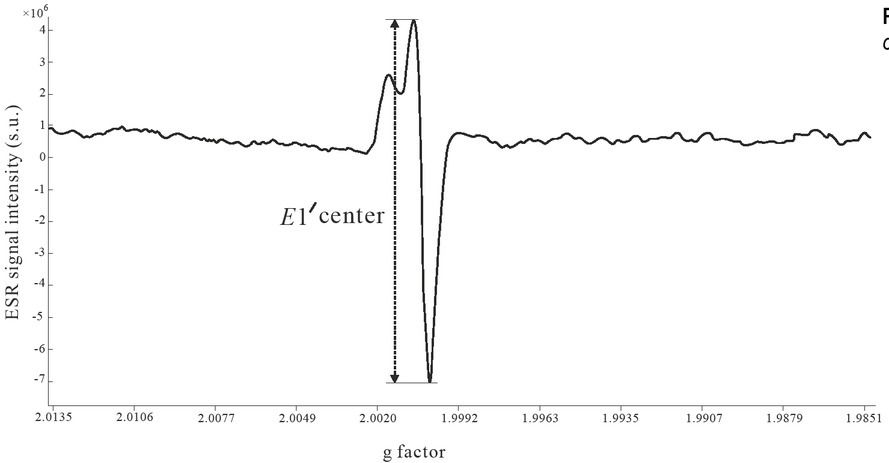
The ESR signal of the E1’ centre of all natural, bleached and irradiated samples were measured with an X-band Bruker EMX spectrometer at the State Key Laboratory of Earthquake Dynamics, Institution of Geology, China Earthquake Administration. Fig. 2 shows the typical spectrum of the study. The E1’ centre measurements were performed at room temperature with a microwave power of 0.01 mW (Toyoda and Hattori, 2000; Toyoda et al., 2000), and each aliquot was measured six times to estimate the angular dependence after rotating of 60°, to obtain the average quartz E1’ centre ESR intensity. The ESR signal intensities of all samples were normalized by the sample weight and receiver gain.
. Results and analysis
The three samples were bleached up to 900 h, and the ESR intensities of the E1’ centre were plotted as a function of bleaching duration in Fig. 3. The general bleaching results show that the E1’ signal of all the samples exhibit a rapid increase at first 16 h, reaches its maximum intensity between 32 h and 230 h, then slowly decreases to reach a stable intensity after 400 h at a level about 2.5 times of its natural. These results are in agreement with previous studies (Zhao et al., 1991; Jin et al., 1991, 1993; Toyoda et al., 2000) which demonstrated that the intensity of the E1’ centre, after sunlight exposure, increases at beginning, and then decreases. But we newly found that the optical E1’ centre intensity is always higher than the nature E1’ centre intensity. In addition, the optical E1’ centre intensity tend to exhibit a steady increase tendency after enough exposition to light.
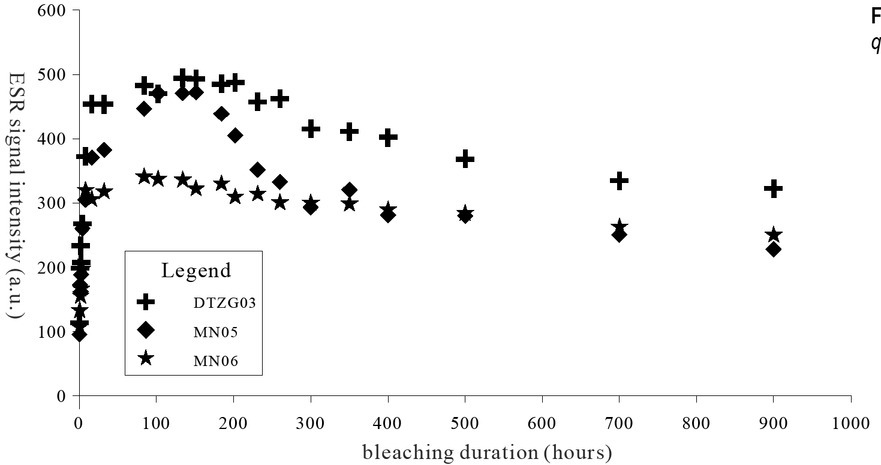
MN05 collected from bedrock, being exposed to light, exhibits a rapid growth within the first 120 h, then a rapid decrease (between 120 h and 300 h) and then a slower decrease after 300 h. However, MN06 collected from the same bedrock drainage does not show the same bleaching curve of MN05. In fact, Fig. 3 also shows that MN06 firstly exhibit a rapid growth, and then with a slow decline tendency; meanwhile, the maximum signal intensity of MNO6 seems steady, which is more similar to the DTZG03 bleaching curve. This is probably based on the hypothesis that MN06 and DTZG03 are both derived from sediment. In addition, the two sediment samples (DTZG03 and MN06) also show a difference maximum signal intensity value with a different provenance, especially DTZG03 had the highest natural E1’ centre ESR intensity of 144 a.u. while MN06 had the lowest value of 96 a.u. This seems to illustrate that the E1’ signal optical bleaching curve depends partly on the origin of quartz, and different quartz storing environment and natural sunlight exposure time generated different electron transfer history.
Fig. 4
The E1’ signal intensity change level (%) with different light exposure time. The increase level of the E1’ centre is the ratio between increase value of its natural intensity. All sample nature E1’ centre ESR signal intensity are of numerical normalized as 1 (100%). After 400 h, the E1’ centre of three samples show a relatively steady increasing level with a range of 235 ~ 270%, about 2.5 times of its nature.
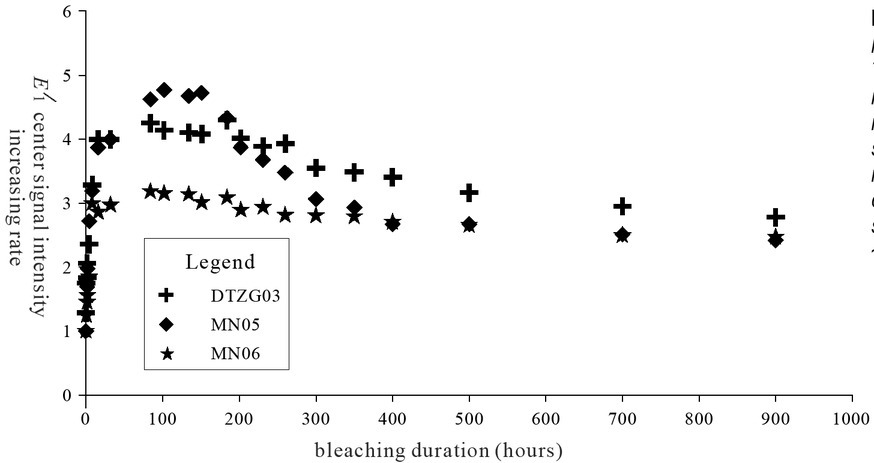
In addition, the statistical data are normalized according to the original natural intensity to efficiently address the numerical increased level of the three samples with different light bleaching time, as shown in Fig. 4. Each measured point’s intensity was normalized according to the sample weight and the receiver gain. The natural intensity (0 h bleaching duration) was regarded as 1, and the signal increasing level of other measured points data were calculated by relating the signal intensity of each measured point to natural intensity. DTZG03 and MN05exhibit a relatively higher increasing rate than MN06. The origin of DTZG03 (the historical fluvial sediment) explain that it has received more environmental dose and more sunlight exposure compared to MN06 (the modern fluvial sediment), and thus that the signal intensity of DTZG03 is higher than that of MN06. However, the result also shows that the signal intensity of bedrock
sample (MN05) is also higher than that of relevant sediment sample (MN06), which received more sunlight exposure. This result is inconsistent with the fact that sediment sample should show a higher signal intensity with more sunlight exposure than that of bedrock sample. So far, we could not provide a reasonable explanation for the phenomena. This may be caused by variable sunlight optical sensitivity that needs to be certified by future research. Moreover, after 400 h, the numerical gap narrows with longer time exposition to sunlight, and the E1’ centre of the three samples show a similar increase level with a range of 235 ~ 310%, about 2.5 times of its natural level.
. Discussions
No new application for ESR dating
Based on our results, the quantitative change of the quartz ESR intensity of the E1’ centre by solar light in a long time scale, firstly rapid increases, then decreases and finally reaches a relative constant level was firstly reported. Previous studies demonstrated that the Al centre can be bleached to a steady residual, and an accurate ESR dating result could be acquired by unbleachable component of Al centre deduction (Yokoyama et al., 1985; Toyoda et al., 2000; Voinchet et al., 2003; Duval et al., 2017). However, unlike the Al centre, no new useful indication on the possible use of the E1’ centre for ESR dating exists. On the one hand, the results failed to assess how the sensitivity of the E1’ centre changes according to the bleaching (transport) – irradiation (deposit) cycle, then failed to establish the start level of the clock. This is because that when we take a historical or current fluvial sediment sample, though we could get its bleaching pattern after indoor artificial sunlight bleaching, we still do not know how many transport-deposit cycles have the sample experienced, then we could not make an accurate deduction of signal intensity increasing rate and fail to establish the start level of the ESR dating clock. Thus, an assumption on the use of the E1’ centre for ESR dating was not proposed.
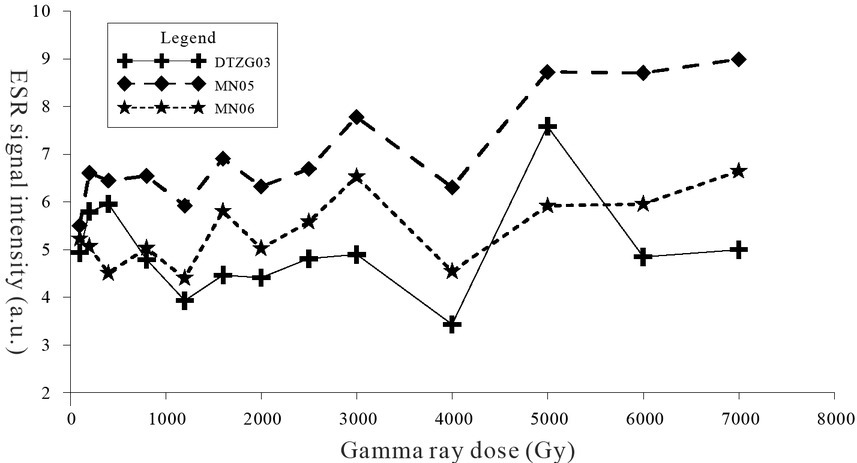
On the other hand, the basis of paramagnetic centres for ESR dating are that they are well reduced, their values can be brought to zero or brought to a steady residual level before deposition, and after that the grains will receive natural radiation. In case of the Al centre, the signal intensity increases with dose from this “bleached residual” level, therefore, dating is possible when this starting level is estimated. This study has shown that there was also such a “starting” level of the E1’ centre. In this case, if the signal intensity of the E1’ centre increases with additional dose, then, the E1’ centre is useful for dating; and if not, the E1’ centre is not useful. Thus, it also needs to detect the correlation between irradiated sample’s additional dose rate and its E1’centre ESR signal intensity. Fig. 5 shows that the E1’ centre ESR signal intensity of three samples change with dose irregularly after irradiated with different gamma ray dose rate. From this point, therefore, potential use for ESR dating of the E1’ centre after a long time sunlight bleaching seems also unlikely.
Potential use for sediment provenance tracing
Toyoda and Hattori (2000) proposed that the heat-treated E1’ centre, which has been posited to correspond to the number of oxygen vacancies in quartz and to correlate to the ages of the host granites. Wei et al. (2017) reported that the natural ESR signals of quartz E1’ centre could be used to distinguish granitic, sedimentary, or metamorphic rocks quartz minerals. Wei et al. (2017) also indicate that the natural signal intensities of quartz E1’ centre depend significantly on lithology both in bedrocks and deposits. However, the sunlight thermal stability of natural signal intensities of quartz E1’ centre is unclear in their study. Considering their proposal, we would be able to indicate that the bleaching degree of modern river sediments is a necessary factor to examine when tracing the sediments provenance.
The basic provenance tracing idea of the E1’ centre is that when quartz grains in two rivers before a junction have different ESR signal intensities, and they have another intermediate value after the junction (Toyoda et al., 2015). The contributions of the sediments from the two rivers are expressed as (x) and (1–x) as
where A and B is respectively the signal intensity of the two tributary before their junction and C is the one after junction. Based on this study observation, take a modern river sediment sample of the river, and examine the bleaching pattern. If the signal intensity increases with bleaching, the sediment should not have much sunlight exposure. While if they decrease, it indicates that they have quite well been bleached. Then, we can bleach the quartz by the artificial simulative sunlight to the “steady level”, which is a better indicator than “easily changed” indicator. This is because that compared to “easily changed” indicator, the “steady” indicator will keep the most original bedrock information with its resistance to weathering, denudation, erosion, transport and deposition processes. Thus, the “steady level” signal intensity of the E1’ centre after a long time sunlight exposure could provide a more significant clue in the sediment provenance tracing study.
This study reports that the natural signal intensities of various quartz E1’ centre can reach a steady constant level (about 2.5 times of its natural intensity) after a long time light bleaching. This result seems to demonstrate that the quartz extracted from different storing environments and origins, exhibits a small E1’ signal intensity variation after long time sunlight exposure. Therefore, the steady constant level could provide a powerful evidence for sediment provenance tracing, due to that the “steady” indicator is better than “easily changed” indicator. Certainly, as a new developed provenance indicator, more
future work needs to be done to perfect the potential use of the nature signal intensities of quartz E1’ centre in sediment provenance tracing.
. Conclusions
The response of the E1’ centre to the artificial sunlight illumination up to 900 h was investigated. The results confirmed that the signal intensity of quartz E1’ centre when exposed to sunlight increase at beginning then decrease. The E1’ centre was not zeroed but also bleached to a steady increasing level, about 2.5 times as much as the original signal intensity, after about 400 h sunlight exposure, and the quartz storing origin dependence was not apparent. Therefore, the stable increase level of the E1’ centre widely exists in various original quartz, and provides a powerful evidence for the potential use of the natural signal intensities of quartz E1’ centre in sediment provenance tracing. However, there is still no appropriate application of the E1’ centre for sediment ESR dating.