
. Introduction
The Polish loess-palaeosol sequences preserve a significant terrestrial record of the Quaternary climate change. In Poland, loess and loess-like formations occur in the southern part of the country, mostly in the south polish uplands, i.e. in the Lublin, Sandomierz, and Cracow Uplands. In addition, such deposits are found in the forelands and foothills of the Carpathians and Sudetes.
These very interesting deposits were studied by polish researchers for the last 40 years and in the past a chronostratigraphic framework for polish loess deposits has been established through geomorphological, lithological and pedostratigraphical analysis (Jersak, 1973). On the other hand, another chronology was constructed by Maruszczak (1991); it was fully based on thermoluminescence (TL) age determinations and correlated with the ice core chronology proposed by Martinson et al. (1987). Currently, it is known that the TL method may not suitable for establishing a precise chronostratigraphy of loess deposits, so the numerical time scales for loess deposits are based mainly on the optically stimulated method (OSL). OSL is particularly suitable for sediments from a wide variety of depositional environments (e.g. Murray and Olley, 2002), particularly for loess deposits (Lang et al., 2003; Antoine et al., 2009, Moska et al., 2015). These results may be compared with the results of radiocarbon dating for deposits not exceeding about 50 ka (Moska et al., 2015). Generally, OSL dating of loess sediments is applicable to a wide range of grain sizes, from fine grains (Timar et al., 2010; Kreutzer et al., 2012) to coarse grains (Moska et al., 2012; Kreutzer et al., 2012). In the past, in Poland it was possible to find many locations where the loess cover reached almost 20 m, mainly in the Lublin Upland. Nowadays the situation has changed dramatically because almost all small brickyards in which loess deposits were discovered have been closed down and the Tyszowce brickyard is the last working one in that area. This loess profile is characterized by a continuity of the cover and continuity of sedimentation, which are the foundations for building a loess stratigraphy and enabling correlation with other European loess deposits, e.g. in Ukraine and Western Europe.
The aim of the current study is to establish a detailed OSL chronostratigraphy of the investigated profile to enable future comparison with those that will be available for other investigated loess profiles from Poland (Złota – Moska et al., 2015; Biały Kościół – Moska et al., 2012; and Strzyżów – in preparation). The reconstruction of climate change in the loess areas is not only based on luminescence dating but also on detailed geochemical analyses (Antoine et al., 2009, 2013; Stevens et al., 2011; Obreht et al., 2016). In our investigations we conducted an analysis of selected loess sequences consisting of a series of palaeosols and loess accumulation periods. The exploration of characteristic physico-chemical features for similar palaeosol and loess units is necessary for correct identification of loess dust deposition in a given area.
Our chronostratigraphy is expected to fill a gap in the European loess research conducted in the Czech Republic, Germany and Ukraine (Fuchs et al., 2013; Antoine et al., 2009, Fedorowicz et al., 2013, respectively).
. Study area and the geological setting
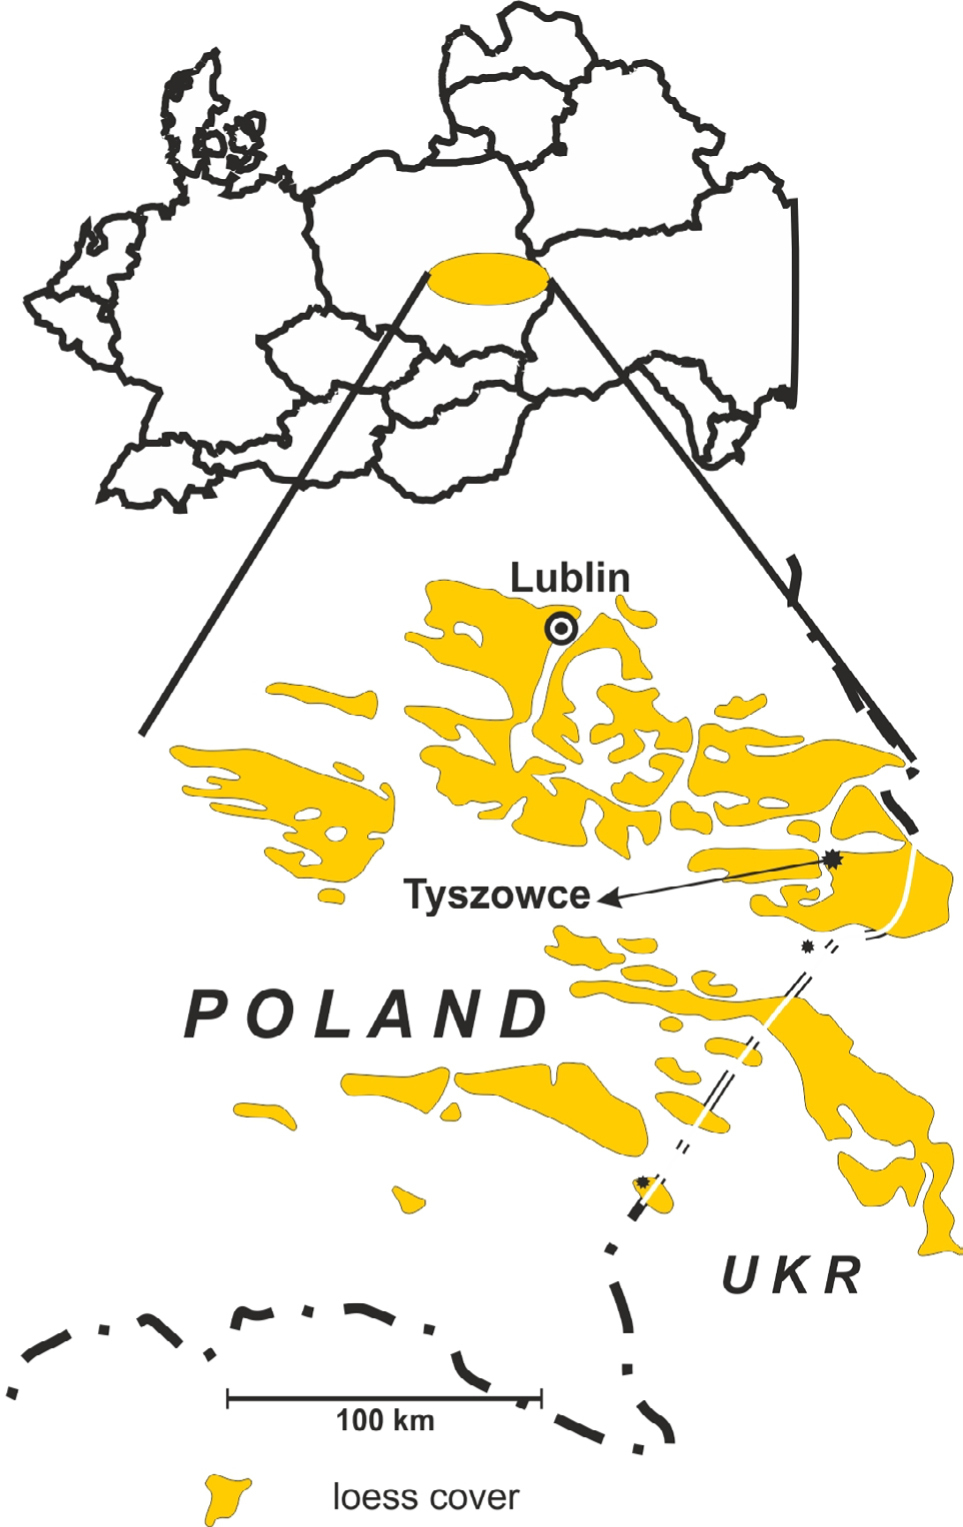
The Tyszowce loess section (λ = 23°42’45”E, φ = 50°36’30”N; Fig. 1) is located in the northern part of the Sokal Plateau-Ridge, which is a latitudinal cretaceous hump with thick (10–30 m) loess cover.
In the current study, we attempt to constrain the numerical chronology of a loess profile in Tyszowce (southeast Poland) using two different luminescence methods (OSL, post-IR IRSL) and two different types of material, namely silt-sized quartz fraction (45–63 μm) and polymineral fine grained material (4–11 μm). The profile in Tyszowce was also sampled in a continuous vertical section at close intervals of ca. 5 cm and documented in respect of its sedimentology, palaeopedology and stratigraphy. For all samples grain-size distribution, carbonate and organic carbon contents, geochemical composition and magnetic susceptibility were determined. For the upper part of the profile, 7 samples for radiocarbon dating were also collected and analysed.
The stratigraphy of the Tyszowce profile was presented more closely elsewhere (Maruszczak, 1974; Buraczyński and Wojtanowicz, 1975; Wojtanowicz and Buraczyński, 1978). The latest description of the section was published by Jary (2007).
The Tyszowce loess section represents Late Pleistocene loess. Similar to the paper of Jary and Ciszek (2013), the labelling system proposed by Kukla and An (1989), slightly modified by Markovic et al. (2008) for Late Pleistocene litho-pedostratigraphic units in Voivodina is used.
The loess-palaeosol sequence in Tyszowce consists of five units developed in the Late Pleistocene and Holocene (Maruszczak, 1974; Buraczyński and Wojtanowicz, 1975; Wojtanowicz and Buraczyński, 1978): two polygenetic palaeosol complexes (S1 and L1S1), two calcareous loess units (L1L1 and L1L2) and recent soil S0. As mentioned above, the presented stratigraphy (and the quoted age attribution) was created by the cited authors on the basis of physico-chemical analysis while first luminescence dates based on TL were presented by Jary (2007). A full geological description can be found in the supplementary material.
The S1 pedocomplex correlated with Eemian and Early Weichselian (MIS 5)
The formation of the S1 pedocomplex took place during the Eemian Interglacial (MIS 5e) and Early Weichselian Interstadials Brorup and Odderade (MIS 5c and MIS 5a). The upper part of S1 was deformed and/or eroded during the sudden climate deterioration at the beginning of the Lower Pleniweichselian (MIS 4).
The L1L2 loess unit correlated with Lower Pleniweichselian (MIS4)
The thickness of the L1L2 unit in the Tyszowce section varies between 1 and 3 m. In the lower part of this unit, the initial arctic brown soil has been preserved in some places. The average particle size increases upwards. Such lithological features of the L1L2 loess indicate that this unit was formed as a result of aeolian deposition on the surface reworked by slope processes.
The L1S1 soil unit linked to the Middle Pleniweichselian (MIS 3)
The L1S1 pedocomplex is the most important within the Weichselian loess and separates two main phases of loess deposition during the Last Glacial. There is evidence for significant loess deposition processes during the formation of the L1S1 pedocomplex in the Tyszowce brickyard. Pure loess not transformed by soil-forming processes has not been found within the L1S1 unit.
The L1L1 loess unit correlated with Upper Pleniweichselian (MIS 2)
The thickness of the L1L1 loess unit varies between 9 meters in the west side of the exposed deposit (Jary, 2007) and 15 meters in the east (the investigated section). It is an exceptionally large thickness proving a very high rate of aeolian dust accumulation. There are several weak tundra-gley horizons within the L1L1 loess unit providing evidence of short climate variations in the time of loess accumulation. There are considerable amounts of calcium carbonate (between 6 and 13%) which can be interpreted as a proxy of a relatively high loess accumulation rate as well as the degree of continentality of the loess sedimentary environment (Jersak, 1973). Results of grain-size analyses can be interpreted as evidence of a growing rate of loess accumulation, associated with fresh silt availability and decreasing distance to loess alimentation areas (e.g. Antoine et al., 1999, 2001, 2009; Vandenberghe and Nugteren, 2001). There are several sandy layers within the L1L1 loess unit in Tyszowce indicating the very close source of the transported material (Huczwa River valley) and severe conditions during the L1L1 loess accumulation.
. Sampling and experimental details
For this study, 21 samples from the 19 m thick loess profile at Tyszowce were collected. The sampling points represented the most characteristic profile sections. The procedures for sample collection for all necessary measurements can be found in Moska et al. (2015).
Sampling
The procedures include collection of samples for luminescence dating from a clean vertical section using thin-walled steel pipes from an Eijkelkamp system. At the same time, about 1 kg of loess was taken into plastic bags from around the tubes for gamma spectrometry.
In addition, six samples were collected for radiocarbon dating from the upper part of the profile. Four of them were collected from the L1L1 loess formation and two samples from the L1S1 soil formation. Each sample contained about 2 kg of raw loess or soil material. Samples for grain-size distribution, carbonate contents, organic carbon content and magnetic susceptibility were collected every 5 cm from the entire profile.
Chemical pre-treatment
For OSL measurements, medium grains of quartz (45–63 μm) were extracted from the sediment samples using a routine treatment with 20% hydrochloric acid (HCl) and 20% hydrogen peroxide (H2O2). The quartz grains were separated using density separation with the application of sodium polytungstate solutions leaving grains of densities between 2.62 g/cm3 and 2.75 g/cm3. The grains were sieved before etching with concentrated hydrofluoric acid (HF, 40 min).
For post-IR IRSL measurements, polymineral fine grains (4–11 μm) were extracted from the sediment samples. The sediment was first treated with 20% hydrochloric acid (HCl) and 20% hydrogen peroxide (H2O2). Subsequently the sediment was rinsed in deionized water. After drying, the sediment was suspended in alcohol and grains of desired diameter range were extracted by sedimentation. First, larger grains were deposited by leaving the suspension in a 7 cm high column of alcohol for 11 min. The suspension was then transferred to another test tube where the desired range was obtained by leaving the suspension for further 11 min. This step was repeated 4 times. After that, the solution from above the material settled during 12 hours was decanted to obtain the required fraction. The clean polymineral grains were suspended in 50 ml of acetone and 2 ml of the suspension was pipetted into flat-bottom tubes with stainless steel discs placed in them. The grains settled on the disc surface and after evaporation of the acetone, discs with a monolayer of fine polymineral grains were obtained.
Luminescence measurements
All OSL measurements were performed using an automated Daybreak 2200 TL/OSL reader (Bortolot, 2000). This reader uses blue diodes (470 ± 4 nm) delivering about 60 mW/cm2 at sample position and a 6 mm Hoya U-340 filter was used for the OSL detection. Laboratory irradiations were performed using a calibrated 90Sr/90Y beta source mounted onto the reader delivering a dose rate of ca. 3.0 Gy/min. All IRSL measurements were made using an automated Risø TL/OSL DA-20 reader fitted with a calibrated 90Sr/90Y beta source delivering 7.2 Gy/min to fine grains on aluminium discs. Optical stimulation of the samples was performed using IR LEDs emitting at 875 nm (nominal power of 135 mW/cm2), and the IRSL signal was detected through the BG39 (Schott)/CN7-59 (Corning)/GG420 (Schott) filter set.
Luminescence procedures and De calculation
For the coarse and medium grains quartz fraction, equivalent doses were determined using the single-aliquot regenerative-dose (SAR) protocol (Murray and Wintle, 2000). The OSL SAR protocol which was used in our measurements contained the following steps listed in Table 1.
Table 1
Steps used in protocols which were used for determined equivalent doses. For the medium grain quartz fraction the single-aliquot regenerative-dose (SAR) protocol (Murray and Wintle, 2000) was used. For the polymineral fine grains samples a post-IR IRSL protocol (Thiel et al., 2011) was used.
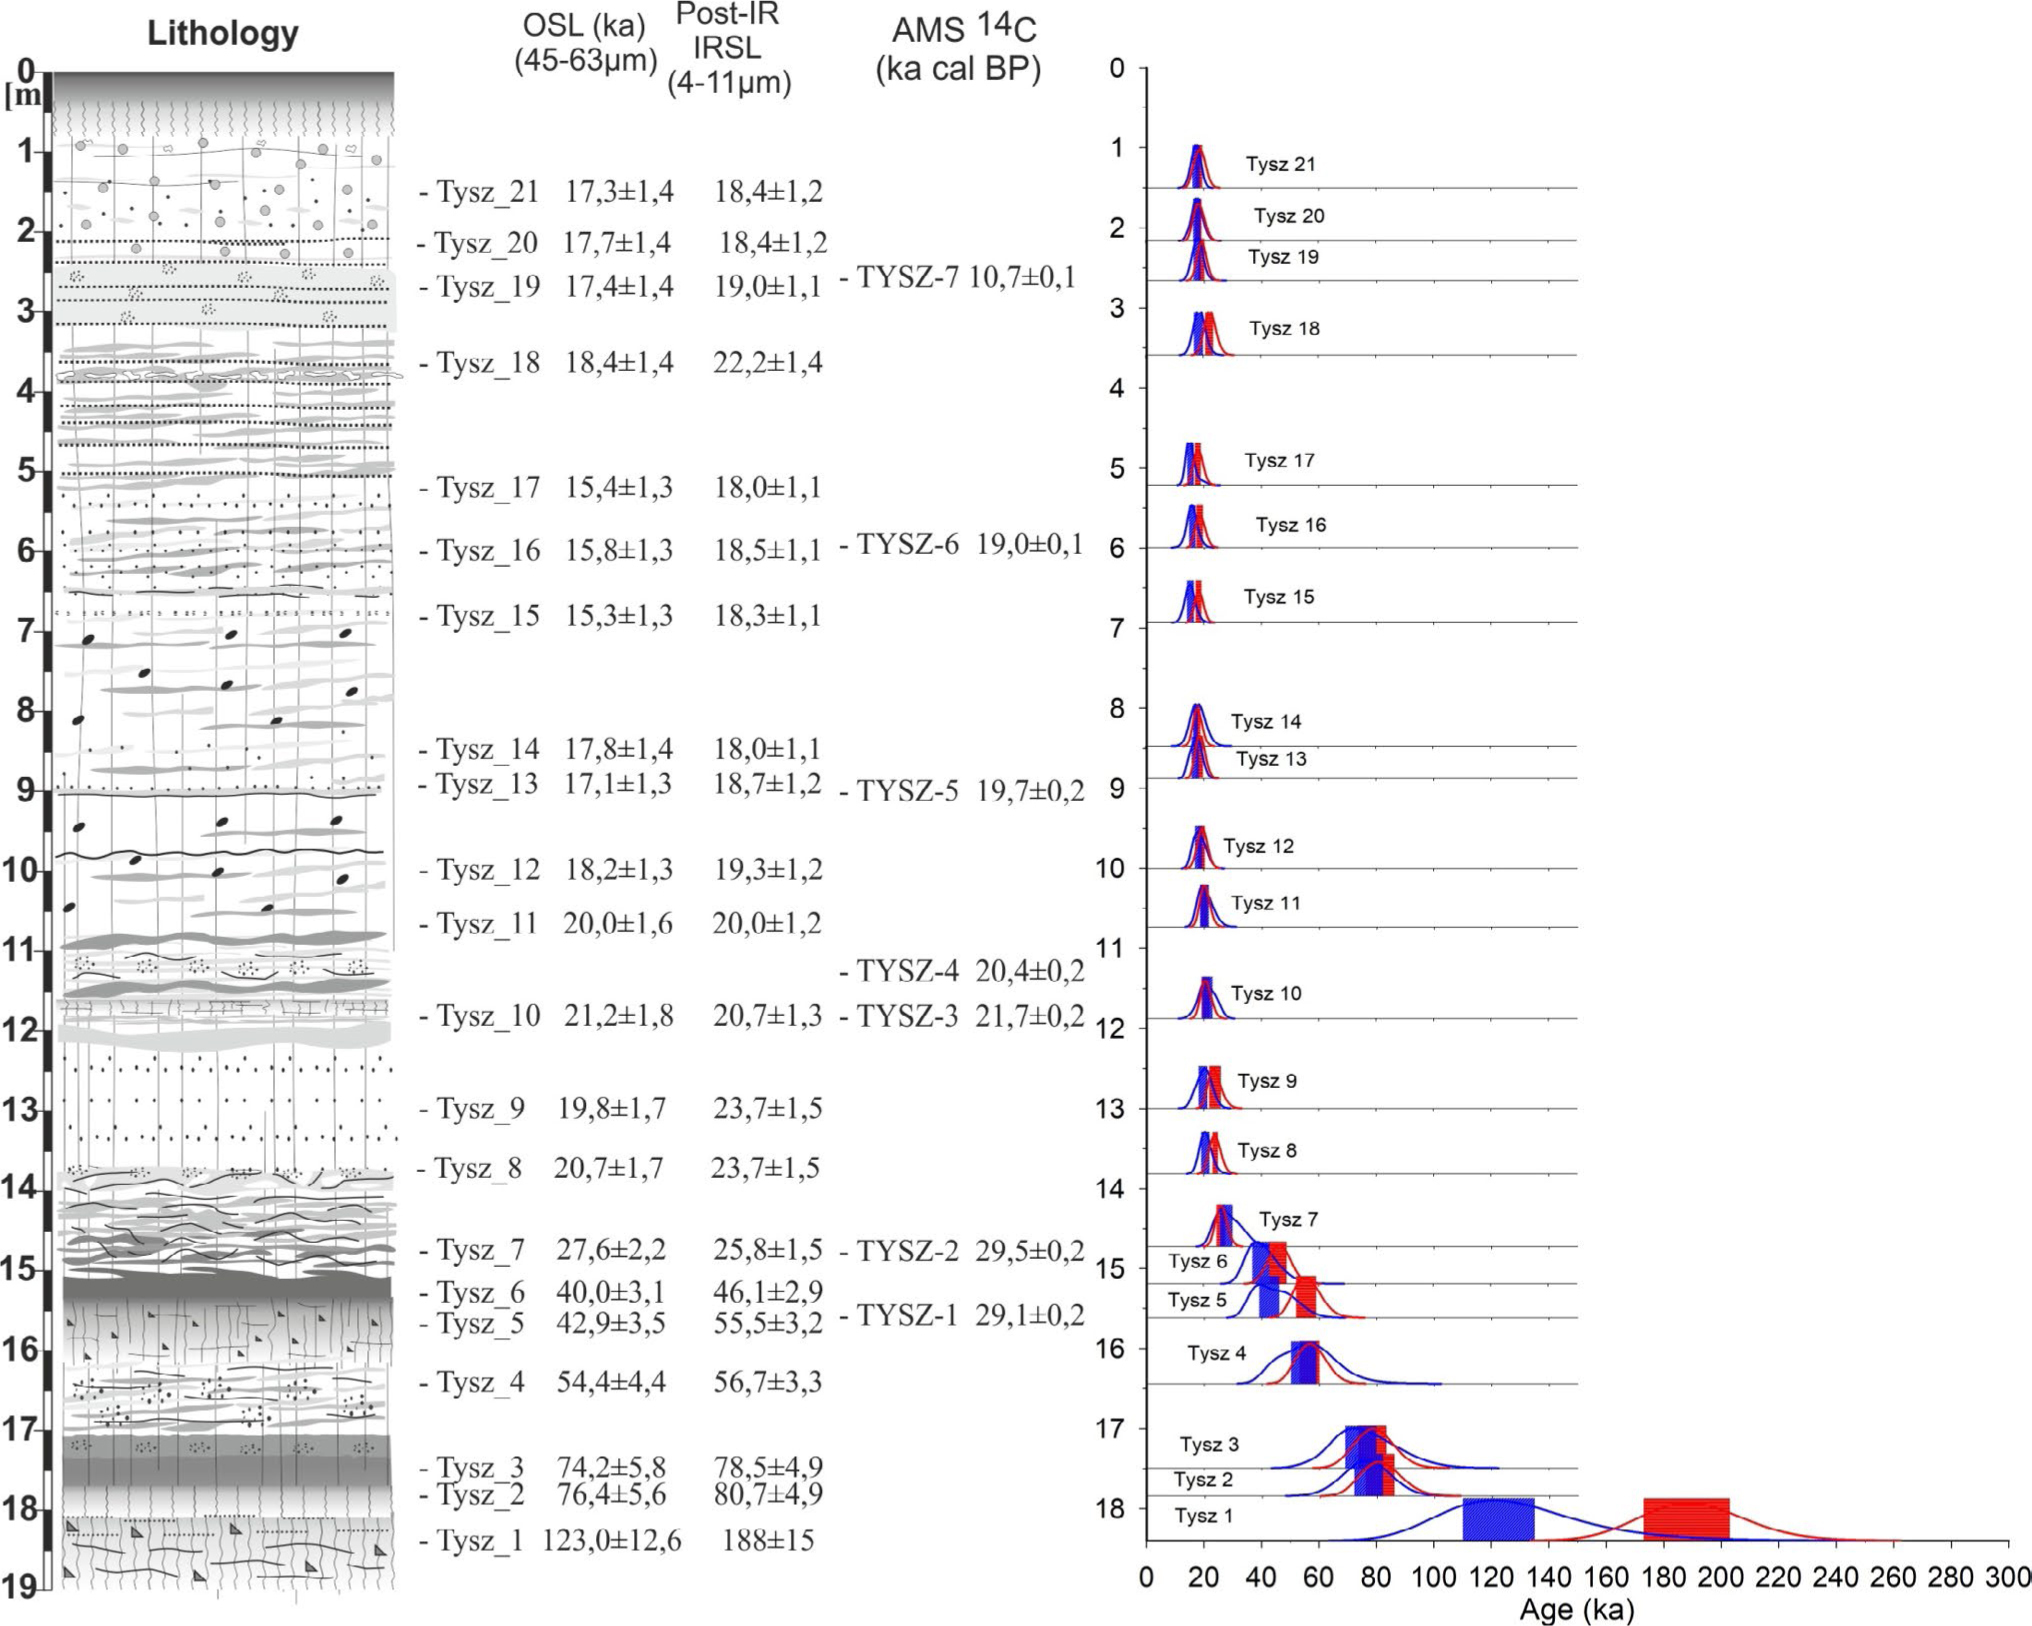
Intensities measured in steps 4 and 8 were used for equivalent dose determination. For equivalent dose calculation, the first second of the OSL decay curve was used and the background signal was estimated using its last 10 seconds. The ages were calculated using the Central Age Model (CAM) (Galbraith et al., 1999) and are presented in Table 2 and Fig. 4 where the relative probability density functions (Berger, 2010) for all samples are presented on the scale of depth and age.
Table 2
Sample names in the current study, specific activities of natural radionuclides, dose rates, calculated ages for all investigated fractions using CAM model and laboratory codes.
A preheat plateau test was performed for two quartz samples (Tysz_6 and Tysz_12) to establish the most appropriate preheat temperature. The preheat temperatures were varied from 200°C to 300°C in 20°C steps. No systematic variation in De with preheat temperature was observed. A dose recovery test was carried out for all samples. For quartz samples Tysz_6 and Tysz_12 for the 45–63 μm fraction the preheat temperature was varied between 200°C and 300°C in 20°C increments. For all other samples the dose recovery test was performed using the standard SAR conditions. For each sample, 5 different aliquots for each preheat temperature were used. Subsequently, all aliquots were bleached with blue light for 100 s (at room temperature) and after a pause of 10000 s they were bleached for another 100 s. After the bleaching, a laboratory dose of a value similar to the equivalent dose of each sample (between 50 and 180 Gy – depending on the expected sample age) was administered and measured using the SAR protocol. Dose recovery tests for the polymineral fraction were performed using the standard post-IR IRSL protocol and a minimum of 5 different aliquots for each investigated sample. In all cases, the dose recovery test performed for quartz grains using the standard SAR conditions yielded a ratio within the range of 0.93 to 1.00, where the lowest value was observed for the oldest sample. For the polymineral fraction all obtained results were within the range of 1.05 to 1.15.
Thiel et al. (2011) recorded residual doses of about 20 Gy but also recognized that the post-IR IRSL ages may display a consistent overestimation, when applied to loess, and Stevens et al. (2011) recorded residual doses in excess of 40 Gy. In our laboratory, we used a dedicated halogen lamp to bleach sample for 48 hours and next standard luminescence procedures were applied. For all investigated samples from Tyszowce, residual doses were from 15 Gy to 25 Gy. All the obtained equivalent doses using post-IR IRSL were corrected for the residual dose.
For the SAR protocol applied to quartz the dose response curves were built up to 400 Gy for the oldest samples and were fitted to a single saturating exponential function to determine Des. For those measurements three regenerative beta dose points were selected that bracketed the expected value of equivalent dose following test measurements on three aliquots were used (see supplementary material). Such a method of determining the equivalent dose was chosen due to the large number of samples. Such data can be fitted by a single exponential function, however the value of D0 increases with growing De values as recently pointed out by Timar-Gabor et al. (in press).
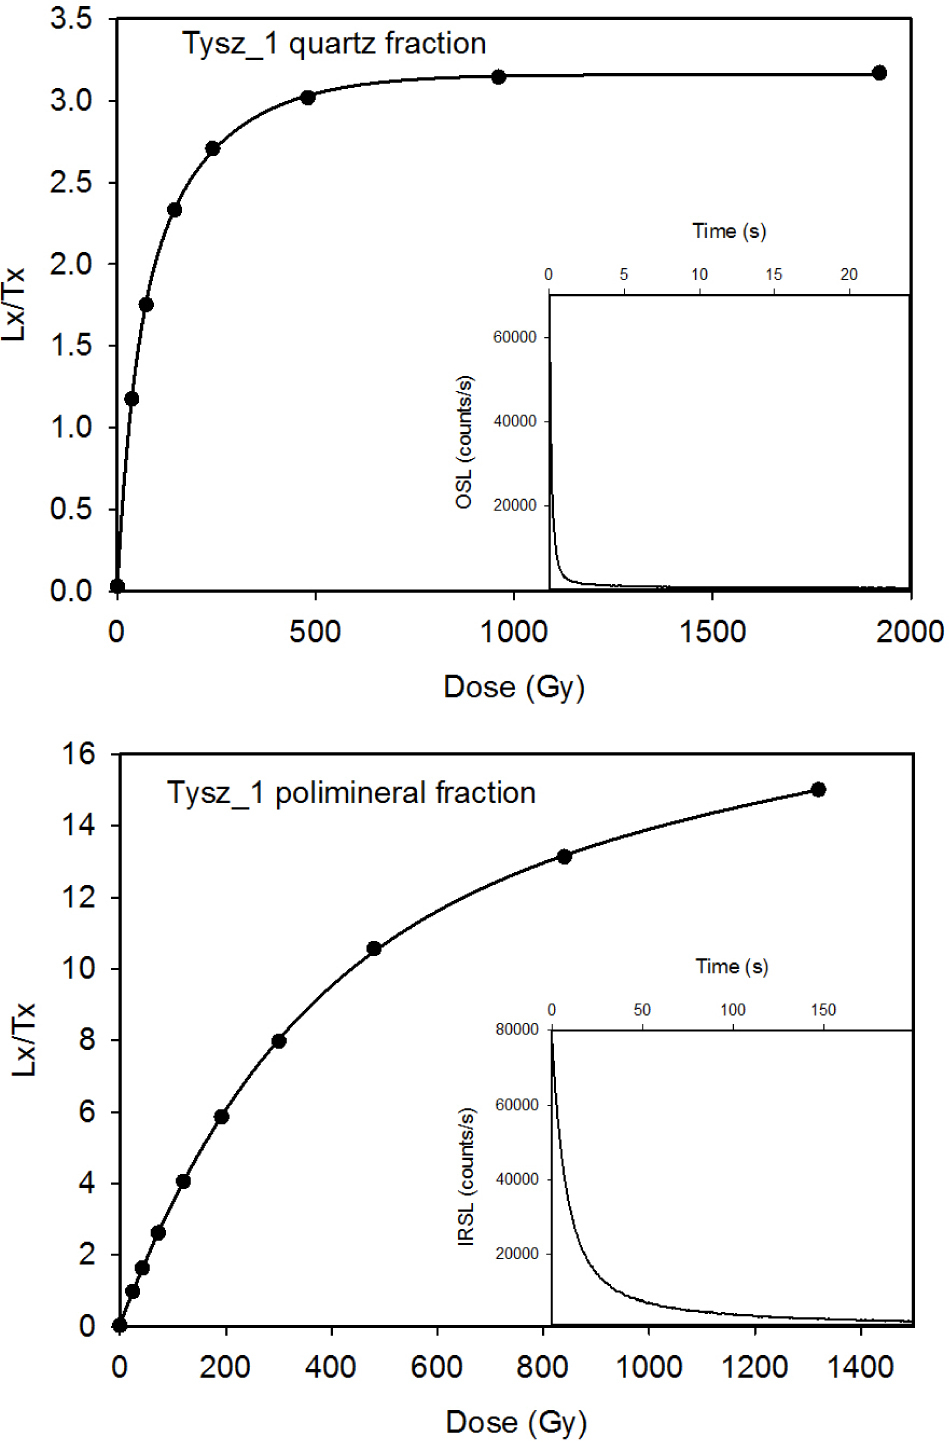
For two oldest samples, post-IR IRSL protocol where applied for doses up to almost 2000 Gy and were fitted with a double saturating exponential function to determine De. Similar experiment was used to create full growth curves (up to 2000 Gy) for 2 oldest samples for both methods. Examples for full growth curve Tysz_1 are shown in Fig. 3, together with typical decay curves for each of the signals. Growth curves in this case were fitted with a double saturating exponential function to determine De.
Dose rate calculation
In the laboratory, all OSL samples were dried. High-resolution gamma spectrometry using an HPGe detector manufactured by Canberra was carried out in order to determine the content of U, Th and K in the samples. The measurements were performed on 800 g samples placed in Marinelli beakers. The samples were stored for about 3 weeks to ensure secondary equilibrium between gaseous 222Rn and 226Ra in the 238U decay chain before measurements. The spectra were collected over a period of 24 hours. The activities of the isotopes present in the sediment were determined using IAEA standards RGU, RGTh, RGK after subtraction of the detector background. Dose rates were calculated using the conversion factors of Guerin et al. (2011). For beta dose rate the cosmic ray dose-rate at the site was determined as described by Prescott and Stephan (1982). We assumed that the average water content was similar for all samples and a value of (15 ± 5)% was used. For further calculations a mean avalue of 0.08 ± 0.02 was assumed for polymineral fine grains data while 0.04 for silt-sized quartz (Rees-Jones, 1995). In the latter case, HF etching and grain size were taken into account using formula given by Fleming (1979, pp. 21 and 42). Beta dose attenuation was calculated using Mejdahl (1979). Based on these data, the average dose rates for grain sizes of 4–11 μm and 45–63 μm were calculated (see Table 2).
Radiocarbon dating procedure
Radiocarbon dates were obtained for loess and soil samples. The search for best suitable radiocarbon materials took place at the site. Unfortunately, it was not possible to find charcoal or snail shells, so we decided to collect about 2 kg of material for each sample and try to extract humic acids in the laboratory. For all samples, 14C age determination of the humic acid fraction was possible. Humic acids from geological or archaeological samples are always assessed as a second-choice material for 14C dating. It is assumed that the 14C ages may be affected by the presence of humic acids originating from other (younger) organic material, e.g. from soil horizons located above a sample (Wild et al., 2013). Therefore, when humic acids are dated a verification of the dates is crucial. Typical chemical pre-treatment based at the acid-alkaliacid (AAA) method before radiocarbon dating. The AAA pretreatment involves rinsing the samples in hot hydrochloric acid (HCl) followed by a sodium hydroxide (NaOH). In the radiocarbon accelerator mass spectrometry (AMS) technique, the 14C concentration is measured in graphite prepared from the carbon contained in the sample. For this purpose, a line for preparation of graphite targets in the Gliwice 14C laboratory was used. The 14C ages were calibrated using the OxCal program v4.2 (Bronk Ramsey, 2009; Southon et al., 2013). The results are presented in Table 3.
Table 3
14C ages of loess and soil. The age was calibrated using OxCal program v4.2, (Bronk Ramsey 2009; Southon et al., 2013).
Grain size distribution measurements
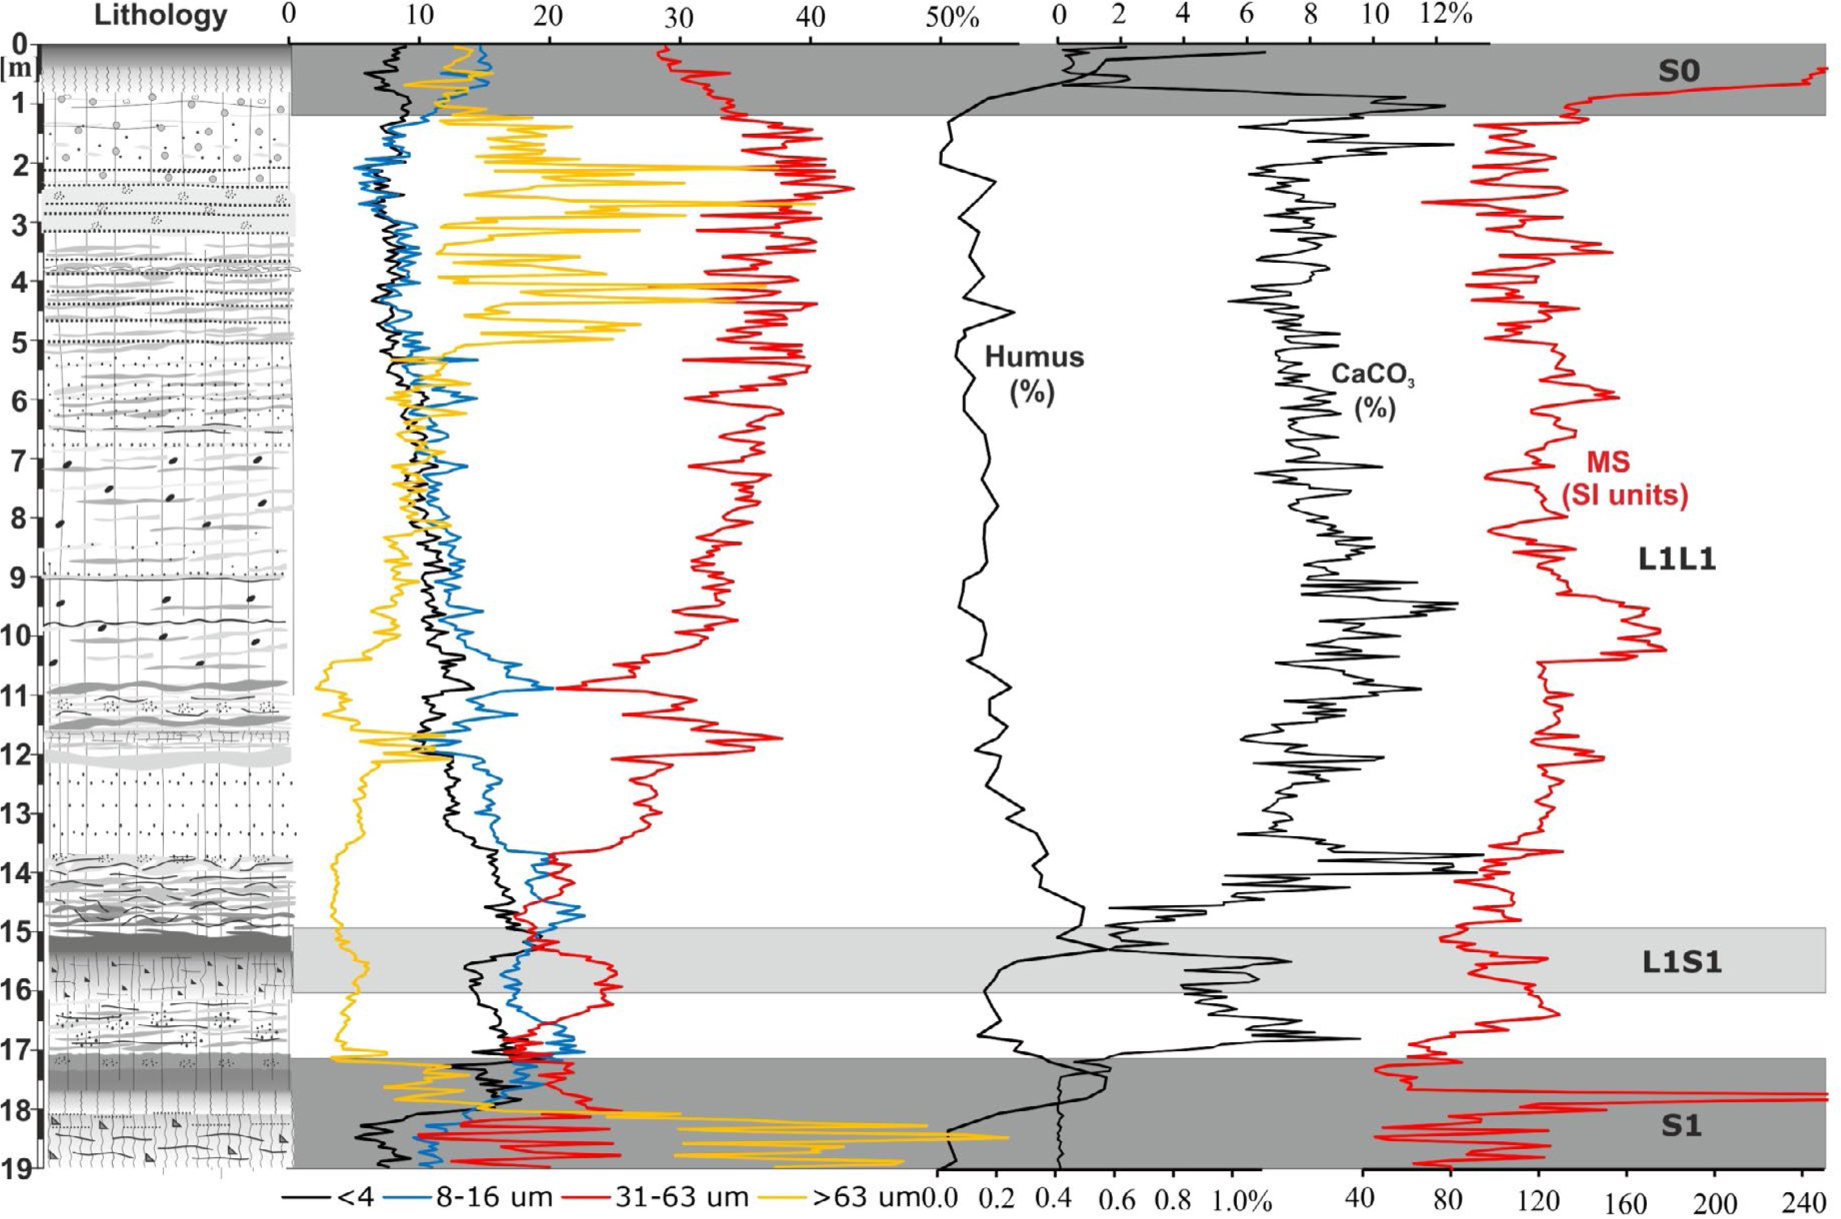
Grain size distribution was determined using a laser diffractometer Mastersizer 2000 (manufactured by Malvern, England). Before the measurement organic matter was removed by H2O2 and, next, carbonates using a 10% HCl solution. For better dispersion, sodium hexametaphosphate (calgon) was added to the solution before measurement. Summary of the amount of grains of different fractions can be found in Fig. 2 where the percentages of the individual investigated fractions (1–4 μm, 8–16 μm, 31–63 μm, and larger than 63 μm) are shown. Investigations of aeolian particle dynamics have found that the coarse grain population, or silt fraction, is generally transported by surface winds in short suspension episodes (Pye, 1987). This coarse aeolian population accumulates to form thick deposits in adjacent downwind areas. Conversely, the fine grain population, or clay fraction, once off the ground, can be dispersed over a wide altitudinal band. It is mainly transported by upper level flow, and is deposited far from the source areas (Pye, 1987, 1995).
Magnetic susceptibility measurements procedure
Recent studies of the magnetic properties of the loess palaeosol sequences have demonstrated the potential of magnetic susceptibility as a climatic proxy (Liu et al., 2004; Markovic et al., 2015), the variations in magnetic susceptibility are then matched to orbitally tuned δ18O records to derive a depositional chronology for the sequences. For the Quaternary, loess-palaeosol sequences represent one of the most detailed terrestrial records of global and regional climate changes. Magnetic susceptibility measurements of dried soil samples in plastic bags were carried out in the Department of Geological Processes of the Institute of Geology AS CR in Prague using the KLY-2 Kappabridge (Agico Brno, Czech Republic; magnetic field intensity of 300 A m−1, operating frequency of 920 Hz, sensitivity of 4×10⁻⁸ SI) with the error of measurement of ±2%. Raw data on mass-specific MS, expressed in m3/kg × 10−9, were plotted in Fig. 2.
Carbonates procedure
Carbonates were analyzed using the Scheibler method and the organic substance using the Tiurin method (Tyurin, 1935).
. Results and discussion
The calcium carbonate content in the S0 soil (modern soil) is typical for well-developed soils, i.e. almost all carbonates were removed from the soil (Fig. 2). The grain-size characteristics show that grains of diameter 31–63 μm are dominant in this unit. S0 soil is also characterized by the slightly higher value of humus content of about 0.6–0.8% and a strong signal from magnetic susceptibility. It is also possible that in the past, part of the S0 soil was eroded during the time of agricultural activity. Because this unit shows clear traces of bioturbation, we can observe a very large number of molehills and nests of swallows we decided that it was pointless to collect samples for luminescence dating.
In the investigated profile, the L1L1 cover reaches almost 14 meters indicating that in this area the climate conditions were favourable for loess accumulation. We can notice that the L1L1 cover in Złota, which is located about 200 km to the west, is only about 6–7 meters thick (Moska et al., 2015) and Biały Kościół (which is located in western Poland) is characterized by only 4-meter-thick loess cover for this unit. Grain-size distribution shows that for the whole unit, the dominant fraction is 31–63 μm, but a decrease of this content from about 40% in the upper part to about 20% in the bottom part is seen. Also, a large oscillation for largest grains (above 63 μm) can be observed in the upper part of the profile, which is due to the presence of a few thin sandy layers (each of 1–2 cm thick). This indicates that the source of this sandy material was located nearby and from the climatic point of view extremely harsh conditions of climate and environment dominated at this time. Magnetic susceptibility values in the L1L1 loess are rather small and oscillate but the signal is much lower than for the soil unit. The L1L1 loess unit contains considerable amounts of calcium carbonate ranging from 5 to 10%; these values are higher than for other Late Pleistocene loess deposits. This can be interpreted as an indication of a relatively high loess accumulation rate as well as the degree of continentality of the loess sedimentary environment (Jersak, 1973). The five 14C dates (calibrated using Oxcal 4.2, Southon et al., 2013) obtained for loess deposits are very similar compared to the luminescence results, only the result for sample Tysz-7 (10.7 ± 0.1 ka) seems to be very underestimated (Fig. 3). Because this sample is near some nests of swallows, we suspect that there might have been some leaching of modern organic matter, which could have caused this sample appear too young.
Fig. 3
Full dose response curves for Tyszowce 1 for quartz (OSL) and polymineral fraction (IRSL), together with typical decay curves (insets). Response curves fitted best to a double saturating exponential.
Other radiocarbon ages range from 19 to 21 ka agreeing very well with the luminescence results. Because of the large thickness of this unit, 14 samples were collected for luminescence dating (Tysz_8 – Tysz_21), and 28 luminescence ages were obtained. It is very characteristic that according to luminescence results, the loess cover in the L1L1 unit was created during a 3–5 ka period, which means that the calculated loess sedimentation rate for this unit is more than 3 mm per year which seem to be very high compared to about 1 mm per year calculated for different European loess profiles (Frechen et al., 2003; Antoine et al., 2009). For most samples, the results for the polymineral fraction agree within error limits with the results obtained using quartz.
The L1S1 soil unit is the most important fossil soil which has been identified in many locations where loess deposition occurred in Western and Eastern Europe. In Tyszowce, this complex of soil reaches 1 meter of thickness (Fig. 2). The magnetic susceptibility (MS) signal does not show the typical features of soils, it is weak with no characteristic peak in the signal. The upper part of the L1S1 unit is almost completely free from carbonates. The two 14C results were obtained also from humic acid extracts from the bulk material (Tysz-1 and Tysz-2). Both results (29.5 ± 0.2 and 29.1 ± 0.2 cal. ka BP) correlate very well with those obtained for the corresponding unit in the Złota section (Moska et al., 2015). The 14C age Tysz_2 (in the upper part of the soil) is very similar to the luminescence ages and also similar to the result obtained by Antoine (Antoine et al., 2001, 2009) for the corresponding pedocomplex Lohner Boden in Germany, i.e. 30.5 ± 0.7 cal. ka BP using radiocarbon dating. For the bottom part of this soil complex, luminescence results are much older than the radiocarbon age. Luminescence results are very similar to those obtained in Złota for this unit (Moska et al., 2015), results from samples Tysz_5 and Tysz_6 using the polymineral fraction seems to be overestimated and are similar to results obtained in the L1L2 section. The OSL results for the silt sized quartz are also similar to those obtained by other researchers in Europe. The Dubno pedocomplex in the Ukraine was dated to about 42.0 ± 6.0 ka (Fedorowicz et al., 2013) using the TL method and 31.1 ± 2.0 ka using the OSL method (Fedorowicz et al., 2013). Antoine et al. (2013) found that soil complex PK I in the Czech Republic was formed about 30.6 ± 0.4 ka ago using the radiocarbon method in loess deposits in Dolni Vestonice. Antoine et al. (2009) also confirm the stratigraphy for the Nussloch loess profile where this unit was dated at 30.5 ± 0.7 cal. ka BP using the radiocarbon method and about 34.0 ± 5.0 ka using the IRSL method.
Below the L1S1 pedocomplex, the lower loess unit was deposited probably during the Lower Pleniweichselian (Jary, 2007). The thickness of the L1L2 unit is only 100 cm which is much less than that of the L1L1 unit. The L1L2 unit is also more than 2 times thinner than in central Poland in the Złota profile (Moska et al., 2015). The MS of the L1L2 unit is relatively small but it is possible to detect some fluctuations. The lowest values are characteristic for the deeper part of this unit, just above the boundary between the L1L2 and S1 units. Similarly to the L1L1, the content of fine silt material decreases from about 30% to 20% (Fig. 2). Other grain fractions demonstrate less fluctuation; especially the fraction above 63 μm in the whole unit stays on the very low level of about 5%. The content of carbonates in the L1L2 unit is slightly lower compared to the L1L1 unit but is still more than about 4% and in the bottom part is visibly decreasing from 8–10% to almost zero at the boundary between L1L2 and S1 units. This characteristic looks very similar to the CaCO3 content in the Złota profile (Moska et al., 2015). From this unit, only two OSL results were obtained, namely for the sample Tysz_4 (54.4 ± 4.4 and 56.7 ± 3.2 for quartz OSL and polymineral post-IR IRSL, respectively). The IRSL result is very similar to the OSL result and also to IRSL result which was obtained for deposits collected close to the boundary between the L1S1 and L1L2 units (Tysz_5). IRSL results also in Złota profile look similar for this unit (Moska et al., 2015).
The calcium carbonate content in the S1 soil is typical for a well-developed soil, i.e. almost all carbonates were removed from the soil (Fig. 2).
In the bottom part of the profile, a clearly visible soil occurs. In the lowest and the oldest part of the investigated loess profile, a sequence of a fossil soil and a well-developed illuvial horizon was formed. The S1 unit is 1.5 m thick and in the central part of this unit we can observe the highest value of MS as a characteristics peak which is observed for all well-developed soils. The amount of CaCO3 is close to zero in the entire unit. Characteristic for the bottom part of this unit is an incredibly high content of sand grains exceeding 40%, also suggesting that this sand material originates from the neighbourhood. Six luminescence results obtained for this unit (samples Tysz_1, Tysz_2, Tysz_3) show that the ages increase with depth. The results obtained for quartz (Fig. 4) span the period between 75 ka and 123 ka which fits well with the typical period of S1 soil formation, i.e. from about 75 ka up to 130 ka, according to research published so far. The results for the polymineral fraction Tysz_2 and Tysz_3 fit very well (78.5 and 80.7 ka) and only Tysz_1 looks to be overestimated at 188 ka. We can also notice that for sample Tysz_1, the dose rate is almost 40% lower than for samples above; this value (about 1.5 Gy/ka for the silt sized fraction) is unusual for loess and soil deposits (typical values about 2.5 Gy/ka). In addition, as the horizon S1 represents a palaeosol, there is a possibility that the post-IR IRSL signal was not completely bleached at deposition. During our investigations, to check the dose rate, we collected other samples belonging to this unit from different locations within the Tyszowce brickyard, obtaining ages consistent with the first one. It is very difficult to explain what happened with the radionuclide particles and why they were removed from this unit. From the viewpoint of the obtained results we should also consider whether the luminescence results obtained for quartz can be underestimated in connection with the quartz luminescence properties. In the literature, several workers have reported age underestimation in OSL dating (Lowick et al., 2010; Timar-Gabor et al., 2011, Chapot et al., 2012) for high De doses (more than 150 Gy). In the S1 unit, for all samples the equivalent doses (De’s) show a clear change with depth for all fractions. Analysing the typical full growth curves obtained for the oldest samples (examples are presented in Fig. 3), a difference in growth curve shape can be seen between the two methods. The signal for the quartz becomes saturated significantly earlier. The De (about 200 Gy for quartz and 350 Gy for polymineral samples) is much closer to saturation in the case of quartz samples. On the other hand, we think that very low dose rate for the oldest sample and the obtained equivalent dose of about 185 Gy for the oldest samples should not be underestimated. The ages obtained in this study, are also similar to those obtained from equivalent units in Dolni Vestonice (Czech Republic, Antoine et al., 2013), Korshiv (Ukraine; Fedorowicz et al., 2013) and Saxony (Germany, Meszner et al., 2013).
. Conclusions
The loess-palaeosol sequence in Tyszowce is one of the most important sites for loess research in Poland as it is representative not only for the whole eastern part of the country but also demonstrates the importance of this site as a representative record of the Late Pleistocene climate and palaeoenvironment in this part of Europe. This is due to the presence of clearly separated five stratigraphic units with well-preserved features. The units characterize this section from the sedimentological and pedological point of view and demonstrate the continuity of their sedimentation, which is the foundation for building loess stratigraphy and its use for correlation with loess in the Ukraine and Western Europe. The MS variation displays a high degree of similarity to the enviromagnetic records observed in other European Late Pleistocene loess sections. The results obtained in this study are in concordance with grain size distribution and magnetic susceptibility variations agreeing very well with stratigraphic boundaries. The two employed luminescence dating methods yield mostly consistent results with differences visible only for the two soil units L1S1 and S1. During the loess accumulation periods, the results are in agreement within uncertainties. Similarly, consistent results were obtained for the other investigated loess profiles. Contrary to indications in literature we do not see the age underestimation in quartz at least until 70 ka (e.g. Wintle and Adamiec, 2017).
We can observe high consistency of luminescence results between Tyszowce and Biały Kościół (Moska et al., 2012) and Złota loess profiles (Moska et al., 2015). The age boundaries for the unit L1L1 are also the same for Złota and Biały Kościół. It can be seen that during the L1L1 unit in the eastern part of Poland existed very good conditions for loess accumulation, significantly better than in central and western part of Poland. The sedimentation rate is about 3 mm per year and is much higher to more than 1 mm per year obtained for the site Nussloch by Antoine et al. (2009) and about 1.5 mm per year for Złota section (Moska et al., 2015). These results indicate that the rate of the L1L1 loess accumulation was exceptionally fast and it lasted only a few thousand years contrary to the formerly held belief that it lasted well in excess of 10 ka.
The 14C results correlate very well with the luminescence results only one 14C result seems to be underestimated (Tysz_7). In addition, the 14C results obtained for the L1S1 soil complex correlate very well with results from Nussloch (Germany, Antoine et al., 2009), Dolni Vestonice (Czech Republic, Antoine et al., 2013) or Złota (Poland, Moska et al., 2015).
The L1S1 soil unit is clearly visible and humic horizons of gley soil is dated here to about 40 ± 3 ka, which is in agreement with loess deposits in other locations in Europe and Poland.
The S1 pedocomplex is well developed and luminescence results for quartz are within the geological boundaries. The oldest sample Tysz_1 is a kind of mystery because of the significant change of the dose rate. Post-IR IRSL ages using the polymineral fine grain fraction are very similar to results obtained from quartz, only two post-IR IRSL results obtained for samples which were collected from soils (Tysz_5 and Tysz_1) are older than for quartz fraction and also older than expected ages from the geological point of view. The results presented in this study yield a robust chronology of the evolution of loess deposits in western Poland and, in conjunction with similar research carried out for other loess profiles in Poland, it will allow to present a comprehensive picture of their chronological evolution.