
. Introduction
The Bohai Sea is a semi-closed sea in northern China which is known to have thick and continuous Quaternary sediments. Many studies on the geological and environmental evolution around the Bohai coast have been carried out on these Quaternary sediments (Yi et al., 2012; Liu et al., 2009; Wang and Fan, 2005; Wang et al., 2004; IOCAS, 1985). Alterations of marine and terrestrial sediment strata were recognized from numerous sediment cores (e.g. Zhao et al., 1978; Yao et al., 2006; Yi et al., 2015).
During the Holocene, significant geomorphological changes took place in the Bohai coastal area due to coastline migration (sea level change) and fluvial sediment input. These sediments showing the Holocene transgressive phase are widely distributed, especially in three bays of the Bohai Sea with flat landforms. The regional sea level in Bohai rose to the highest sea level at 5–7 ka, and then oscillated slightly and fell to the present level gradually (Xue, 2009; Xue and Ding, 2008; Xu, 1994; Zhao et al., 1979). Historical documents have also been investigated to provide information about coastline changes during the late Holocene (Lin, 1991; Chen et al., 2010). Sedimentary systems including tidal flat, salt marsh, fluvial, lacustrine, and aeolian sediments along the Bohai coast, which were deposited associated with the sea level oscillation, can be recognized from the surface morphology (IOCAS, 1985). These sediments have documented rich information that promotes the understanding of the sea level fluctuation and the sedimentary process during the post-sea level high stand period. Although the marine strata in the Bohai coast area have been well studied and interpreted, the timing and formation of the sediments which were deposited close to the past sea levels within the range of the Holocene transgression are poorly understood due to the lack of datable material and to unreliable chronologies (e.g. Fang and Hu, 2007).
In the past decades, luminescence dating methods have been significantly improved and applied widely to establish chronologies of various sedimentary archives of the late Quaternary, especially after the development of a single aliquot regenerative dose (SAR) protocol (Murray and Wintle, 2000, 2003). The optically stimulated luminescence (OSL) signal from quartz and the infrared stimulated luminescence (IRSL) signal from feldspar are the two main signals that are used for dating. Although there are still challenges (e.g. relatively large uncertainties from insufficient luminescence sensitivity, overestimation caused by thermal transfer, and incomplete bleaching; Madsen and Murray, 2009), the quartz OSL dating using the SAR protocol has been successfully carried out to date young sediments from different environments (e.g. marine deposits: Madsen et al., 2005; Zhang et al., 2014; coastal sand dune: Kunz et al., 2010; Reimann et al., 2011; inland dune: Forman and Pierson, 2003; Yang et al., 2012; Du and Wang, 2014). On the other hand, the feldspar IRSL signal suffers from anomalous fading which causes age underestimation. Recently, it has been found that the post-IR IRSL (pIRIR) signal measured at elevated temperature fades significantly less than the conventional IRSL signal at 50°C (Thomsen et al., 2008). The pIRIR protocol with different preheat and stimulation temperature combinations were tested to date sediments from various environments and in different age range (Thomsen et al., 2008; Thiel et al., 2011; Madsen et al., 2011). Specifically, the pIRIR protocols (Reimann et al., 2011) and the multi-elevated-temperature pIRIR protocol (Fu and Li, 2013) with low thermal combinations (preheat ≤ 200°C) were and found to be suitable for dating of young (Holocene) deposits. Reimann et al. (2011) proved that the pIRIR dating results measured at 180°C (pIRIR180) are in agreement with quartz ages and radiocarbon dates, after subtracting the residual dose. Madsen et al. (2011) and Reimann and Tsukamoto (2012) proposed the pIRIR protocol with preheating at 180°C and pIRIR stimulation at 150°C (pIRIR150) to date young coastal sand deposits. The pIRIR150 protocol has been applied successfully for the Holocene aeolian deposits, lacustrine sediments and marine deposits using coarsegrained feldspar and polymineral fine-grained materials as well (Long et al., 2014, 2015; Yang et al., 2015). However, whether one should correct for small anomalous fading and residual dose for the pIRIR signal is still under discussion (Li et al., 2014a; Buylaert et al., 2012).
We study a well-preserved sand dune and the underlying marsh sediment situated in the Lower Liao Plain, the north coastal area of the Bohai Sea. Our aim is two-fold; first, we apply OSL dating to sand-sized quartz grains extracted from a well-preserved sand dune and marsh sediment to establish the chronology of these deposits. On the basis of coastline changes in historical documents, the timing of sand accumulation and the possible forcing mechanisms of the sand deposition are discussed. Our second aim is to investigate the effects of the residual dose in the pIRIR dating of young sediments. The pIRIR150 protocol is applied on K-feldspar fraction for all samples and the results are compared with the quartz ages to determine the applicability of the protocol for the young dune sediments.
. Study area, site description, and sampling
Study area
The Lower Liao Plain (LLP) is an alluvial plain located in northeastern China (Fig. 1). To the north of the LLP, the Horqin dune field is located, which is one of the four biggest dune fields in China (Fig. 1A). South of the LLP is the Liaodong Bay, which is the northern part of the Bohai Sea. As a consequence of continuous subsidence during the Quaternary (Allen et al., 1997), sediments were carried by several streams and deposited in the LLP and the Liaodong Bay. Two dominant rivers, Liao River and Daling River, contribute most to the sediment load.
Fig. 1
(A) The location of the study area in NE China. (B) Map showing the geological setting (Lower Liao River plain, local drainage streams and adjacent mountain areas) and coastline changes (sea level in Holocene, coastlines in 1905 AD, 1932 AD, 1950 AD and present, Fu, 1988; Chen et al., 2010). The location of the sampling site is also shown. (C)–(E) Typical sand deposits in the LLP. (C) is a photo of studied PJ sand dune.
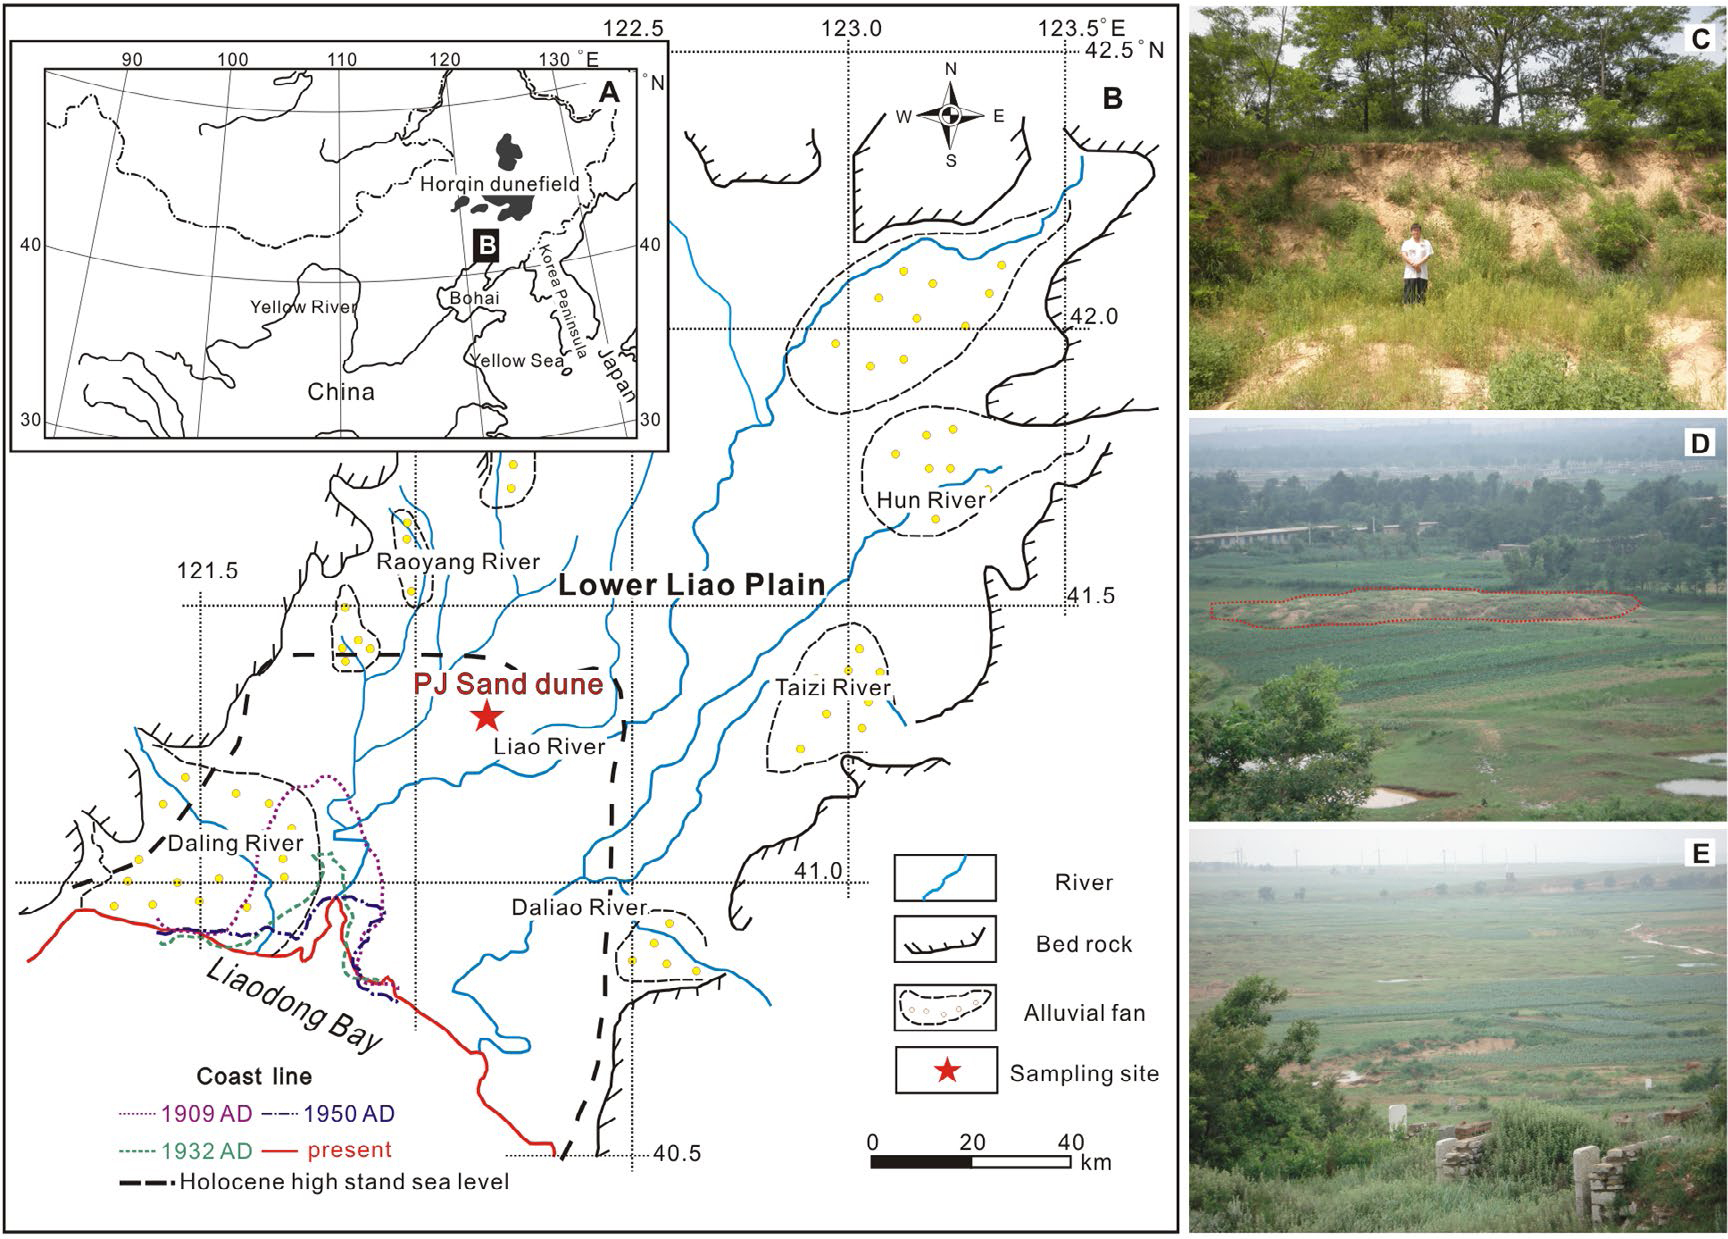
The position of the coastline has changed significantly since the late Pleistocene widely along the Bohai coast. Several marine layers were found in cores drilled in the LLP; these have been correlated to transgressions (IOCAS, 1985). The uppermost transgressive phase is widely distributed along the Bohai coast and constrained to the Holocene climate optimum (IOCAS, 1985). The regional sea level highstand in the Liaodong Bay occurred at 5–7 ka and reached to the area of 50 km inland from the modern coastline (Fu, 1988). Afterwards, the sea level oscillated and fell to the present-day level. Historical documents and remote sensing were applied to examine the coastline changes in the LLP over the last hundred years (Chen et al., 2010). The results show that a significant progradation occurred in the LLP owing to an increased river load (Chen et al., 2010).
At the present surface, fluvial, alluvial, aeolian, and coastal sediments can be recognized in the LLP. Aeolian sediments in the LLP are mainly reworked sand dunes, which are mobile under strong wind force (e.g. Fig. 1C, IOCAS, 1985). Although the sand deposits are distributed extensively, it is difficult to map the distribution as most of the comparatively large sand dunes and ridges are disturbed by human activities (e.g. agricultural movement: residual sand dune in farmland, Fig. 1D). The sand deposits at small scales are covered by vegetation and cannot be identified from satellite images (Fig. 1E).
The entire region is affected mainly by the East Asian monsoon. The mean annual temperature is 5–10°C, with the mean temperature at 27–31°C in summer and the mean temperature at –5–18°C in winter. The mean annual precipitation is 634 mm, while annual evaporation reaches 1670 mm. During the winter seasons, the wind direction is north-western, whilst the summer seasons is dominated by south or south eastern wind from the Pacific (BGMRL, 1989).
Site description
The sampling site is located in the Panjin (PJ) forest park within the elapsed marine-terrestrial interacted area (Fig. 1), where the PJ sand dune is well preserved. Four sedimentary sections (S1-S4; Fig. 2B) were investigated and sampled. The sediments can be divided into four units (Fig. 2): Unit A contains homogenous yellowish fine sand with a thickness of ca. 4.5 m, covered by vegetation. The sediments are well to moderately sorted. Several roots were found in this layer. Unit B consists of grey fine sand with a thickness of 0.5–0.6 m. The grey sands are moderately to poorly sorted with organic matter. Unit C is a blackish sandy soil layer, consisting of poorly sorted sandy silt and clayey silt with organic-rich matter and soil aggregates. Clear boundaries can be distinguished between the different units. Additionally, at S2, a grey silt layer (Unit D) was found under the blackish sand layer which is not exposed in other sections. Unit A and B are relatively homogenous sands deposited above the sandy silt layer containing organic matter. The darker colour of unit B represents the anoxic condition due to the ground water above the impermeable soil layer.
Fig. 2
(A) Investigated profile and its description. The positions of OSL samples are shown in the profile. (B) Stratigraphy of the PJ dune showing the positions of four investigated sections and sampling depths.
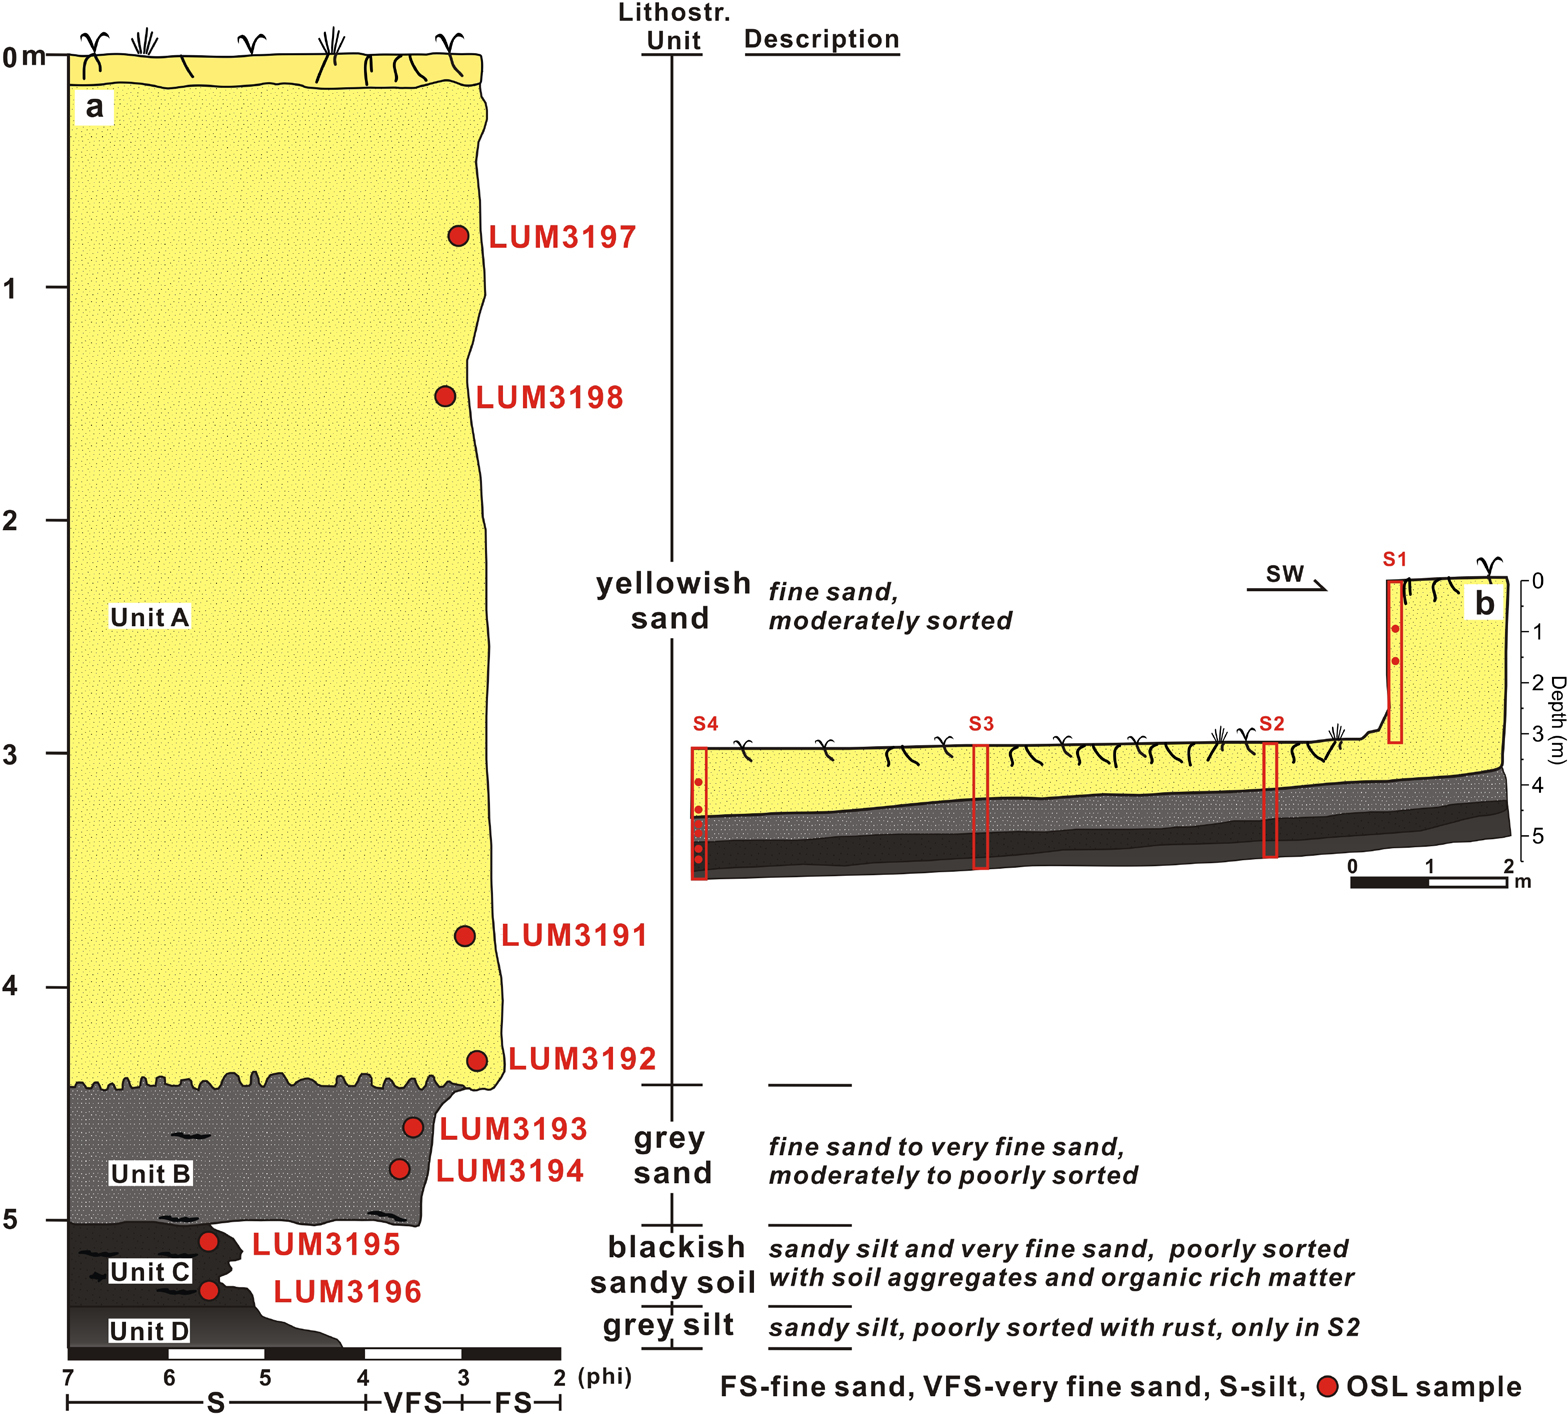
Eight OSL samples (LUM3191 to LUM3198) were taken by hammering steel tubes (10 cm long cylinders with a diameter of 4 cm) into freshly prepared vertical sections from S1 and S4. The cylinders were fully filled with sediments to make sure that there is no mixing during transportation. The tubes were then covered and sealed with black plastic sheets and tapes to prevent light exposure and moisture loss. Two samples were taken from S1 (LUM3197 and LUM3198) and six samples were taken from S4 (LUM3191 to LUM3196), covering the three sedimentary units A-C.
. Methods
Sample preparation
The preparation of sand-sized samples was conducted under the subdued red light in the luminescence laboratory at Leibniz Institute for Applied Geophysics. Materials of the outer 2 cm from both ends of the tubes were removed and discarded. For the upper six sand samples (LUM3191-3194, LUM3197-3198), the remaining nonlight exposed material was dry-sieved to collect grains of 100–150 μm in diameter. With diluted hydrochloric acid (HCl) for two hours, sodium oxalate (Na2C2O4) for one day and hydrogen peroxide (H2O2) for two hours, the samples were treated to remove carbonate, mineral aggregates and organic matter, respectively. For the lower two sandy soil samples (LUM3195-3196), chemical treatment was carried out first because the grains can be hardly dispersed and dry-sieved. Subsequently, the remaining material was dry-sieved to extract grains 63–100 μm in diameter. Three steps density separations were performed using heavy liquid to extract quartz grains (2.62 < ρ < 2.70 g/cm−3) and K-feldspar grains (ρ < 2.58 g/cm−3). The quartz extracts were subsequently treated with 40% hydrofluoric acid (HF) for 1 hour and to remove the remaining feldspar grains and etch quartz grains to eliminate the effect of the alpha-irradiated outer layer. The etched samples were finally treated with HCl and resieved to ensure the grains smaller than 100 μm for sand samples and 63 μm for sandy soil samples were removed.
Experimental details and protocols
The quartz and feldspar grains were mounted on stainless steel discs with a diameter of 6 mm and 2.5 mm respectively using silicone oil as adhesive. Luminescence measurements were carried out with an automated Ris⊘ TL/OSL system (DA-15) equipped with a calibrated 90Y/90Sr beta source. For quartz measurements, blue light-emitting diodes (LEDs, 470 ± 30 nm) were employed for stimulation, and the quartz OSL signals were detected through a 7.5mm Hoya U-340 filter. The feldspar signals were detected through a combined blue filter pack (Schott BG-39 and Corning 7-59) stimulated by infrared LEDs (870 ± 40 nm).
A single-aliquot regenerative dose (SAR; Murray and Wintle, 2003) protocol was applied for pre-tests and equivalent dose (De) measurements (Table 1). 24 aliquots for each sample were measured for the De determination of quartz. To test the purity of the quartz extracts, OSL IR depletion ratio (Duller, 2003) was employed in the SAR protocol to check feldspar contamination in the measured quartz. After the standard SAR protocol, an additional recycling dose was given to each aliquot. IR stimulation of grains for 40 s at room temperature using infrared LEDs was set after preheat and blue stimulation. The thermal treatment was set as preheat at 180°C and cutheat at 160°C with blue stimulation at 125°C (Table 1). The determination of preheat temperature is described in section 4. The initial OSL signals integrated over 0.80 s (first 5 channels) were subtracted by ‘Early background’ (6–12 channels, 0.8–1.92 s) to avoid a contribution from medium and slow components (Cunningham and Wallinga, 2010). Among the measured aliquots, aliquots which exceeded the acceptable range (0.9–1.1) for the OSL IR depletion ratio or recycling ratio were excluded from the De determination (Wintle and Murray, 2006; Rodnight, 2008).
Table 1
SAR protocol applied for equivalent dose determination.
| Step | Quartz OSL | K-feldspar post-IR IRSL150 | |||
|---|---|---|---|---|---|
| Treatment | Observed | Step | Treatment | Observed | |
| 1 | Give dose a, Di | 1 | Give dose | ||
| 2 | Preheat for 60 s at 180°C | 2 | Preheat for 60 s at 180°C | ||
| 3 | IR stimulation b for 40 s at 0°C | 3 | IR stimulation for 100 s at 50°C | ||
| 4 | Stimulation for 40 s at 125°C | Ln, Li | 4 | IR stimulation for 200 s at 150°C | Ln, Li |
| 5 | Give test dose, Dt | 5 | Test dose, Dt | ||
| 6 | Heat to 160°C | 6 | Preheat for 60 s at 180°C | ||
| 7 | Stimulate for 40 s at 125°C | Tn, Ti | 7 | IR stimulation for 100 s at 50°C | |
| 8 | Return to 1 | 8 | IR stimulation for 200 s at 150°C Return to 1 | Tn, Ti | |
| 9 | Return to 1 | ||||
The pIRIR150 protocol (Table 1) was applied for K-feldspar De determination, residual dose measurement and dose recovery test. First 5 s of IR and post-IR IRSL signals is used for calculating the De values, by subtracting a background of the last 15 s of respective signals. Nine or ten feldspar aliquots were measured for the De determination for each sample.
Dose rate determination
For dose rate determination, additional 50 g of dried sample material were filled in plastic containers and stored at least four weeks before gamma spectrometry measurements to secure equilibrium between radon and its daughters. The concentrations of uranium (U), thorium (Th) and potassium (K) of the surrounding sediment were calculated from the activity of these nuclides measured by high-resolution gamma spectrometry. Each sample was measured over a period of two to three days. Bulk samples were weighed before and after drying the samples at 130°C for one day to determine the natural water content. The median water content value of six sand samples with an error which can cover the range of all water contents, 6 ± 4%, was assumed for the water content of sand sediment in antiquity. The water content of the two soil samples was estimated to be 13 ± 3% according to the observed water content. The cosmic dose rate was calculated for each sample as a function of depth, altitude and geomagnetic latitude according to Prescott and Hutton (1994). The conversion factors of Guérin et al. (2011) and beta attenuation factors of Mejdahl (1979) were applied for the external beta- and gamma-dose rate calculation using the radionuclide concentration. The additional internal dose rate of each feldspar sample was calculated according to a potassium concentration of 12.5 ± 0.5% (Huntley and Baril, 1997) and 87Rb concentration of 400 ± 100 ppm (Huntley and Hancock, 2001). A mean a-value of 0.15 ± 0.05 was used for dose rate calculation of the feldspar grains as a contribution of external alpha radiation (Balescu and Lamothe, 1994). The quartz dose rates range from 3.08 ± 0.21 to 3.31 ± 0.24 Gy/ka, and the feldspar dose rates are from 3.92 ± 0.16 to 4.14 ± 0.17 Gy/ka (Table 2).
Table 2
Dose rate determination
| SampleID | Depth (cm) | Grain size Interval (μm) | U (ppm) | Th (ppm) | K (%) | Water content (%)a | Dose rate(Gy/ka) | |
|---|---|---|---|---|---|---|---|---|
| K-feldspar | quartz | |||||||
| LUM3197 | 80 | 100–150 | 0.96 ± 0.06 | 2.63 ± 0.14 | 2.85 ± 0.14 | 6 ± 4 (1.7) | 4.02 ± 0.17 | 3.24 ± 0.24 |
| LUM3198 | 149 | 100–150 | 1.06 ± 0.06 | 2.82 ± 0.15 | 2.91 ± 0.15 | 6 ± 4 (2.1) | 4.10 ± 0.17 | 3.31 ± 0.24 |
| LUM3191 | 380 | 100–150 | 1.00 ± 0.05 | 2.66 ± 0.14 | 2.79 ± 0.14 | 6 ± 4 (2.6) | 3.96 ± 0.17 | 3.13 ± 0.23 |
| LUM3192 | 434 | 100–150 | 0.91 ± 0.05 | 2.72 ± 0.14 | 2.83 ± 0.14 | 6 ± 4 (4.2) | 3.92 ± 0.16 | 3.15 ± 0.24 |
| LUM3193 | 462 | 100–150 | 1.13 ± 0.06 | 3.27 ± 0.17 | 2.87 ± 0.14 | 6 ± 4 (6.6) | 4.05 ± 0.17 | 3.26 ± 0.24 |
| LUM3194 | 480 | 100–150 | 1.31 ± 0.07 | 4.30 ± 0.22 | 2.82 ± 014 | 6 ± 4 (9.5) | 4.12 ± 0.17 | 3.32 ± 0.24 |
| LUM3195 | 511 | 63–100 | 1.88 ± 0.10 | 6.95 ± 0.35 | 2.61 ± 0.13 | 13 ± 3 (14) | 4.14 ± 0.17 | 3.20 ± 0.22 |
| LUM3196 | 532 | 63–100 | 2.24 ± 0.12 | 8.01 ± 0.41 | 2.34 ± 0.12 | 13 ± 3 (15) | 4.07 ± 0.17 | 3.10 ± 0.20 |
. Results and Discussion
Performance tests and ages of quartz OSL
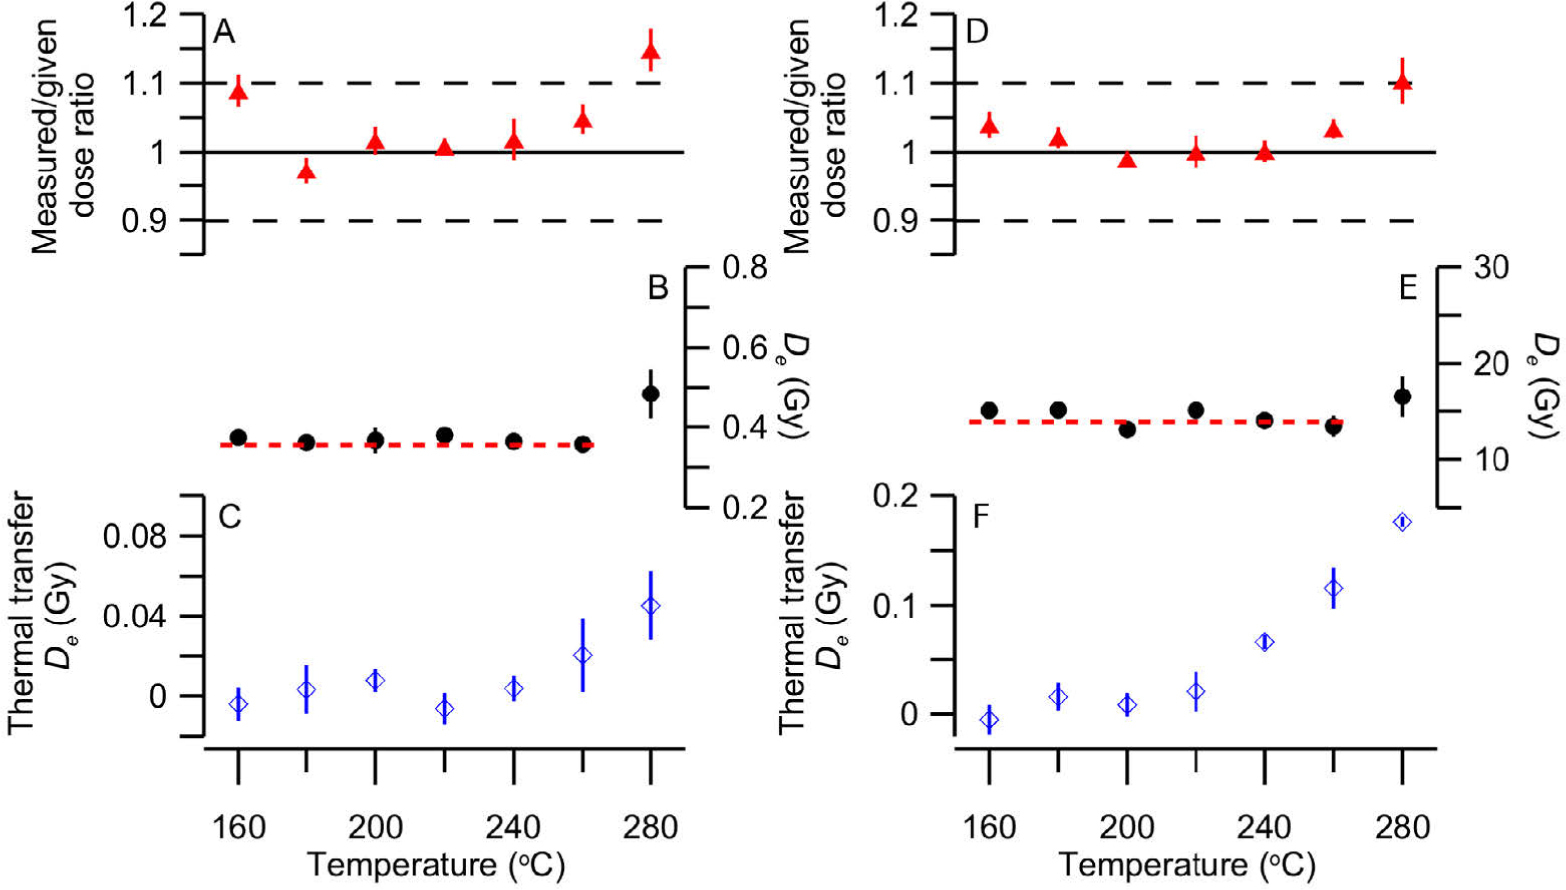
To determine the most appropriate preheat temperature for the De measurements, the pre-tests including the preheat plateau, dose recovery and thermal transfer tests were conducted on two presentative samples LUM3192 and LUM3196 prior to De measurement. The applicability of preheat temperatures between 160°C and 280°C with an interval of 20°C using the SAR protocol was tested with three aliquots for each preheat temperature. The cutheat temperature was fixed at 160°C suggested for dating young samples by Madsen and Murray (2009). The preheat plateau test was applied to observe the conditions of sensitivity change at different preheat temperatures. Aliquots for the dose recovery and thermal transfer tests were bleached using blue light emitting diodes (LEDs) at room temperature for 300 s before pausing 10000 s and then stimulated for 300s to bleach the natural signals prior to the measurements. The bleached aliquots for the dose recovery test were subsequently given a known beta dose (1.35 Gy for LUM3192 and 16.3 Gy for LUM3196) and measured using the SAR protocol. In the thermal transfer test, Des of bleached aliquots were measured to find out the contribution of transfer of charge into the OSL trap due to the preheating. Constrained by the acceptable range (0.9–1.1, Fig. 3A and 3D) of the dose recovery ratios and the De preheat plateau between 160 and 260°C for both two samples (Fig. 3B and 3E), as well as the negligible thermal transfer for the preheat temperatures lower than 240°C (Fig. 3C and 3F), a preheat temperature of 180°C was selected for the quartz De measurement for all eight samples.
Fig. 3
Results of quartz OSL pre-tests. (A) Measured/given ratio (dose recovery test), (B) equivalent dose and (C) thermal transfer at different preheat temperatures for sample LUM3192. (D)–(F) show the results of the same set of tests for sample LUM3196.
Aliquots out of the acceptable ranges (0.9–1.1) of the recycling ratio, recuperation (Wintle and Murray, 2006) and OSL IR depletion ratio (Duller, 2003) were rejected prior to the De determination. Recycling ratios of all 192 aliquots have a mean value of 1.00 with standard deviation of 0.06. Nine of 179 employed aliquots have recuperation values larger than 5%. Nevertheless, mean recuperation values for all samples are below 2%, suggesting that the undesirable transfer of charge was negligible in quartz measurements. The mean OSL IR depletion ratio of all aliquots is 0.98 with a standard deviation of 0.06. For most measured aliquots, the OSL IR depletion ratios are satisfactory, which suggests that the contribution of feldspar OSL signal is negligibly small.
Typical decay and dose response curves for both sand sample (LUM3191) and sandy soil sample (LUM3196) are shown in Fig. 4. A clear decay of natural quartz OSL signal for each sample was observed. All the samples yielded detectable quartz OSL signal. The dose response curves of upper six samples were fitted by a linear function, and those of two sandy soil samples were fitted by one single saturating exponential function. The distributions of De values and the overdispersion value (σOD) which were calculated using the central age model (Galbraith et al., 1999) indicate that employed materials were uniformly bleached owing to the centralized distributions of De values. The mean De values for the six dune samples range between 0.28 ± 0.01 to 0.42 ± 0.01 Gy, and those for the lowermost two sandy soil samples are 4.69 ± 0.14 Gy and 15.3 ± 0.3 Gy, respectively (Table 3).
Fig. 4
Quartz decay curve, dose response curve and De distribution for sample LUM3191–(A) and (B); for sample LUM3196–(C) and (D). De distributions are presented using abanico plots (Dietze et al., 2016).
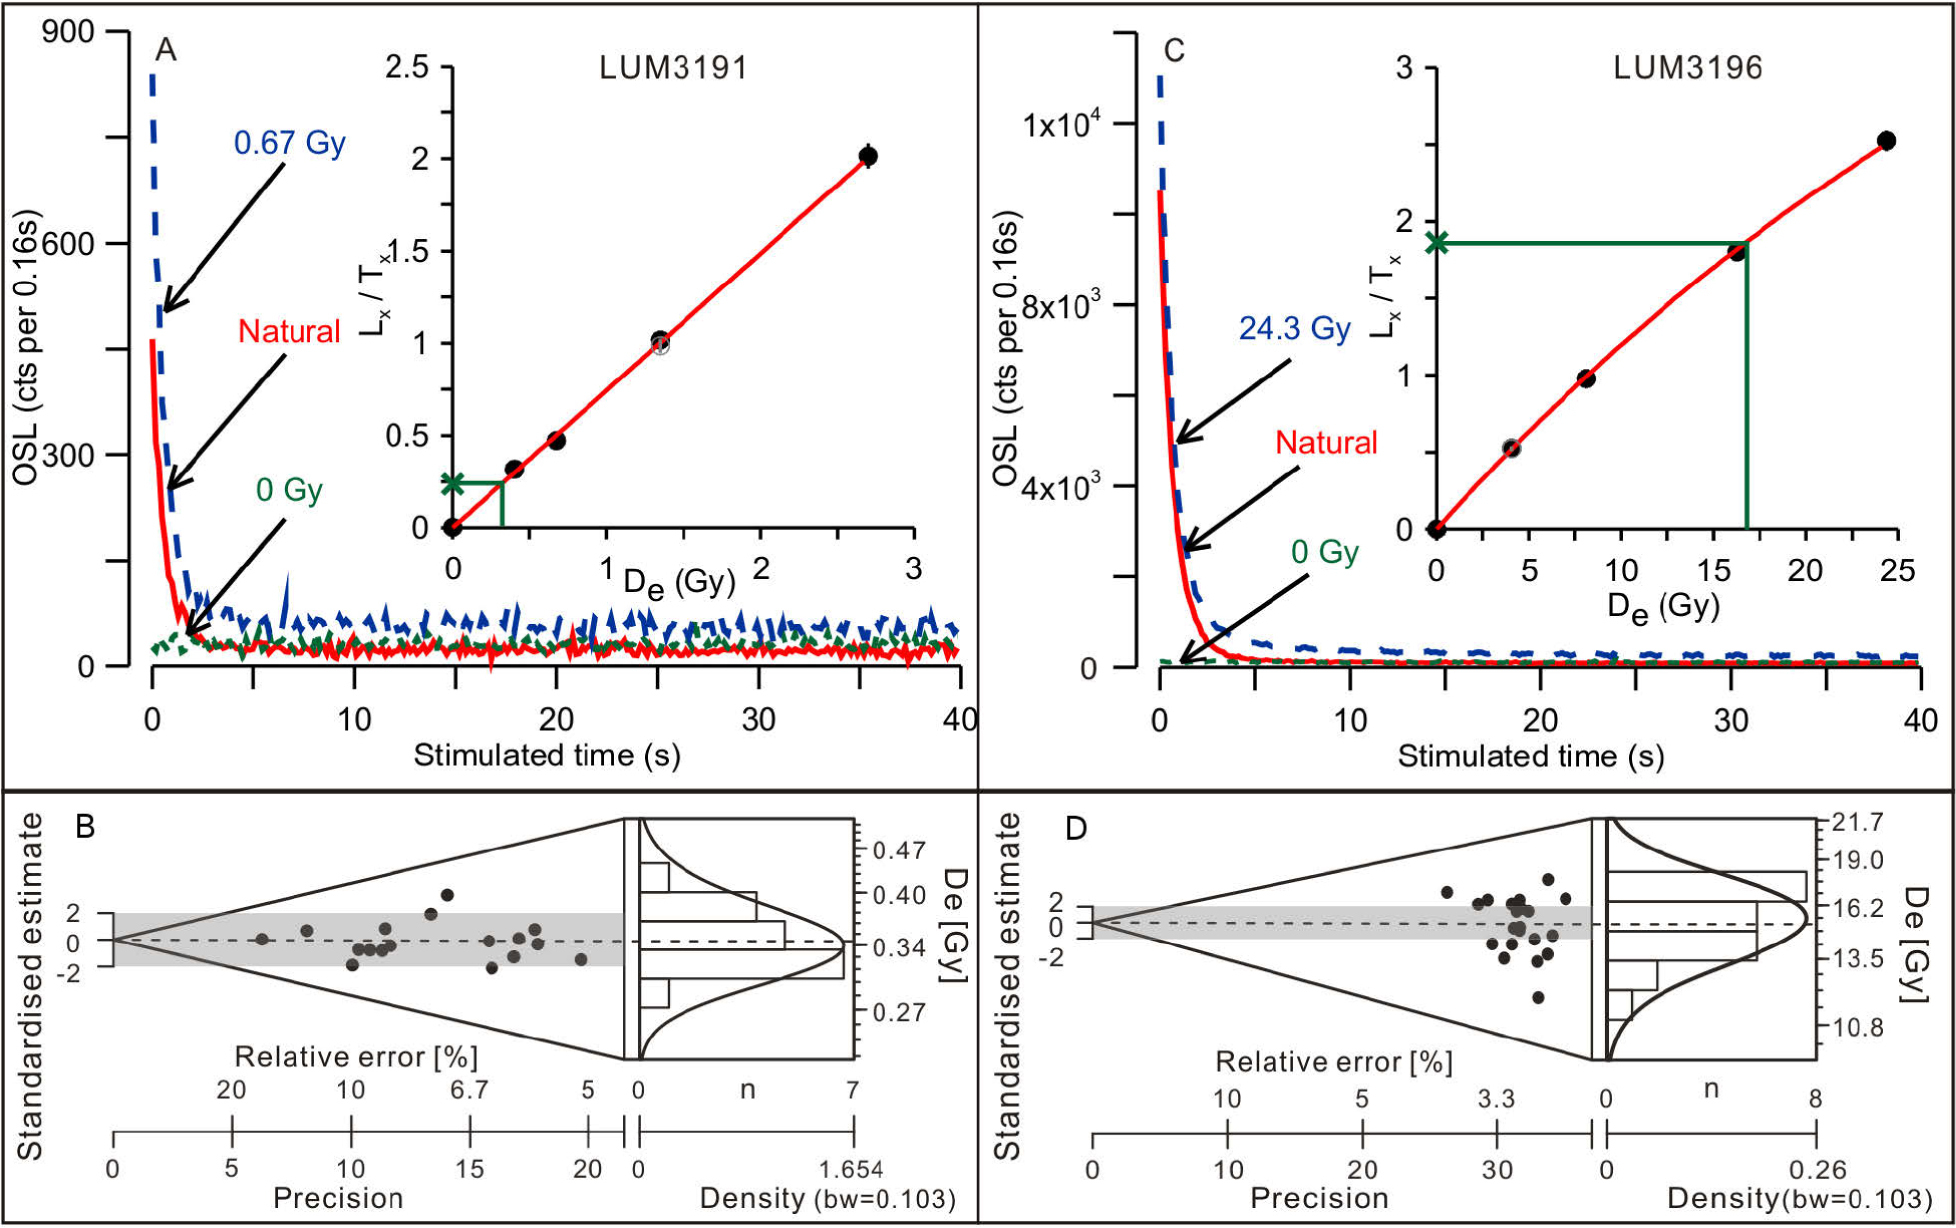
Table 3
Result of OSL dating
| Feldspar | ||||||||||||||
|---|---|---|---|---|---|---|---|---|---|---|---|---|---|---|
| LumNo. | Depth (cm) | Quartz | pIRIR150 | IR50 | ||||||||||
| (cm) Dose rate (Gy/ka) | De (Gy) | Age (a) | σOD (%)a | Dose rate (Gy/ka) | De (Gy) | g2days (%/decade) | Age (a) | Corrected age (a) | De (Gy) | g2days (%/decade) | Age (a) | Corrected age (a) | ||
| 3197 | 80 | 3.24±0.23 | 0.28±0.01 | 87±7 | 6.3 | 4.02±0.17 | 0.81±0.05 | 0.99±0.38 | 202±15 | 214±21 | 0.34±0.01 | 8.38±0.59 | 85±4 | 145±13 |
| 3198 | 149 | 3.31±0.24 | 0.28±0.01 | 85±7 | 4.4 | 4.10±0.17 | 0.88±0.06 | 1.96±0.41 | 215±18 | 243±26 | 0.35±0.01 | 9.23±0.64 | 86±5 | 159±18 |
| 3191 | 380 | 3.13±0.23 | 0.34±0.01 | 110±9 | 6.6 | 3.96±0.17 | 0.68±0.03 | 0.38±0.28 | 173±10 | 177±14 | 0.38±0.01 | 9.18±0.52 | 96±5 | 178±17 |
| 3192 | 434 | 3.15±0.23 | 0.36±0.01 | 115±9 | 5.9 | 3.92±0.16 | 0.74±0.03 | 1.11±0.39 | 189±12 | 203±17 | 0.39±0.01 | 9.30±0.54 | 100±4 | 187±17 |
| 3193 | 462 | 3.26±0.24 | 0.37±0.01 | 114±9 | 12.5 | 4.05±0.17 | 0.66±0.03 | 0.44±0.31 | 164±9 | 168±13 | 0.39±0.01 | 9.36±0.74 | 96±5 | 181±21 |
| 3194 | 480 | 3.31±0.24 | 0.42±0.01 | 128±10 | 6.7 | 4.12±0.17 | 0.60±0.05 | 0.62±0.42 | 145±13 | 151±17 | 0.46±0.03 | 7.80±0.74 | 111±8 | 186±25 |
| 3195 | 511 | 3.19±0.22 | 4.69±0.14 | 1470±110 | 12.3 | 4.14±0.17 | 5.77±0.24 | 0.25±0.41 | 1390±80 | 1430±120 | 4.28±0.18 | 4.99±0.26 | 1040±60 | 1500±120 |
| 3196 | 532 | 3.08±0.21 | 15.3±0.3 | 4970±350 | 10.1 | 4.07±0.17 | 22.1±1.7 | 0.80±0.28 | 5420±470 | 5760±620 | 14.1±0.4 | 4.45±0.19 | 3480±180 | 4950±350 |
a σOD values were calculated according to Galbraith et al. (1999).
The quartz ages are calculated by dividing the De by the dose rate. The quartz ages of the sand samples range from 85 ± 7 to 126 ± 10 a, and are consistent with the relative stratigraphic order of the sand dune taking the uncertainties into account. The lowermost two sandy soil samples yielded OSL ages of 1.5 ± 0.1 ka and 5.0 ± 0.4 ka.
Feldspar luminescence characteristics and ages
De measurements and apparent ages
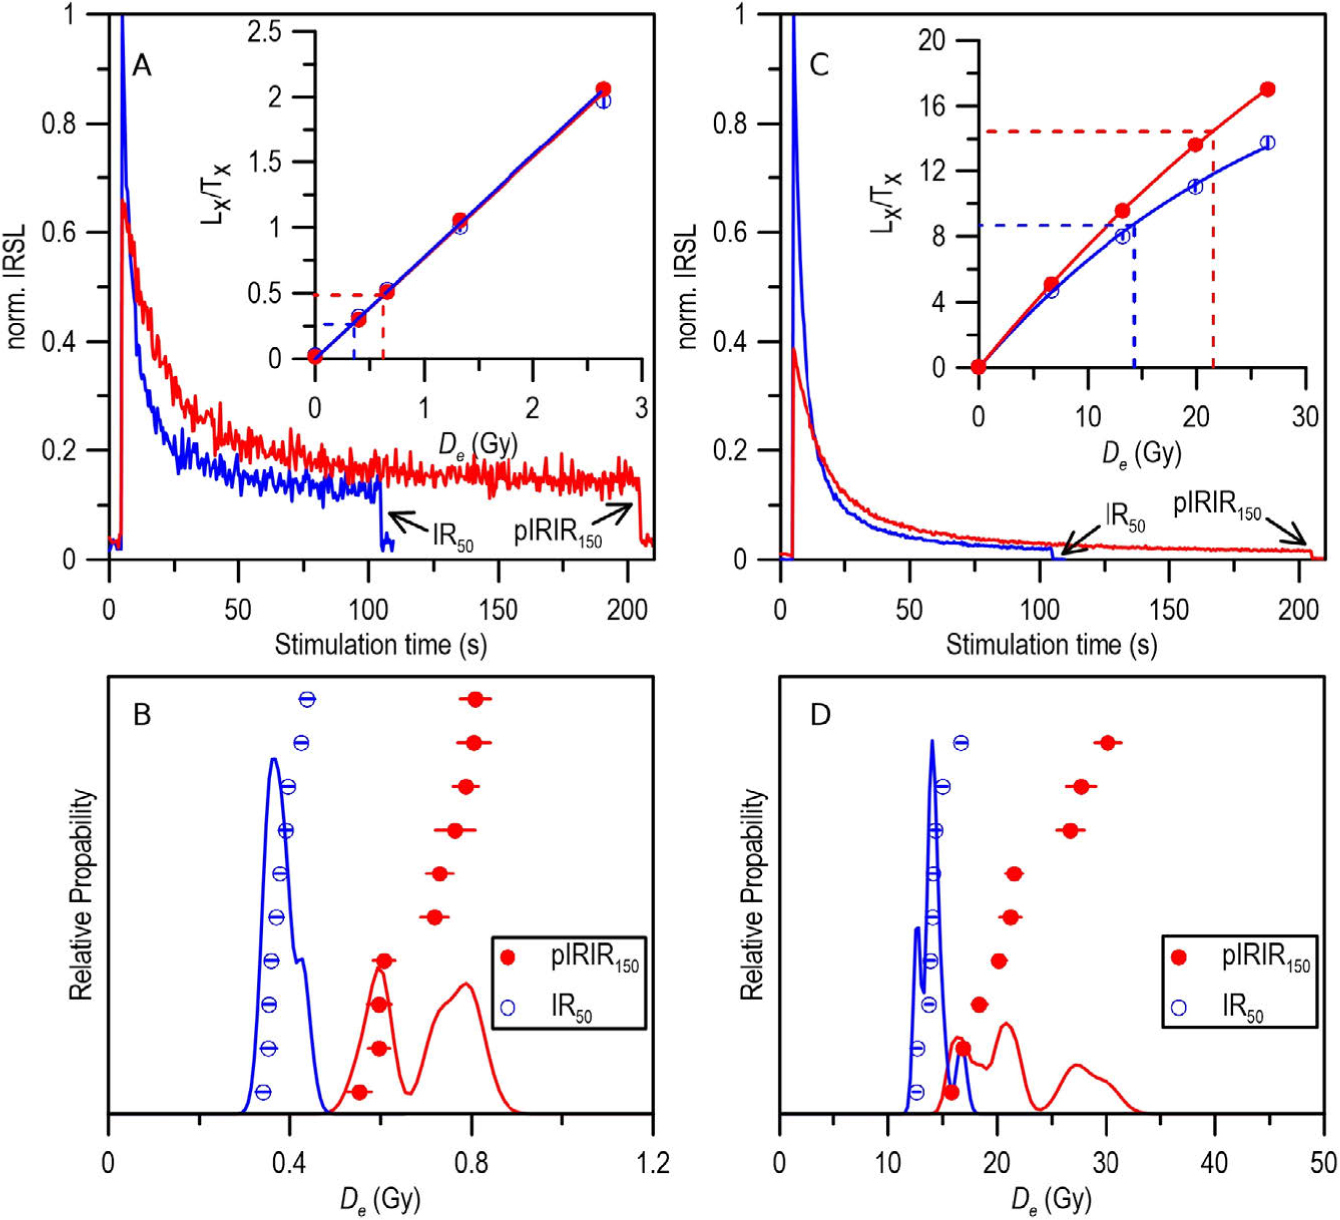
Representative decay curves and dose response curves of two samples are shown in Fig. 5. The dose response curves of the young sand samples are fitted by linear function, and those of the two sandy soil samples are fitted by single saturating exponential function. Recycling ratios of all aliquots are satisfactory within the acceptable range (0.9–1.1), and almost all of the recuperation values are below 6%. The IR50 and pIRIR150 De distributions of one young sand sample (LUM3191) and one sandy soil sample (LUM3196) are shown in Fig. 5B and Fig. 5D. It demonstrates that the overdispersion values are generally smaller than 20% according to the central age model (Galbraith et al., 1999). The IR50 Des change between 0.34 ± 0.01 and 0.46 ± 0.03 Gy for sand samples. Two sandy soil samples yield IR50 De values of 4.28 ± 0.18 and 14.1 ± 0.4 Gy respectively. The pIRIR150 Des range from 0.66 ± 0.05 to 22.1 ± 1.7 Gy, whereas the pIRIR150De of sand samples among them are between 0.66 ± 0.05 and 0.88 ± 0.06 Gy. The feldspar ages were subsequently calculated based on the De and the feldspar dose rate for each sample. The apparent IR50 ages of sand samples vary from 85 ± 4 to 111 ± 8 a, and the pIRIR150 ages are between 145 ± 12 and 215 ± 18 a. Two sandy soil samples yield IR50 ages of 1.03 ± 0.06 ka and 3.47 ± 0.18 ka, and pIRIRi50 ages of 1.39 ± 0.08 ka and 5.42 ± 0.47 ka (Table 3).
Fig. 5
K-feldspar IR50 and pIRIR150 decay curve, growth curve and De distribution for sample LUM3191–(A) and (B), for sample LUM3196–(C) and (D).
The applicability of the pIRIR150 protocol on the samples in this study was checked utilizing dose recovery and residual dose tests. Six aliquots of each sample were bleached for 4 hours in the Hönle SOL2 solar simulator. Three aliquots were measured using the pIRIR150 protocol after given a beta dose close to the equivalent dose from De measurement. The other three aliquots were measured to determine the residual dose. The dose recovery ratio was calculated by dividing the measured dose by the given dose after subtraction by the residual dose. The IR50 dose recovery ratios vary from 0.97 ± 0.01 to 1.01 ± 0.01, and those of the pIRIR150 signal are between 0.85 ± 0.13 and 0.97 ± 0.05. The IR50 and pIRIR150 dose recovery ratios for all samples are satisfactory taking uncertainty into account, whereas the pIRIR150 dose recovery ratio has a tendency of underestimation especially for two young sand sediments, i.e. LUM3193 and LUM3198. However, the pIRIR150 protocol can generally recover the natural dose effectively. The IR50 residual doses are generally below 0.05 Gy except that of LUM3196, in a lower level compared with those of pIRIR150 signal, which vary from 0.05 ± 0.01 to 0.34 ± 0.02 Gy (Fig. 6; Table 4). It should be noted that these residual doses were measured to calculate the dose recovery ratio, because the given dose for the dose recovery test was added on top of the residual dose, and therefore the recovered dose should be calculated after subtracting the residual dose. Since we do not know the natural bleaching condition before burial, the measured residual doses were not subtracted from the De values.
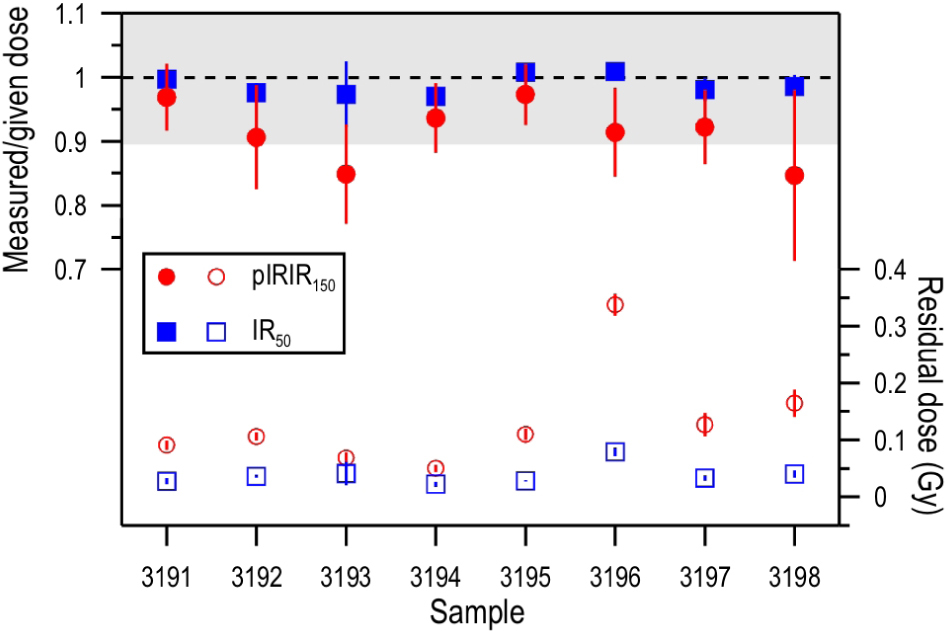
Table 4
Summary of predicted residual dose and measured residual dose (4 h SOL2 bleaching).
Fading correction
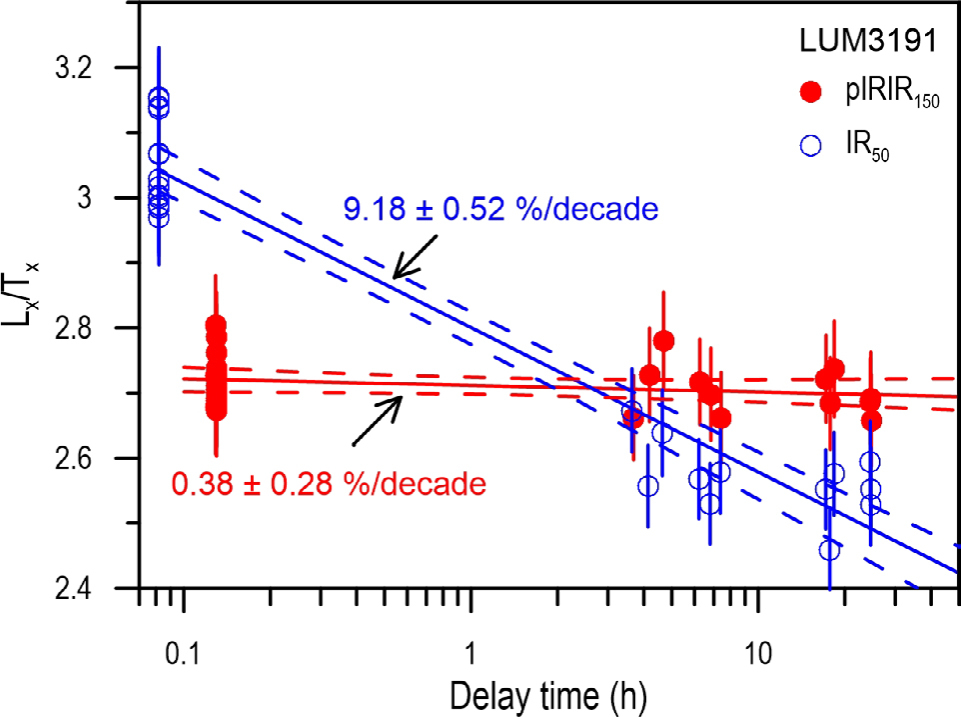
A fading test following Auclair et al. (2003) was carried out for all eight samples with 3 aliquots of each sand sample and 6 aliquots of each sandy soil sample (Fig. 7). The given dose in the fading experiment was close to the pIRIR150 equivalent dose. The delay time for pIRIR150 fading vary from a minimum of 0.13 h to a maximum of 24.7 h, whereas that for IR50 fading range between 0.06 h and 24.7 h. According to Huntley and Lamothe (2001), the g2days values were calculated (Table 3) and subsequently utilized for age correction. The g2days of IR50 signal vary from 4.45 ± 0.19 to 9.36 ± 0.74%/decade. The g2days values are much larger for the young sand samples (from 7.80±0.74 to 9.36 ± 0.74%/decade) than for the sandy soil samples (from 4.45 ± 0.19 to 4.99±0.26%/decade). The pIRIR150 g2days values are between 0.25 ± 0.41 and 1.96 ± 0.41%/decade, and most of the pIRIR150 g2days values are around or below 1%/decade, significantly lower than those of the IR50 signal. Based on the fading rates and the correction model following Huntley and Lamothe (2001), we thus corrected the apparent ages which are shown in Table 3. The corrected IR50 ages of 145 ± 13 a to 186 ± 25 a and the corrected pIRIR150 ages of 151 ± 17 a to 243 ± 26 a for sand samples were yielded. We calculated the corrected pIRIR50 ages of 1.43 ± 0.12 ka and 5.76 ± 0.62 ka, and the corrected IR50 ages of 1.50 ± 0.12 ka and 4.95 ± 0.35 ka for two sandy soil samples.
Comparison of quartz and feldspar ages
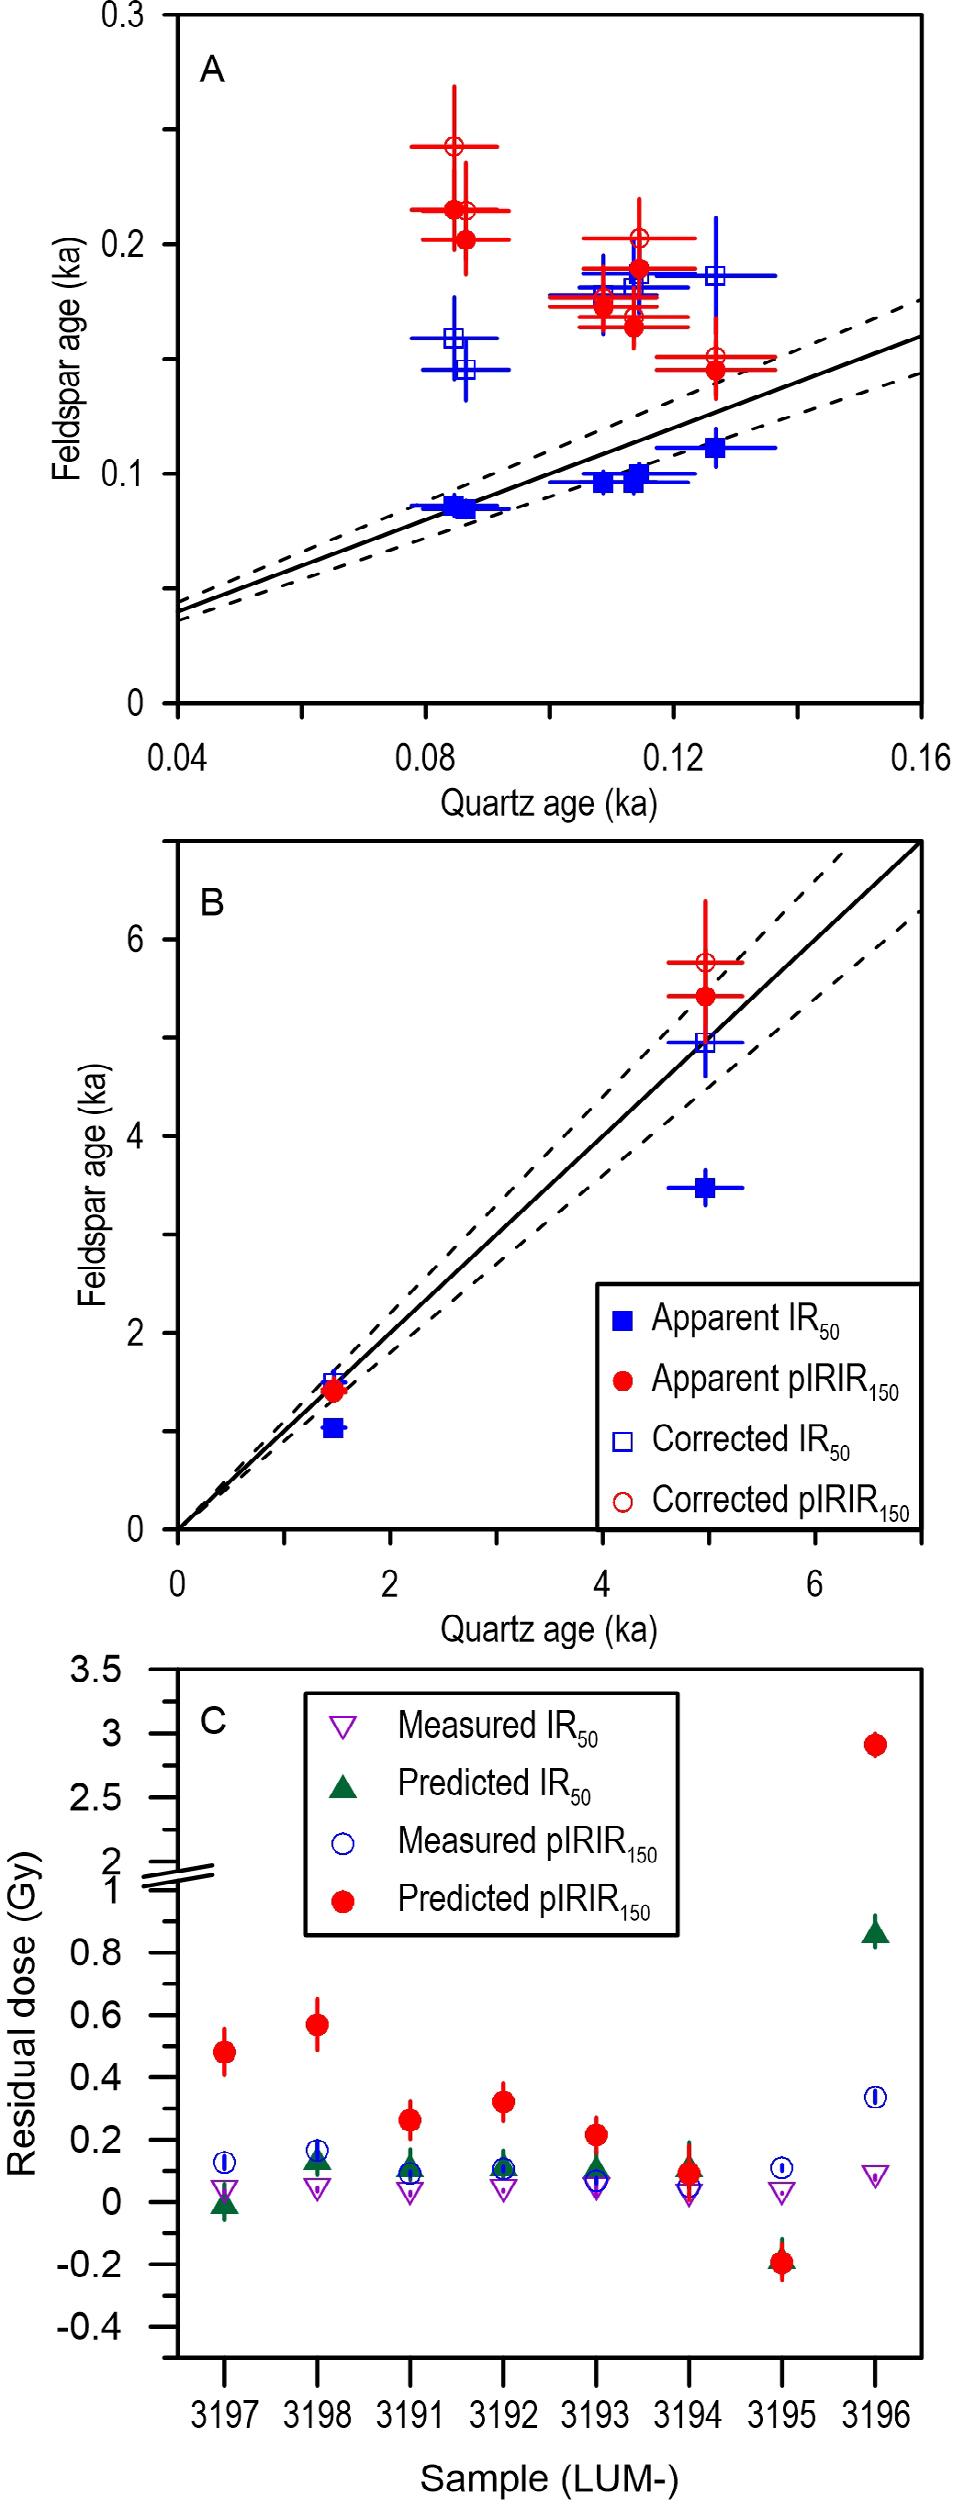
The comparison of ages from quartz OSL, feldspar IR50 and pIRIR150 signals are shown in Fig. 8A and 8B. In Fig. 8A, the apparent IR50 ages for the six sand samples are consistent with quartz ages, whereas the fading corrected IR50 ages are much older than the associated quartz ages. However, two sandy soil samples shown in Fig. 8B yielded the opposite results. The fading corrected IR50 ages are in agreement with quartz ages, while the apparent IR50 ages underestimated the quartz ages. The fading rates obtained from the fading experiment demonstrate that the sand samples (LUM3191-LUM3194, LUM3197-LUM3198) faded more significantly (g2days values between 7 and 10%/decade) than the sandy soil samples (LUM3195-LUM3196; g2days values from 4 to 5%/decade). The fading rates of pIRIR150 signal are much smaller than those of IR50 signal, generally around or below 1%/decade. Similar fading behaviours have been observed in previous studies (e.g. Reimann et al., 2011; Long et al., 2014. Fig. 7). One exception is sample LUM3198, yielding a fading rate of 1.96 ± 0.41%/decade, reveals more significant fading. The fading corrected pIRIR150 ages for the sand samples following Huntley and Lamothe (2001) are much older than the corresponding quartz ages, whereas those for sandy soil samples are consistent with quartz ages.
Fig. 8
Ages from different luminescence signals and the comparison of the predicted and measured residual doses. A shows the comparison for the sand samples, B shows the comparison for two sandy soil samples. C demonstrates the comparison of the predicted residual dose and measured dose for all samples (See details in text).
Compared with the pIRIR signals with high thermal treatment (stimulated at 225 or 290°C), the pIRIR150 signal has an advantage of faster bleaching for dating some young deposits during the Holocene (Reimann et al., 2011; Madsen et al., 2011; Reimann and Tsukamoto, 2012). To determine the applicability of the residual subtraction by artificial bleaching of natural aliquots using solar simulator and to understand the bleaching condition before burial, we exploit the quartz OSL ages as reference, to calculate the predicted feldspar De following Zhang et al. (in prep.).
We conducted the reverse derivation to simulate the natural growth of the pIRIR150 and the associated IR50 signals concerning the anomalous fading using the reference (quartz) age, the feldspar dose rate and the fading rate (Kars et al., 2008). The fading rate, feldspar dose rate and measured De are the input parameters. The reverse derivation was first conducted to simulate the natural growth of the IR and pIRIR signals (Kars et al., 2008). The natural trap filling was subsequently calculated according to the reference age and employed for natural De determination combined with the natural growth. The predicted residual dose was calculated by subtracting the measured De by the associated predicted natural De (Table 4; Fig. 8C). The predicted residual dose should be close to the unbleachable residual if the feldspar the IR50 and pIRIR150 signals were completely bleached before burial. For the sand samples the predicted pIRIR150 residual dose range from 0.09 ± 0.09 to 0.57 ± 0.08 Gy (i.e.23 ± 23 to 140 ± 20 a), whereas the measured pIRIR150 residual doses after 4 h bleaching in the solar simulator are between 0.05 ± 0.01 and 0.16 ± 0.02 Gy corresponding to 13 ± 3 to 40 ± 5 a, which are smaller than the predicted values. The predicted IR50 residual doses vary from 0.00 ± 0.06 to 0.14 ± 0.06 Gy (0 ± 15 to 35 ± 15 a), whereas the measured IR50 residual doses are between 0.02 ± 0.00 and 0.04 ± 0.02 Gy (~5 to 10 ± 5 a). The difference between the predicted and measured residual doses for the IR50 signal are smaller than that of the pIRIR150 signal, because the IR50 signal bleaches much faster that the pIRIR150 signal. The predicted pIRIR150 residual dose of 2.91 ± 0.09 Gy and IR50 residual dose of 0.87 ± 0.05 Gy for sample LUM3196 are much larger than the measured residual doses. However, the apparent and fading corrected pIRIR150 ages and fading corrected IR50 age are in agreement with the quartz OSL age, because the residual dose of ~1–3 Gy for this sample is close to the uncertainty of the De values. The sandy soil sample LUM3195 yields negative predicted pIRIR150 and IR50 residual doses of -0.19 ± 0.06 and -0.18 ± 0.06 Gy, while the corresponding measured residual doses are 0.11 ± 0.01 and 0.03 ± 0.00 Gy. The negative values of residual doses are not expected, and this was probably caused by the slight underestimation of the fading rate. But the close-to-zero predicted residual doses of this sample suggest that this sample should have been completely bleached before burial.
The measured residual doses are generally smaller than the predicted residual doses except sample LUM3195, indicating that the natural exposure was less than the equivalent time to 4 h of SOL2 bleaching. The offsets obtained from the difference between the predicted and the measured pIRIR150 residual doses are ~0.04–0.40 Gy (~10–100 a) for sand samples and ~2.57 Gy (~630 a) for the sandy soil sample LUM3196, which should cause the overestimation of several tens of percent for sand samples and of ~10% for the old sandy soil sample, if the measured residual dose is subtracted from the De value. We conclude that the use of the measured residual subtraction is not appropriate. Furthermore, it demonstrates that the effect of residual component, which is several tens of percent of the measured dose is significant for sand samples younger than 1000 a, whilst the offset of ~10% for the sandy sample becomes insignificant which is roughly equal to the uncertainty of the measured equivalent dose.
Chronology and cause of sand dune accumulation
All OSL ages were calculated in years (a) before 2015 (Table 2). All ages derived from the OSL samples are stratigraphically consistent taking uncertainty into account. In the profile a clear boundary between yellowish and grey sand can be identified, but two samples above and below the boundary, LUM3192 and LUM3193, gave almost identical ages (115 ± 9 a and 114 ± 9 a, respectively), indicating the PJ sand dune accumulated successively in a short time interval. The high sedimentation rate for sand deposits and low sedimentary rate for sandy soil layer are observed (Fig. 9). Our results are consistent with the mid-Holocene chronostratigraphy presented by Li et al. (2014b) based on radiocarbon and OSL dates of samples from a 24.5 m-long core drilled in modern Liaodong coastal landward.
Fig. 9
Depth-age relationship of the PJ sand dune and sandy soil layer with a graphic log and all sample codes.
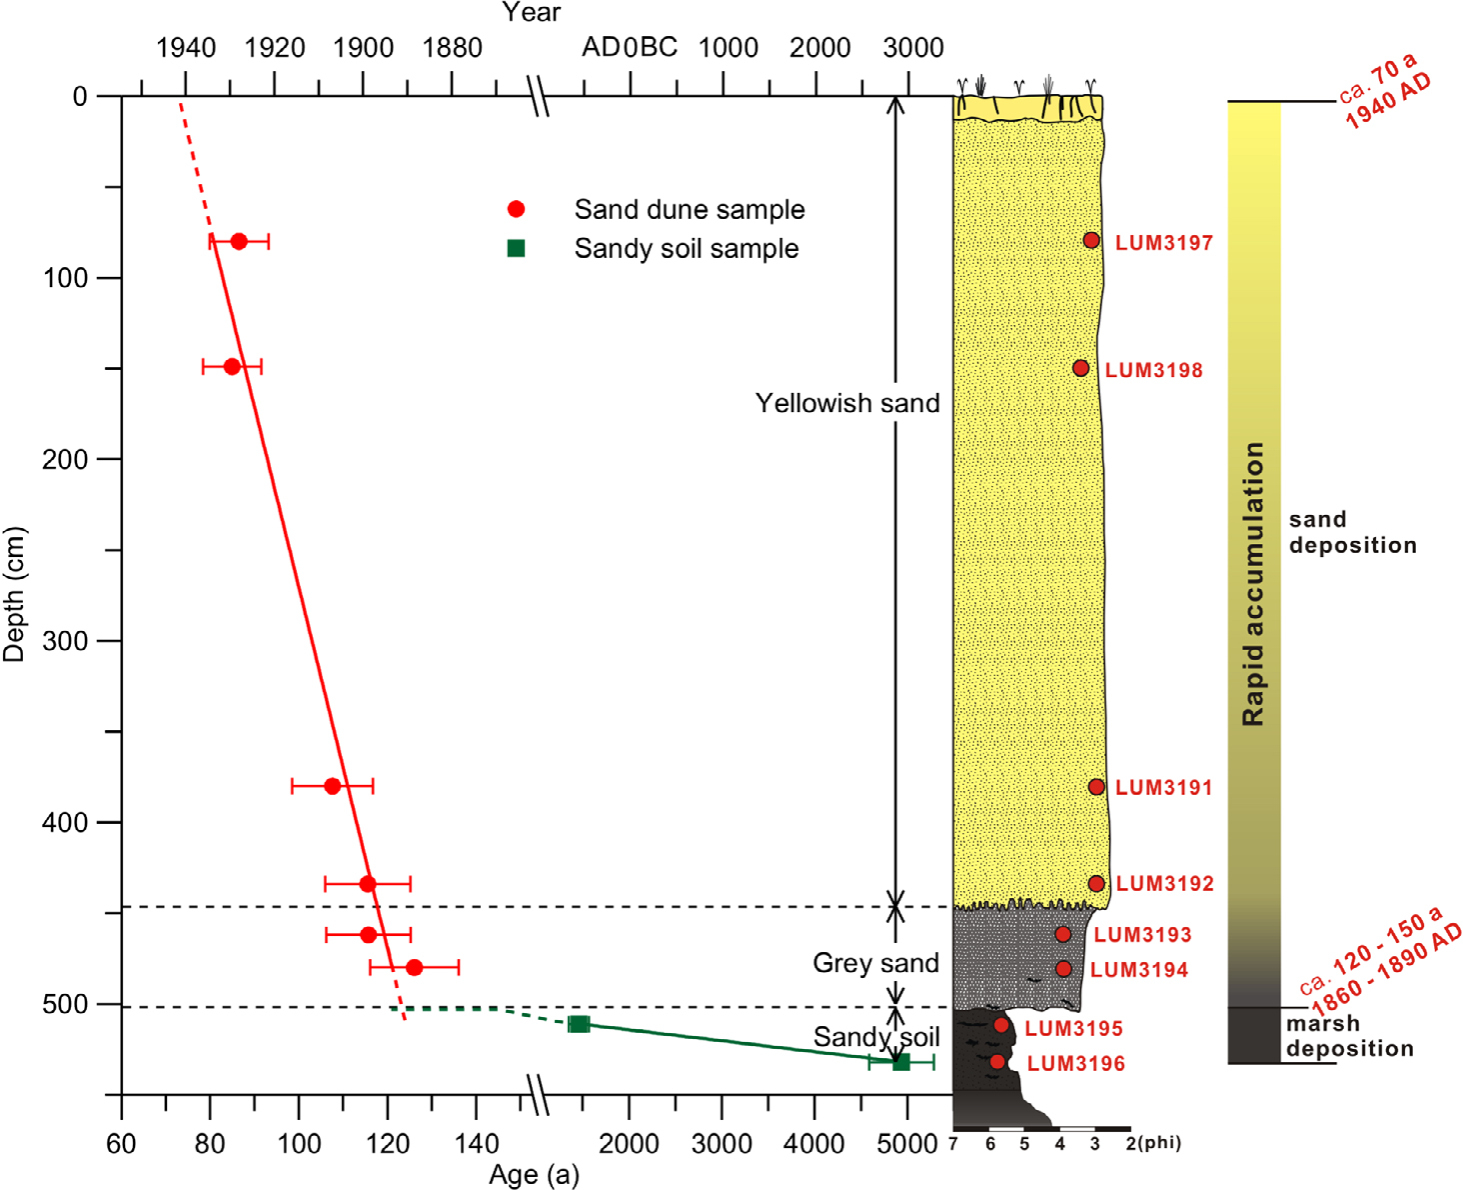
The possible depositional ages for the top and bottom of the sand dune were assumed by extrapolating the fitted age-depth relationship shown in Fig. 10. The results after the extrapolation show that the PJ sand dune accumulated from ca.120 a (1890 AD) to ca. 70 a (1940 AD). Although there are only two data points available, the age of the top of sandy soil was also estimated by an extrapolation, resulting in c. 150 a. It indicates that no major hiatus occurred during the transition of sandy soil to the sand dune.
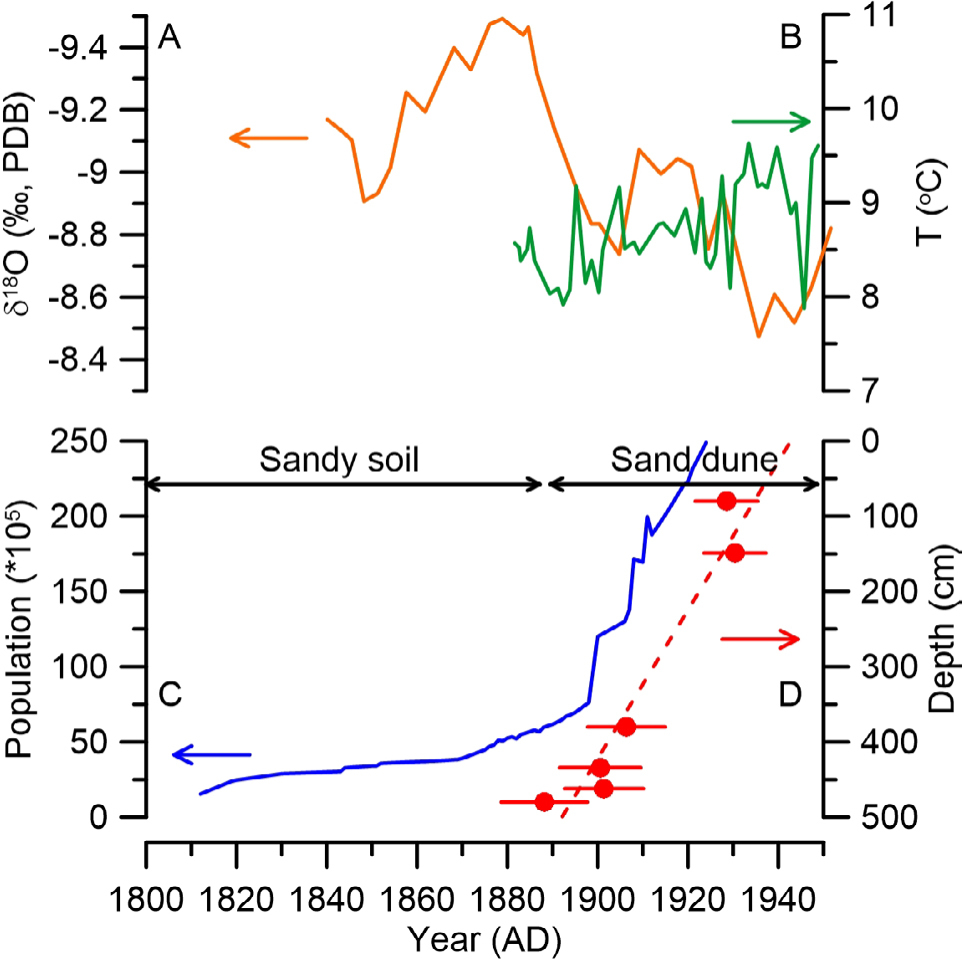
Fig. 10
Comparison of different proxies. (A) The precipitation variations in northern China revealed by the δ18O data from the Shihua Cave stalagmites record (Li et al., 1998; orange solid line). (B) Temperature change in Liaoning Province (Sun and Zhao, 2002; green solid line). (C) Population change in Northeastern China from 1812 to 1911 AD (blue solid line) summarized by Zhao (2004). (D) Quartz OSL ages for the sand deposits.
The Holocene transgression in the Liaodong coastal area was recorded by marine sediments with buried thicknesses of 6–15 m (Fu, 1988) and 7.85 m (Bing et al., 2013) in the modern Liao River and Daling River estuaries and c. 4.5 m (Ma, 2014; Li et al., 2014b) in this coastal lowland near the modern Liao River estuary. The Holocene transgression range has been distinguished based on 11 cores drilled in the LLP according to Fu (1988). Three paleo-coastlines since the late Pleistocene have been reconstructed by IOCAS (1985). The timing of the sea level rise in the LLP was determined by buried shells and peat using 14C (Fu, 1988; Ma, 2014) and OSL dating (Bing et al., 2013; Li et al., 2014b). These previous studies suggest that the location of the PJ sand dune was at the northern edge of the Holocene transgression and was covered by sea water at the sea level high-stand (Fig. 1), which occurred at 5–6 ka in the LLP (Fu, 1988). As a consequence of the sea level change during the Holocene, three main depositional units, lacustrine, marine and salt-fresh marsh deposits from early to late Holocene, can be distinguished based on stratigraphic characteristics and down-core distributions of benthic foraminifera, pollen, diatom and grain size from tens of cores drilled in the LLP (Fu, 1988; Ma, 2014; Li et al., 2014b). Using our new data we can compare the timing of sandy soil sedimentation and the sea level high-stand yielded from these previous work. The lowermost sample (LUM3196) provides an OSL age of 5.0 ± 0.4 ka, and the site is located in the northern edge of the postulated Holocene transgression. We infer that the sandy soil section in the studied site deposited after the sea level highstand. Furthermore, the sediments in this section consist of organic-rich material, soil aggregates and fine grains, constrained to the depositional unit of salt-fresh marsh as a consequence of sea level fluctuation during the sea level highstand. XRD analysis of soil aggregates larger than 250 μm from LUM3196 gave an approximate mineral composition of quartz (30%), feldspar (15%), vermiculite (30%) and amorphous component (25%). The rich vermiculite component is possibly related to a moderate weathering process and warm environment (Lu, 1997). Evidence from historical documents and archaeological records which were summarized by Lin (1980) and Xiao (2010) also proved that a paleo ‘Liao marsh’ had widely existed in the LLP since the beginning of the Hongshan Culture (5–6 ka) and perished at the end of Qing dynasty (1860–1912 AD).
More direct evidence is available from historical records of coastline migration (Lin, 1991) and research on recent coastline evolution over the past hundred years conducted by Chen et al. (2010). Three historical military maps were made in 1909 AD, 1932 AD and 1950 AD, demonstrating the coastline change of the Liaodong Bay shown in Fig. 1 (Chen et al., 2010). During this period, significant progradational process occurred in the LLP. The PJ sand dune accumulated rapidly at the same time (since c. 1890 AD), but it was c. 30 km far away from the coastal area.
Previous studies on the Little Ice Age (LIA) in China showed that the last sub-cooling period of the LIA occurred during 1840–1870 AD according to Zhu (1973) and 1830–1890 AD according to Wang and Wang (1990). Several sand deposits worldwide were correlated to the cold period in the last millennium based on accurate OSL chronology (e.g. Tamura et al., 2016, 2011; Hu et al., 2013). The mean annual temperature variation in northeastern China constructed by Wang et al. (1998) and temperature change in the Liaoning Province presented by Sun and Zhao (2002) indicate that the temperature was steadily increasing between 1880 AD and 1940 AD, indicating that the PJ sand dune accumulated during a warm period after the LIA. The oxygen isotopic record from speleothems for the last 500 years in Li et al. (1998) in northern China (Fig. 10) and the tree-ring record of the precipitation in southern Liao Plain indicate an overall increasing trend with several wet and dry cycles for the precipitation. According to pollen data and historical documents, land types in the LLP were meadow, marsh (wetlands) and river prior to sand deposition (Ma, 2014). From 1860 AD, the Qing government started to open northeastern China gradually, which had been blocked for almost 200 years before 1860 AD and only a few people from central China were allowed to move into this region. The amount of population increased gradually since 1860 AD, and dramatically increased after 1890s, as a result of Immigrant and Reclamation Policy. With the leap of population and traditional cultivation, the natural vegetation in the LLP was largely destroyed. It is most likely that this caused the significant changes in the landscape, resulting in and sand dune formation. Yang et al. (2012) presented a similar sand activation around 1800 AD in Horqin dunefield which was influenced by the Immigrant and Reclamation Policy. Three phases of land cultivation during the last 2300 years in the Mu Us desert were recognized by Sun (2000). Because the sand accumulated in the relatively warm and humid period after the Little Ice Age, we conclude that the accumulation of the PJ sand dune was mostly likely to be influenced by the Immigrant and Reclamation Policy carried out by the Qing government, not due to the climate change.
. Conclusions
A well-preserved sand dune in elapsed marine-terrestrial interacted area in northeastern China is studied in this paper. Based on the results, we conclude:
Using OSL ages of quartz, the chronology of the PJ sand dune and underlying sandy soil layer based on quartz ages was established: The sandy soil sediments deposited after 5.0 ± 0.4 ka at an extremely low sedimentary rate. The PJ sand dune accumulated from c.120 a (1890 AD) to c.70 a (1940 AD) at a high sediment accumulation rate. There is no major hiatus between sand dune and sand soil layer.
The quartz OSL chronology shows that the sandy soil layer formed after the sea level highstand in the Holocene. The sandy soil layer is recognized as a marsh deposition based on the characteristics of the containing organic-rich matter and soil aggregate. Combined with historical coastline change, the PJ sand dune is an inland sand dune instead of a coastal sand dune. Under a humid and warm climate period, the PJ sand dune was very likely impacted by human activity at the end of Qing dynasty but not due to the climate change.
The IR50 fading rates for six sand samples are between ~5 - 10%/decade, whilst he pIRIR150 fading rates are generally negligible. The fading corrected IR50 and pIRIR150 ages are overestimated for six sand samples, and consistent with the quartz ages for two sandy soil samples.
The predicted residual doses obtained from the quartz OSL ages are generally larger than the measured residual doses for our samples. The use of the measured residual dose for correction is not appropriate, because the true residual dose is highly dependent on the natural bleaching condition. The pIRIR150 dating is generally applicable for samples older than ~1000 a when the effect of residual dose becomes insignificant.