
. Introduction
It has been shown (Shotyk, 1996) that peat sediments are important archives for the reconstruction of the past environmental changes, induced naturally and by human activity. The Wolbrom fen has been investigated in the 1920’s by Trela (1928). Paleobotanical studies were undertaken again almost fifty years later by Latałowa (1976) and Obidowicz (1976) and once again in 1980’s by Latałowa and Nalepka. The paleobotanical anlysis was supplemented by 19 radiocarbon dates, however the resolution of the dating was low and the dated samples were mostly taken from the depth below 1 m (Latałowa and Nalepka, 1987).
Trace elements have been introduced to the environment by the human activity since the very beginning of mining, coal combustion, smelting and metallurgy (Martínez Cortizas et al., 2016; Nriagu, 1996; De Vleeschouwer et al., 2007). The presence of trace elements in the peat profile, e.g. lead and copper, which are supposed to be immobile in peat (Ali et al., 2008; MacKenzie et al., 1997; Vile et al., 1999) allows to trace and reconstruct the mining and metallurgical activity in the investigated area.
. Site description
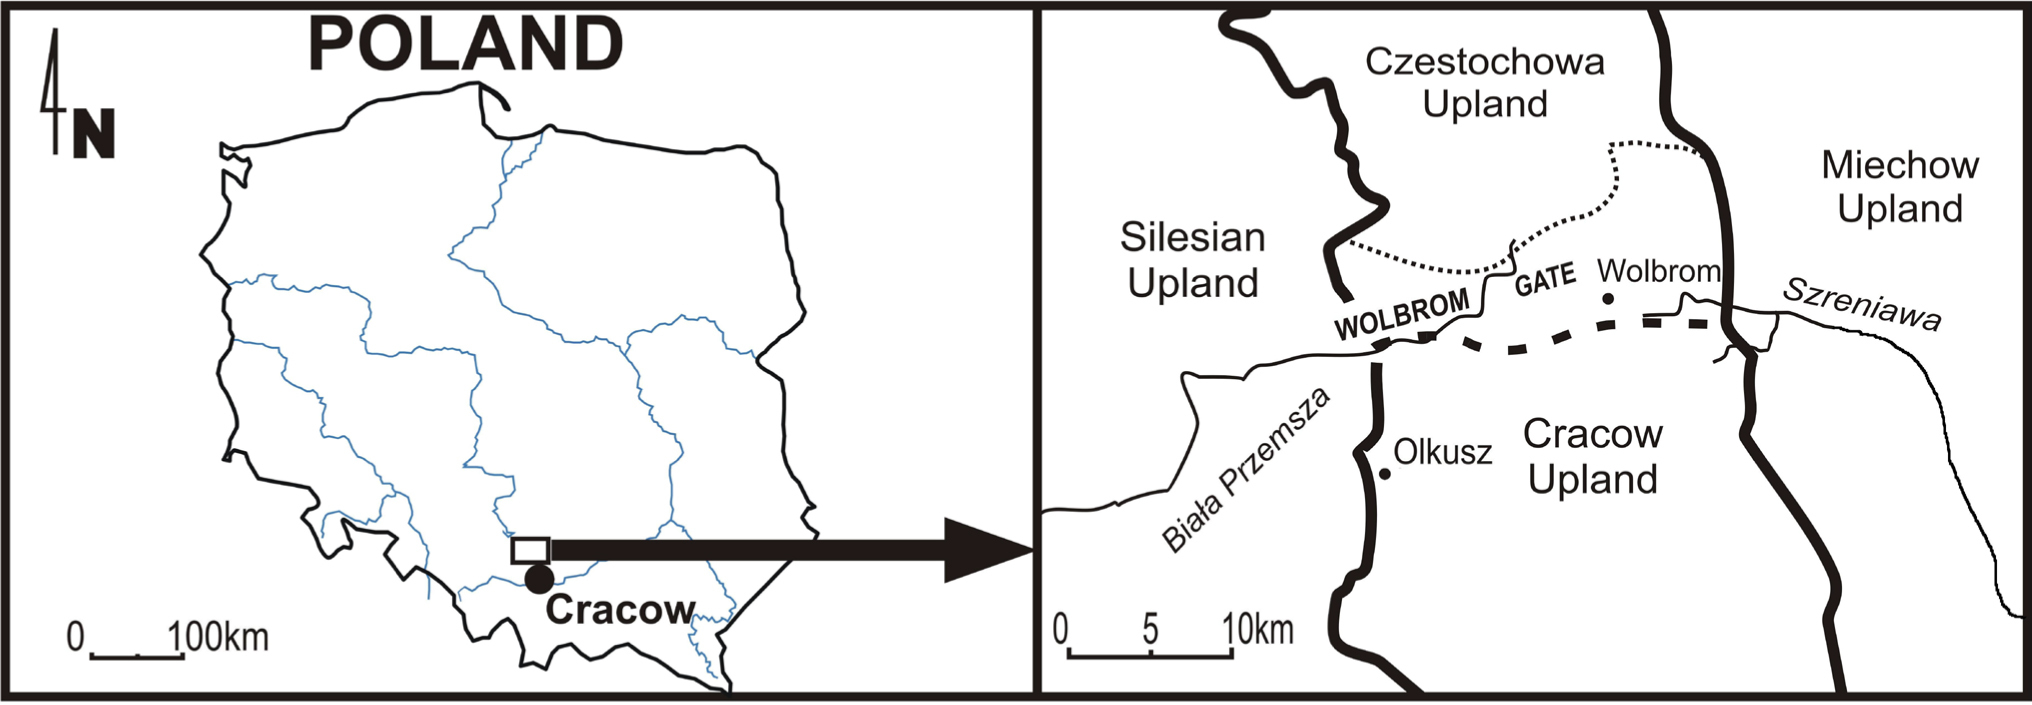
The fen in Wolbrom is located in the south of Poland, on the eastern part of Silesian-Cracovian Upland, in the Wolbrom Gate subregion (Kondracki, 2013). It is about 40 km N from Cracow (Fig. 1; 50° 22,636’ N, 19° 46,870’ E). The fen is oblong, about 1000 m long and 500 m wide. The climate is moderate, with mean annual temperature of ca. 7°C and predominance of westerly winds. The average annual precipitation is about 700 mm (Kruczała, 2000). As the result of atmospheric fallout, soils in this area are enriched in potentially toxic elements, including Pb – the concentration is between 25 and 50 ppm (see Lis and Pasieczna, 1995). The region suffers from deficiency of water. The drainage pattern is not very dense and the investigated fen is located on the watershed, between Szreniawa and Biała Przemsza rivers. In addition, this part of Silesian-Cracovian Upland is an area of Jurassic formations. It means that rain water accumulates in deep water-bearing strata (Nieć, 1997). A peat core was taken from the S-E part of the fen, from a different place than previously investigated.
. Sampling and research methods
Coring
A peat core was taken using Wardenaar peat sampler. The taken core was 105 cm long with a cross section of 15 cm × 15 cm (coordinates – see above). The upper 15 cm of the core was divided into 0.5 cm thick samples, the rest of the core was divided into 1 cm samples. Afterwards the samples were dried at 70°C. Subsequently, the samples for carbon-14 and lead-210 dating as well as for geochemical analysis were selected.
Botanical analysis
Four samples from every 25 cm of the peat core were taken for the analysis. The microscopic analysis of the botanical composition was conducted. On the base of it, the degree of decomposition and the type of peat were specified. In these analyses, standard methodology was used (see Maciak and Liwski, 1996; Maksimow, 1965; Myślińska, 2001; Tobolski, 2000). The botanical composition was specified by microscopic analysis, using comparative samples and literature (see Kac et al., 1977; Tobolski, 2000). First, the samples were washed on the 0.2 mm sieve in order to remove the humus substances. Afterwards every sample was divided into the three sub-samples, which were analysed under microscope (100–400 × zoom). Typological units of peat were defined on the base of genetic classification of Tołpa et al. (1967). The analyses were performed in the Faculty of Environmental Engineering and Land Surveying, in the University of Agriculture in Krakow.
14C dating
Fifteen samples were selected for radiocarbon dating using liquid scintillation counting technique. In order to remove carbonates the samples were treated with a 2% HCl solution at 80°C for 1 hour as standard procedure i.e. Acid-Alkali-Acid would dissolve the samples. After the pretreatment, samples were rinsed with deionized water and dried. Next, samples were converted to benzene in a vacuum line (Skripkin and Kovaliukh, 1998). The scintillation cocktails were prepared by adding 13 mg of butyl-PBD per 1 ml of benzene. 14C measurements were performed on two Quantulus 1220 and two ICELS (Theodórsson, 2005) systems. Quantulus 1220 spectrometers were set-up and calibrated according to Pawlyta et al. (1998). The ICELS systems were measuring 14C in the fixed energy balance counting mode (Tudyka and Pazdur, 2012) with simultaneous 214Bi/214 Po pairs counting for routine 222Rn contamination correction (Tudyka et al., 2015). Four LSC spectrometers allowed to reduce the possible systematic error. Radiocarbon dating was performed in the Gliwice Radiocarbon Laboratory.
210Pb dating
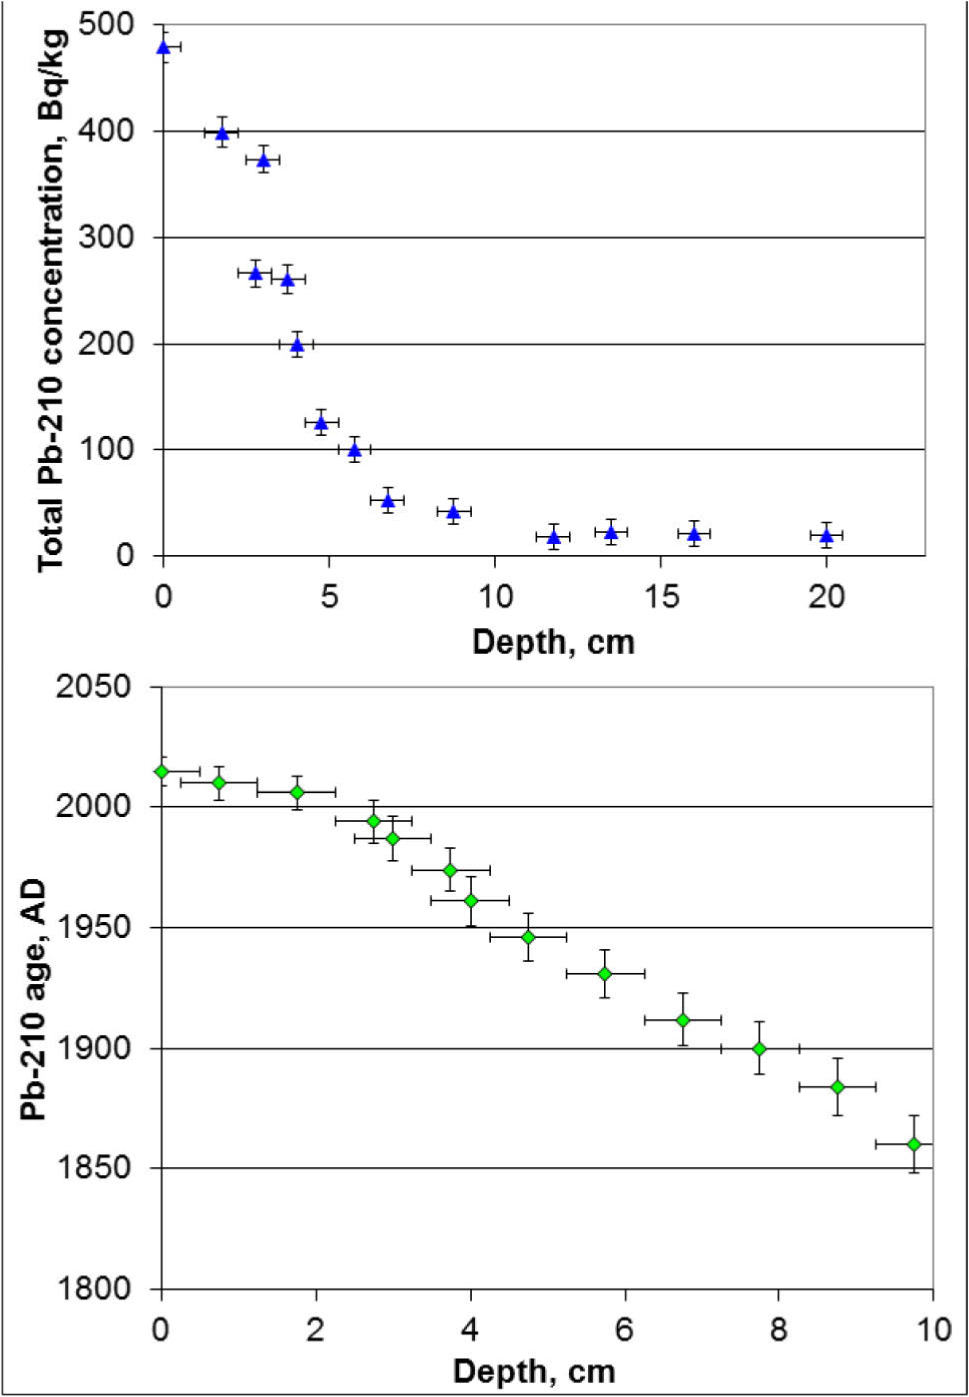
The samples were subjected to the chemical preparation in order to obtain sources for the measurement of alpha activity of 210Pb (see Sikorski and Bluszcz, 2003, 2008). After drying, the 14 samples were treated with a hot 65% nitric acid (90°C for 3 hours). Afterwards, the solution was centrifuged (5000 rpm, 10 min). Liquid solution was collected and treated with 30 ml of 30% H2O2 (to oxidise organic matter). After evaporation to dryness, every sample was treated with 35–38% hydrochloric acid and evaporated again. This step was repeated a few times in order to fully replace nitric acid by hydrochloric acid. Afterwards, polonium was deposited on a silver disc from 75 ml of a 0.5 M solution of hydrochloric acid, with addition of 0.4 g of hydroxyloamine and 0.4 g of sodium citrate, at 90°C. The radioactivity of polonium was measured using an alpha spectrometer (Canberra model 7401) with Passivated Implanted Planar Silicon (PIPS) Detector. The sensitive area of the detector was 300 mm2 and its energy resolution was ca. 20 keV. The preparation and the measurement were performed at the Gliwice Radioactivity Measurements Laboratory. Results of measurements of 210Pb concentration in the core and calculated 210Pb dates are presented in Fig. 2.
Geochemical analysis
The 54 analysed samples were homogenized, dried and then ground in an agate mortar. Samples prepared in this way were then heated to a temperature of 200°C for one hour to initially carbonize the organic matter and subsequently incinerated at a temperature of 450°C for four hours before being extracted using concentrated nitric acid. After evaporation to dryness in a water bath, the samples were combusted at 450°C for one hour and then treated with a hydrochloric acid solution (1:1) to remove carbonates (Karczewska and Kabała, 2008). Determination of the metals was carried out by means of Inductively Coupled Plasma Optical Emission Spectroscopy techniques at the Laboratory of the Institute of Environmental Engineering of Polish Academy of Sciences in Zabrze. The measurement uncertainties were estimated in accordance with the recommendations received from the laboratory and they are appropriate for the analysis of peat.
. Results
The botanical analysis showed that numerous remains of Carex and Phragmites were found. The peat was specified as highly decomposed in the upper part of the core and poorly decomposed in the lower part (Table 1). Because of its botanical composition the study area can be considered to be a fen (Tobolski, 2000).
Table 1
Results of botanical analysis.
Obtained results of radiocarbon measurements are presented in Table 2. All the results were calibrated using OxCal v4.2.4. (Bronk Ramsey and Lee, 2013) calibration program with application of IntCal13 (Reimer et al., 2013) and Bomb13 NH1 calibration curves. The table presents also intervals of modelled age calculated basing on an age-depth model described below.
Table 2
Results of radiocarbon dating of samples from Wolbrom site, W3 core.
At the beginning of analysing the results of radiocarbon dating we noticed that the sample from the depth 34–35 cm (sample W3 34-35, GdS-3132) is much younger than other samples from the neighboring context. We decided to reject this result from the further analysis assuming that the sample could be contaminated by younger organic material in situ (roots of present plants) or during collecting process. Therefore, we started the construction of the age-depth model from the analysis of 14 radiocarbon dates from depths from 4.5–5 cm to 104–105 cm and 12 210Pb dates appointed for the upper 10 cm of the sediment (see Fig. 2, without the date for 0 cm depth).
The chronology of this upper 10 cm of sediment is very well defined by twelve 210Pb dates and covers a time range since 1860 ± 12 AD (depth 9.75 cm) till now (date 2010 ± 7 AD at depth 0.75 cm). In good correspondence with this chronology is the radiocarbon date for a sample from the depth 4.5–5 cm (sample W3 4,5-5, GdS-3147). This date, after calibration using Bomb13 NH1 calibration curve gives two possible calendar dates – the first, the most probable result – an interval since 2004 AD till now and the second, pointing to year 1957 AD (see Table 2). This second option perfectly agrees with the lead date for the depth 4.75 cm, which is 1946 ± 10 AD.
The first radiocarbon date below the 210Pb chronology (W3 9,5-10, GdS-3212) is much older than the last date of this chronology and has radiocarbon age equal 1630 ± 65 BP (after calibration 95.4% interval is approx. 250–570 AD). Also, the next five samples from depths between 13 cm and 30 cm have been dated for calendar ages from a range 200–800 AD. It clearly shows that there is a hiatus in the core at about 10 cm. The cause of this hiatus may be an extraction of peat at the investigated fen. The group of dates directly below the hiatus (depths 10–30 cm) constitutes the most difficult to interpretation part of the chronology of the core. The radiocarbon dates have similar values and these, which occur near the hiatus, are not in stratigraphic order. It may mean that some part of sediment from depths 10–30 cm could be mixed during excavation, but structure of the sediment does not suggest if and which part is mixed. Therefore, we assumed that mixed part of sediment may occur only in a strict neighborhood of the hiatus level. Because radiocarbon dates of samples W3 9.5-10 (GdS-3212) and W3 13-13.5 (GdS-3261), which come from this unclear context, are older than dates of samples from depth below we decided to remove these results for our age-depth model. We assumed also that the part of sediment from depths below 13 cm is in stratigraphic order. The results of radiocarbon dating for samples from depths below 30 cm to the end of core (105 cm) clearly shows stratigraphic chronology of this part of the sediment.
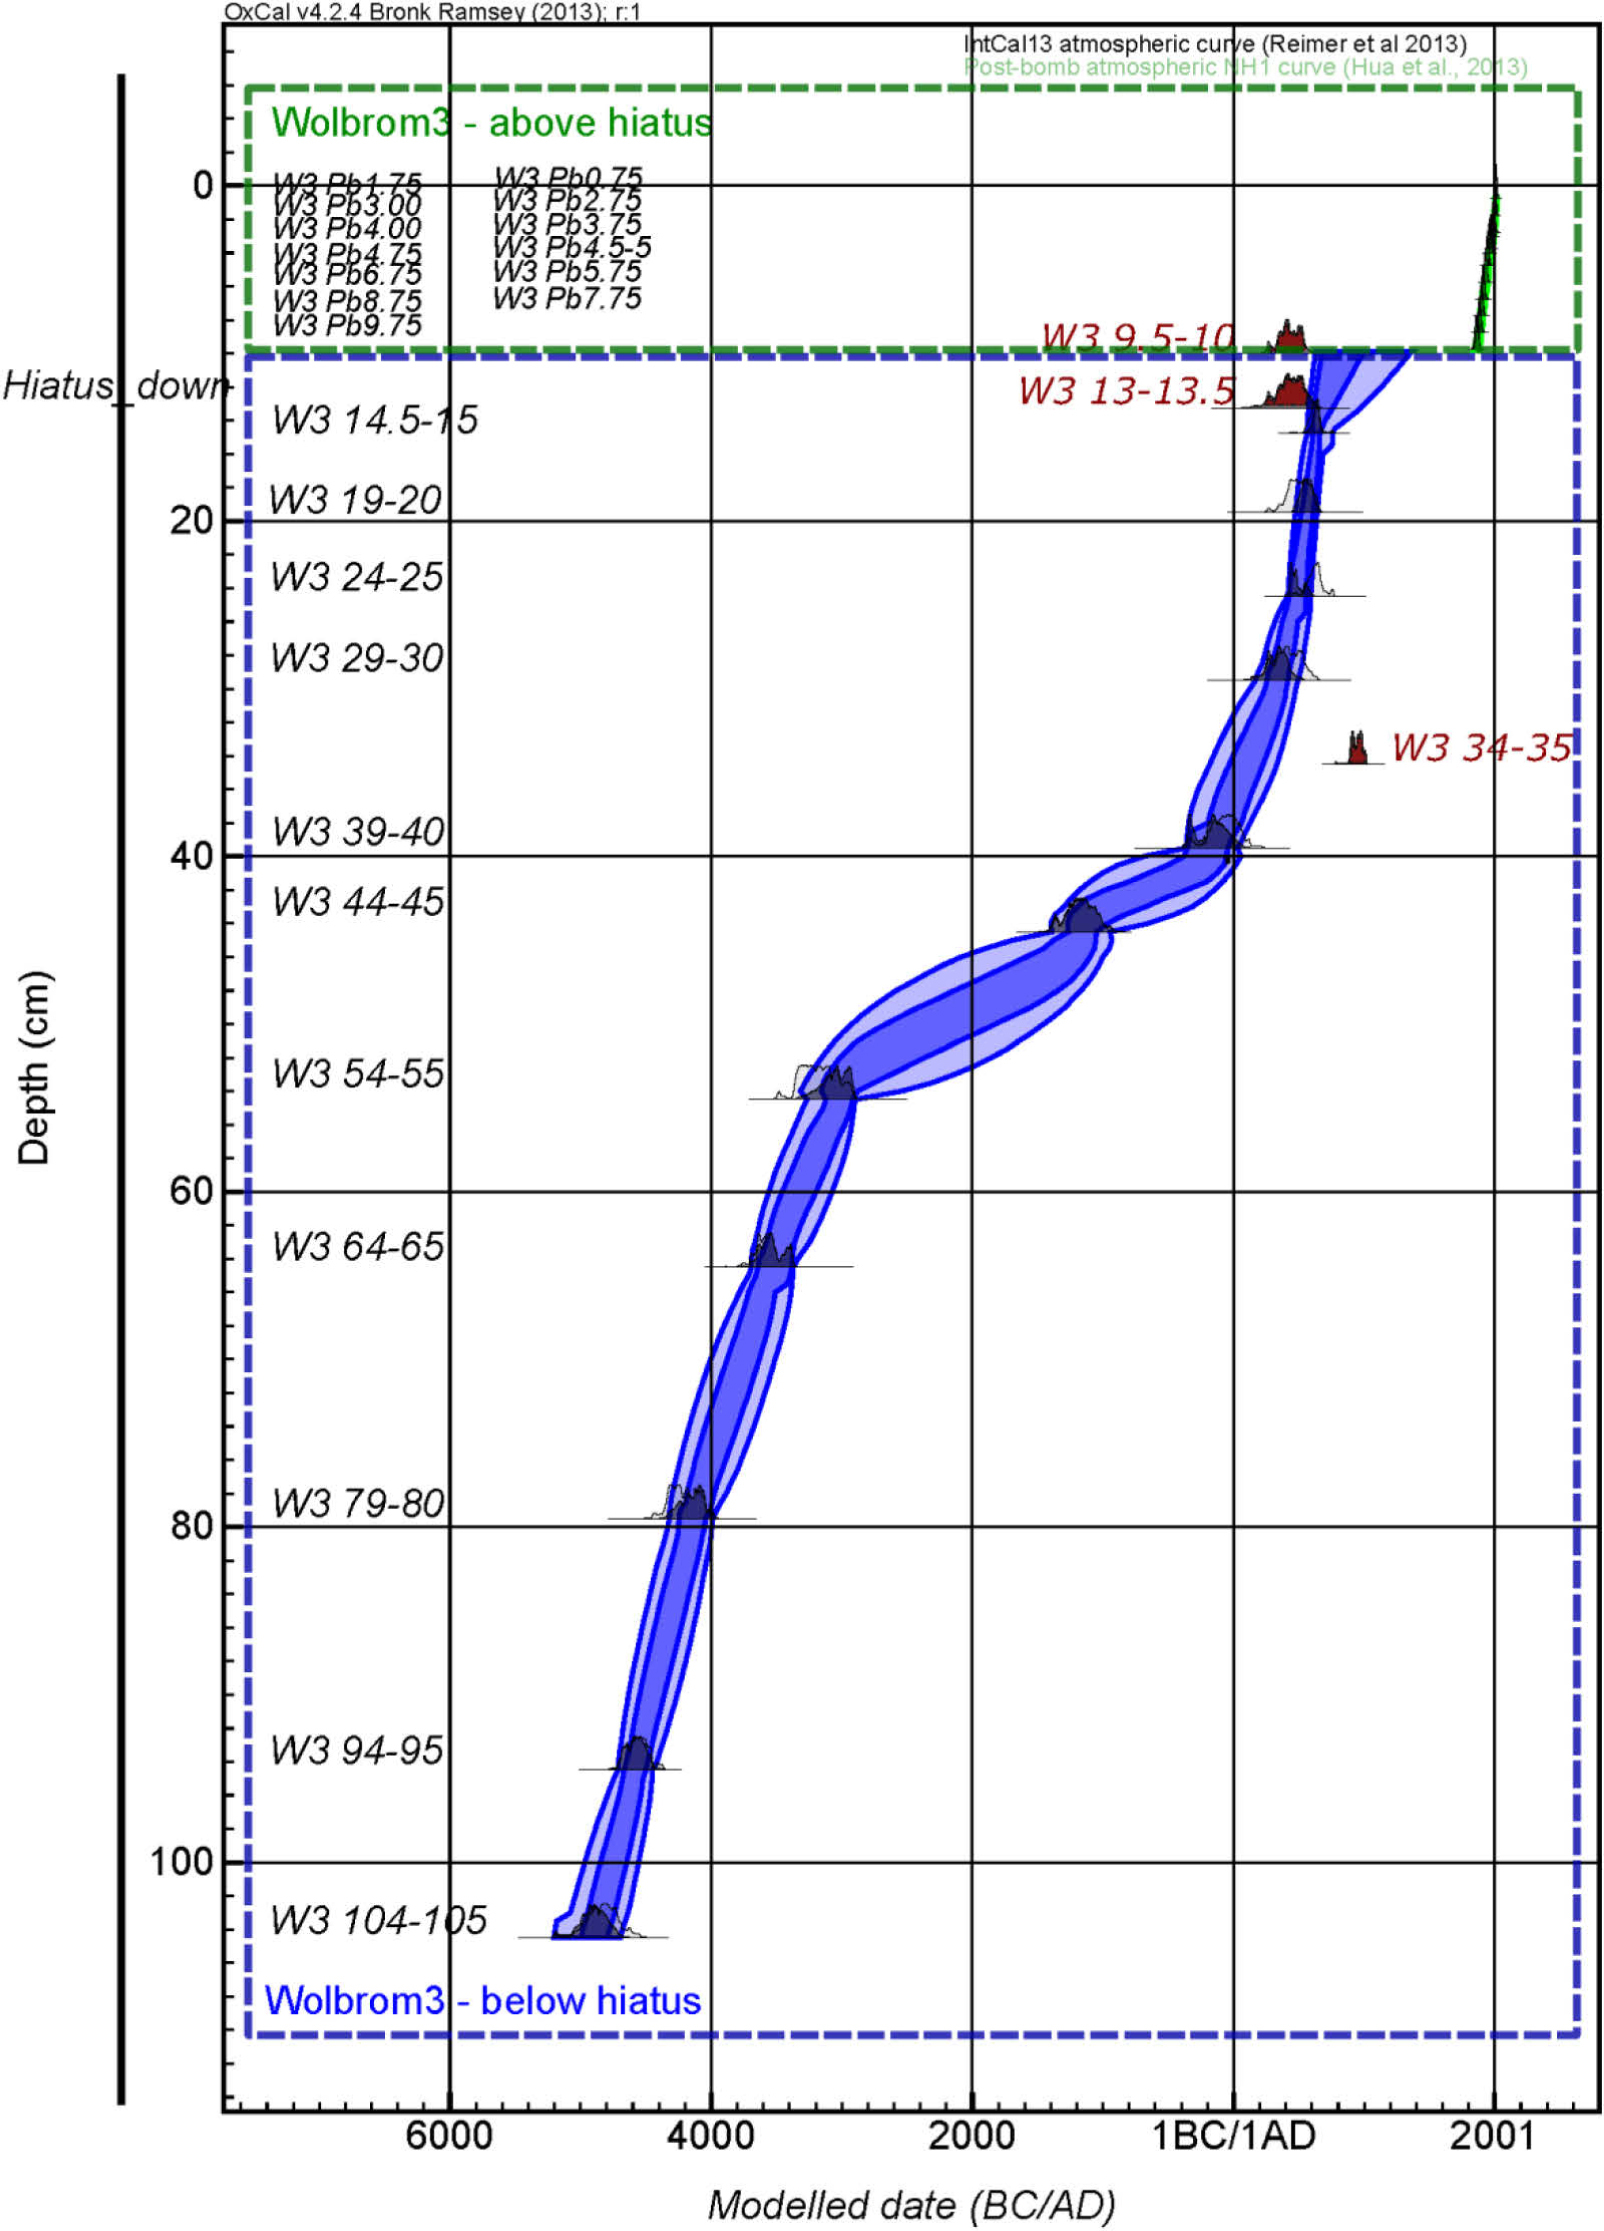
Finally, the proposed age-depth model is constructed on the basis of 12 14C dates and 13 210Pb dates using OxCal v4.2.4. (Bronk Ramsey and Lee, 2013) calibration program. The construction was performed with a use of two PSequence commands separated by Interval command, which include information about hiatus to the model. For the k parameter values 0.5 (PSequence for a part below hiatus) and 1 (PSequence for a part above hiatus) were chosen. Total agreement index of the model amounts to 53.6%, which is a little below suggested value 60% but may be accepted, especially that it is caused only by the radiocarbon date of sample W3 4,5-5 which agrees with the 210Pb dates. The age-depth model is presented in Fig. 3.
Fig. 3
Age-depth model for Wolbrom W3 core. Radiocarbon dates which are not included to the model are presented in red.
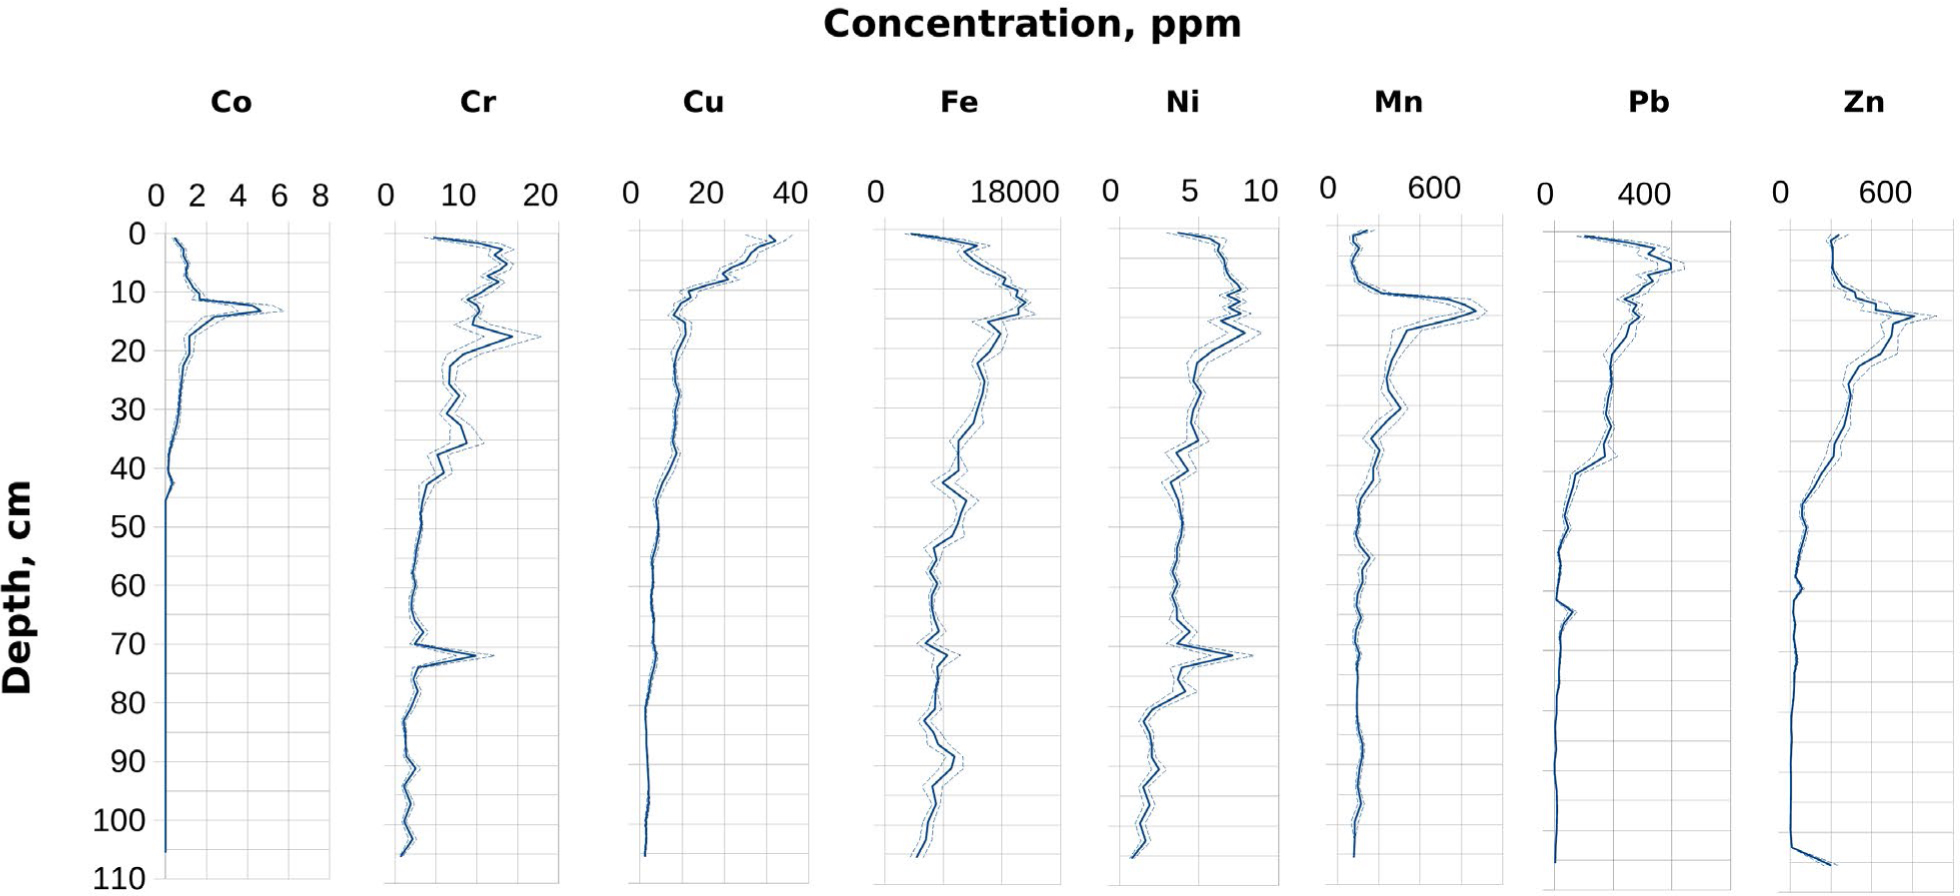
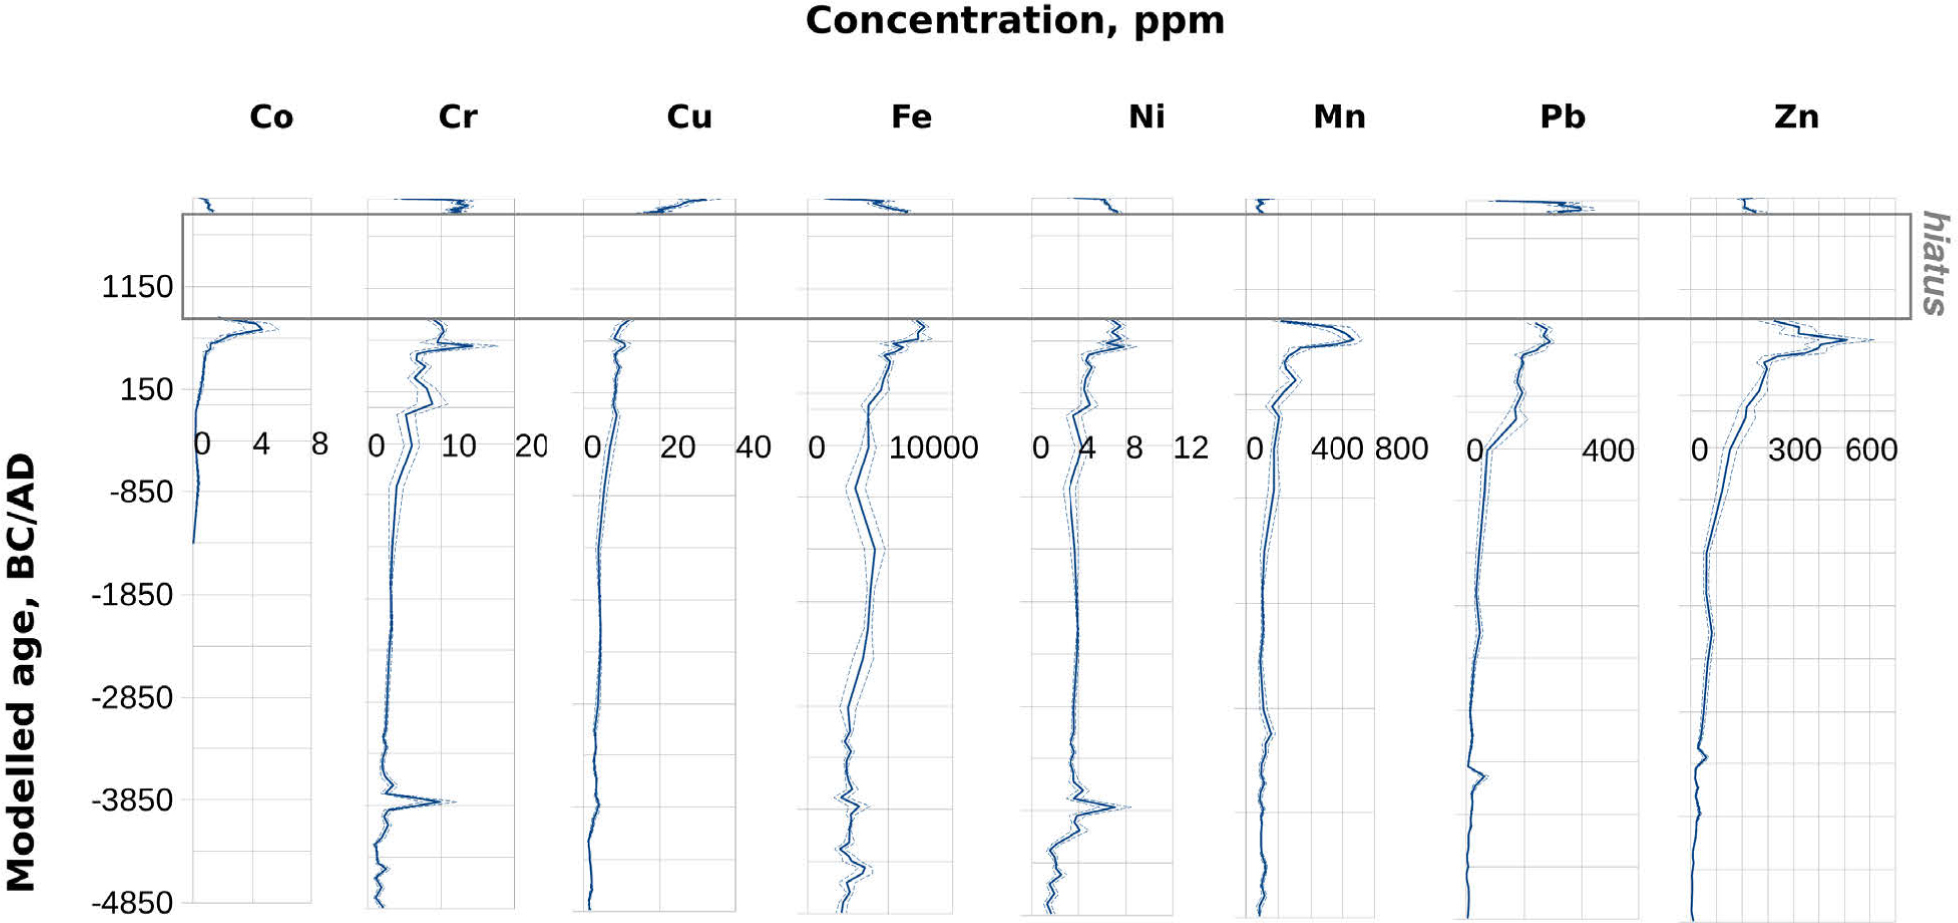
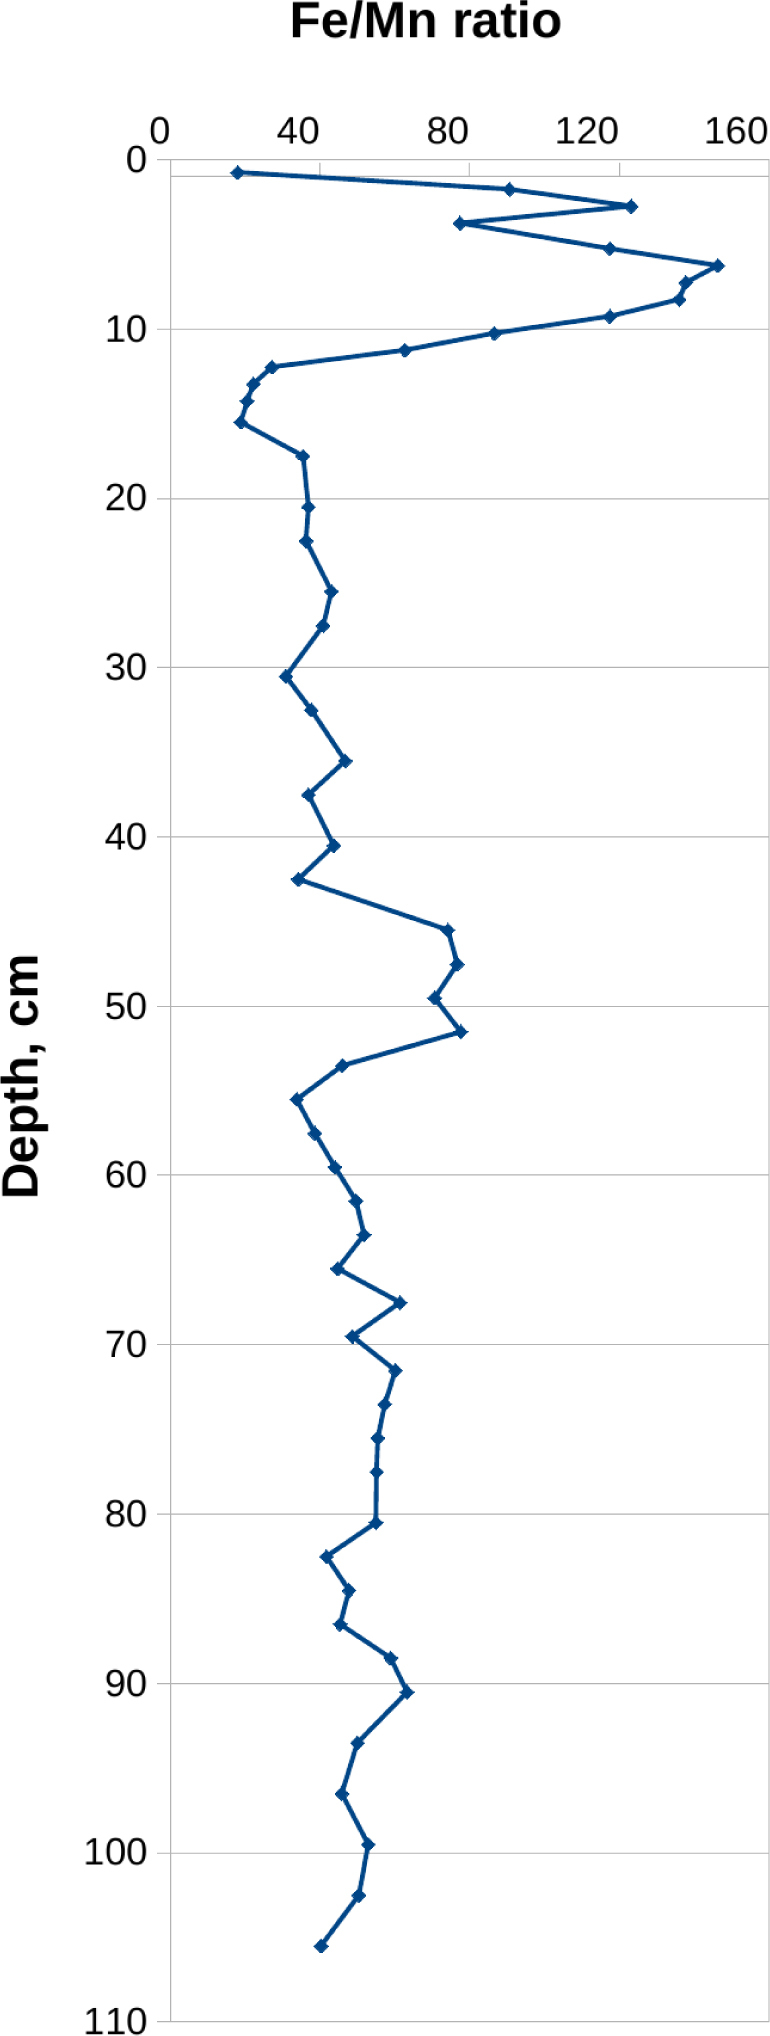
The geochemical analysis, made with the resolution of 1–3 cm, showed the variability of trace elements (Co, Cr, Cu, Fe, Mn, Ni, Pb and Zn) concentrations in the peat profile (Fig. 4). At a depth of 45 cm, which corresponds to age interval 1270–1045 BC, the concentration of zinc and cobalt increases rapidly up to the maximum at 12–15 cm, which corresponds to the age interval 610–665 AD (68.2% probability, in accordance with an age-depth model). Also, the concentration of lead and copper starts to increase at a depth of approximately 45 cm but lead has its maximum at 6 cm depth and copper almost at the ground level (at 1.75 cm depth). A visible correlation between some pairs of metals, such as Cr-Ni and Co-Mn were found. The concentration of trace elements was also shown in the time scale, based on the age-depth model (Fig. 5). The Fe/Mn ratio (Fig. 6) displays considerable variations (Boyle, 2001). It has its minimum values between 4900 BC and 3045 BC as well as between 1165 BC and 640 AD. The highest values of Fe/Mn ratio occurs in the upper part of the core. There is also visible high value of Fe/Mn ratio between 3045 and 1165 BC (median age, in accordance with an age-depth model).
. Discussion and conclusions
An analysis connected with construction of the age-depth model shows that a precision of a time scale constructed for the investigated core is different for different fragments of the sediment. The most precise and reliable is a part based on lead dates (depth above 10 cm) and a part based on radiocarbon dates for depths below 30 cm. On the other hand, there are some doubts concerning a fragment of core between 10 cm and 30 cm depth. The occurrence of the hiatus seems to be indisputable. However, a part between 10 cm and about 13 cm is based only on an estimation of a trend of the age-depth model for depths below 13 cm, so it is not precise. The time scale for a part between 13 cm and 30 cm depth is much more precise and reliable than this for depths 10–13 cm, but is based on an assumption that this part of the sediment is in stratigraphic order. We considered also another hypothesis (mixing of the sediment, an aging of the sediment because of a kind of reservoir effect), but at this moment we have not found strong evidence to support this hypothesis, whereas the assumption concerning the stratigraphic order is supported by a good value of the agreement index of our age-depth model.
It is noteworthy that the peat is very compressed. The mean accumulation rate varies between 0.53 mm·yr-1 and 6.48 mm·yr− 1. According to the age-depth model, the mean accumulation rate depends on the period on the time scale (see Fig. 3). The highest accumulation rate occurs in the upper part of the profile (from approximately 10 cm depth to the top which corresponds with last 200 years (according to 210Pb dates). Next, the mean accumulation rate slows down, and reach its minimum between approx. 155 BC (depth 40 cm) and 3045 BC (depth 55 cm). It can be connected with some environmental and/or climate changes, like water table changes Before approximately 3045 BC the mean accumulation rate is higher again and similar to this, which occur after 155 BC.
The concentration of trace elements is comparable or lower than in other locations in southern Poland (Śmieja-Król et al., 2015). However, the concentration of Pb and Zn is much higher than mean values for peatlands in Poland. The maximum concentration of Zn in Wolbrom fen is 609 ppm and the mean concentration value for Poland is 31 ppm. The maximum concentration of lead in Wolbrom is more than 400 ppm, while the mean concentration of lead for peatlands in Poland is 12 ppm (Bojakowska and Lech, 2008; Ilnicki, 2002). The highest values of Fe/Mn ratio in the upper part of the core may be related to intensified oxidation of Fe just below the sediment surface. The high value of Fe/Mn ratio between 40 and 55 cm depth corresponds to the lower accumulation rate. It is clearly visible on the age-depth model (from 3045 BC to 155 BC – median age) and may indicate higher water table in that period (Pawłowski et al., 2015, 2016).
Increase of the trace elements concentration shown in Fig. 4 and 5 can be related with the human activity such as mining and metallurgy. West of Wolbrom there is a huge area of zinc and lead ores occurring (Nieć, 1997). Because of the winds from west, the region can be polluted by heavy metals (Kruczała, 2000). It is conspicuous that in case of almost every investigated element the concentration value is high in the upper part of the graph (between approximately 1850 and 1950 AD), which corresponds with the times of industrial revolution. Industrial effect is also visible in high concentration level of lead and copper in the mid-twentieth century. A rapid increase of lead, zinc and copper concentration starts in the time of the Roman Empire; however an increase of these metals concentration is visible from 3400 BC.
The presented results could be helpful for study of human impact on the environment. The obtained results, i.e. the age-depth model as well as the trace elements concentrations, can prove that in the Olkusz Ore-Bearing region mining and metallurgy industry had an impact over the centuries, starting at least in the 9th century, which confirms former investigations (Chróst, 2013; Godzik and Woch, 2015; Magiera et al., 2016). The maximum of trace elements concentration occurs partially in a time period, for which the time scale is not precise (10–13 cm depth). It means that other explanations of this maximum are possible. Unfortunately, because of the hiatus, the reconstruction of information concerning the phenomena occurring in the period of Middle Ages and the beginning of modern metallurgy industry is not possible. Even so, these data could allow for historical reconstruction of metallurgy industry in earlier times but it needs further analyses. In this case, knowledge about the ratios of lead isotopes could be very valuable because it helps to determine the origin of metals. The ICP-MS measurements of 204Pb, 206Pb, 207Pb and 208Pb are currently in progress in frame of the cooperation between Silesian University of Technology (Gliwice, Poland) and University of Liége (Belgium).