
. Introduction
As a result of interdisciplinary settlement studies devoted to the changes in the settlement and its environmental context in the basin of the Wisznia river (a right-bank tributary of the San river), interesting new insight has been gained which may prove useful for dating the intensity of prehistoric settlement. The existing, commonly used model of research procedures leads from field studies recording archaeological sites, through identification of distinguishable environmental preferences attributed to the particular stage of prehistory to an attempt at answering the question of the changes in the intensity of development of the area being studied. A weak point of this procedure is chronology. This is because dating of archaeological materials is carried out by matching the stylistic and technological features of the sources collected from the surface of the area with the sets of patterns that are considered as distinctive for the particular culture or period. Studies in settlement archaeology involve handling large data sets for which it is, however, almost impossible to utilise radiocarbon dating because of the nature of the artefacts discovered on the surface. Because of that each proposal of a new research method or procedure is worthy of the utmost attention. An example of such a proposal is certainly the investigation of the grain size differentiation in the palaeochannel fill deposits in the Sandomierz Basin.
Palaeochannel fill deposits formed of mineral or organic materials accumulated in the abandoned or cut off channel. Preservation of deposits filling the palaeochannel is largely determined by the hydrological regime of the river. Accumulation of organic sediments is correlated with periods of reduced activity of fluvial processes while sequences of sandy-loamy sediments occurring in palaeochannels indicate periods of increased frequency and range of floods, and are associated with more humid climate phases (Starkel, 2014). A reduced supply of overbank sediments may also take place under conditions of rapid downcutting (deepening of the river channel) (Szumański, 1986) and also when the active riverbed is at a considerable distance from the oxbow lake (Kalicki et al., 1996). On the other hand, an increase in the delivery of mineral (suspension) material to the oxbow lake may be caused by anthropogenically determined erosion of the soils in the catchment (Klimek et al., 1997, 2006; Klimek, 2003; Kukulak, 2004; Kalicki, 2006; Wójcicki and Marynowski, 2012 and Michno, 2013).
The aim of this study is a statement if sedimentological changes observed in the palaeochannel fill sediments are concurrent with settlement phases and changes in human activity, expressed by number of archaeological sites discovered in the environs of profile and how these changes were recorded in the transformation of vegetation.
. Study area
The studies were carried out in the San river valley in the eastern part of the Sandomierz Basin, north of Przemyśl town, at the locality of Leszno village. At this stretch, the San river valley cuts through a Pleistocene loess terrace with a height of 20–30 m above river level (201–217 m a.s.l.) (Fig. 1). In the bottom of the valley there are Holocene terraces: upper floodplain with a height of 8–10 m (188.5–192 m a.s.l.), a width of 8–10 km, with unevenly aged generations of palaeomeanders, and a lower floodplain with a height of 5–6 m above river level (Fig. 1).
Fig. 1
Location of Leszno 19 profile and Stubno-Nakło 6 profile (red dots) and distribution of 131 archaeological sites on the alluvial ridge of the San river; T1, T2, T3, T4- systems of palaeochannels and alluvial fills.
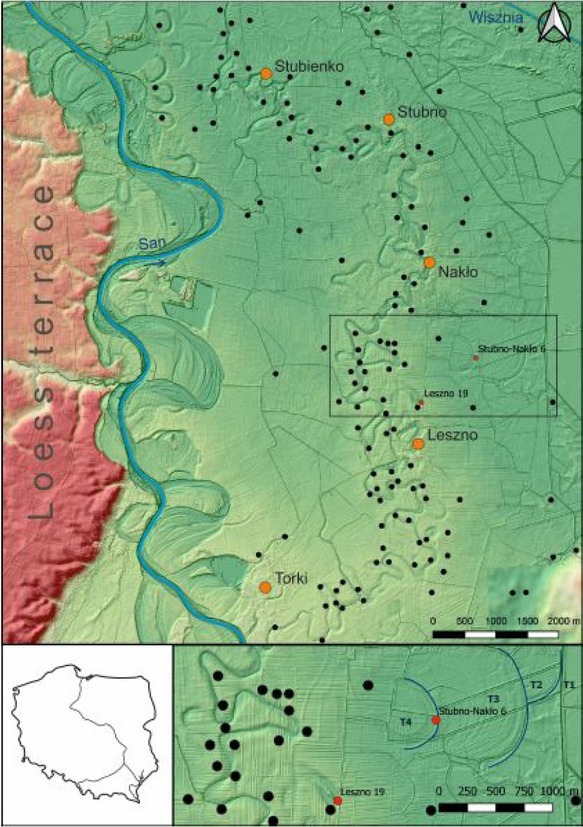
On the surface of the lower floodplain numerous young palaeochannels, typically filled with water, with a system of meander point-bars occurred. San is a largest Carpathian tributary of the Vistula river. The length of river is 443.1 km, and drainage basin area is 16877 km2 (Atlas podziału…, 2005). The contemporary winding and regulated channel of the lower San river, with a width of 70–100 m, is characterised by a gradient of 0.33‰. The Leszno 19 profile is situated in the 181 km of river length, and closed the drainage basin area of 4655 km2. In the south-east part of the study area a fragment of loess plateau with an altitude of up to 300 m a.s.l. occured (Fig. 1).
The studies conducted thus far enabled recognition of the structure of the San river valley bottom at this stretch as well as distinguishing several systems of Late Vistulian and Holocene palaeochannels (Klimek et al., 1997; Gębica et al., 2017, Kołaczek et al., 2017). Those studies documented a buried Vistulian terrace level (level T1) (Fig. 1), an alluvial plain from the Younger Dryas (level T2) dissected by the large-radius palaeochannel of the San river (r=700 m, w=100 m) as well as the adjacent zone of meander point-bars (level T3) (Gębica et al., 2017). These Late Vistulian system of palaeochannels is truncated by Preboreal paleomeander (T4). The drill of studied profile Leszno 19 was made within a small palaeochannel of the San river (r=70 m, w=50–60 m), being a part of the youngest system of palaeochannels (Gębica et al., 2017),, probably related to the stage of the Late Holocene avulsion determined by local factors. Such situations are described for other areas (Gębica, 1995 and Kiss et al., 2015) but are unknown in the foreland of the Eastern Carpathians. This system is located on a natural, 2 km wide alluvial ridge on which numerous archaeological sites are found (Fig. 1). This ridge rises from 1 to 2 m above the floodbasins with Late Vistulian and Preboreal palaeochannels neighbouring to the east. This youngest system of palaeochannels of the San river consists of a winding and shallow trough with indistinct erosion edges, with a width ranging from 20 to 50 m and cut-off older palaeomeanders. It is likely that studied palaeochannel at Leszno belongs to that older system of palaeomeanders (Gębica et al., 2017).
. Methods and materials
Archaeological methods
The research procedure applied to investigation of the archaeological sources corresponds to the assumed objective of the study which is consistent with the classical settlement archaeology (Jankhun, 1983). It is a specific research sub-discipline that has also been shaped on the grounds of Polish archaeology since the 1960–1970s (Dymaczewski, 1966; Kruk, 1973 and Kurnatowski, 1978). The basis for the interdisciplinary analysis (e.g. Kruk et al., 1996) is in this case a thorough recognition (mapping) of the archaeological sites and classifying them according to their chronology, function and size. For this purpose, surface studies are conducted in the area consisting in recording all tangible traces of human activity (sites). Recently, also photographs taken from the air (aerial photography, drones) have been used as well as laser scanning (LIDAR). The final effect is the drawing up of maps with marked sites from the individual chronological intervals. They allow to define settlement preferences and to draw conclusions concerning the intensity of settlement in this area. Also the scale of the studies is important; they can serve the purpose of both microregional studies and studies carried out on a considerably larger spatial scale.
Sedimentological methods
The Leszno 19 profile, with a depth of 2 m, was taken using an Instorf sampler in 2016. At the site, a whole sediment core was collected for sedimentological and palynological analysis. A detailed macroscopic description of the sediments, collection of samples for the sedimentological analysis as well as the laboratory analysis were carried out at the Geomorphology Laboratory of the Institute of Geography and Spatial Management of the Jagiellonian University in Krakow. In the macroscopic description of the core, 22 sediment layers were distinguished with thicknesses between 3 and 25 cm, varied with respect to grain size, colour, organic content and the type and degree of decomposition of the organic matter (Table 1). Structural features of the deposits were also described, such as thickness of the laminae (strata) and their location in the vertical profile, the type of layering (bedding) and the sedimentation boundaries.
Table 1
Macroscopic description of Leszno 19 profile.
A total of 23 sediment samples were collected for detailed laboratory analysis. The characterisation of the sediments was aimed at correlating their textural features and structure with the results of the pollen analysis and with the archaeological data. Analysis were performed for grain size distribution as well as organic carbon and calcium carbonate contents. At the initial stage, the samples were dried and the organic remains visible with the naked eye were removed; afterwards the samples were analysed by sieving techniques. The particles coarser than 1 mm were not found, so the grain size analysis was made by laser diffraction using a Mastersizer 3000 laser particle size analyser. The measurements were compiled into fraction intervals 0.5 phi scale. Using the Gradistat 5.11 PL beta software, the following grain size indices (parameters) using Folk’s and Ward’s formulae (1957) were calculated: mean diameter (Mz), standard deviation (sorting) (δI), skewness (SkI) and kurtosis (KG). Carbon content was determined by means of a CHNS Vario Micro Cube elemental analyser; based on the results obtained the organic matter content was calculated. The calcium carbonate content was determined macroscopically based on the reaction of the sediments with 10% HCl. Effervescence reaction was not observed in any of the samples; therefore, calcium carbonate content in the sample at the level of <1% was assumed as the result.
Pollen analysis
For palynological studies 25 samples with a volume of 1 cm3 each, collected from the core at intervals of 5–10 cm were prepared. A modified Erdtman acetolysis method was used, including KOH and HCl digestion, HF treatment (Berglund and Ralska-Jasiewiczowa, 1986), and with addition of Lycopodium tablets with the indicated number of spores (Stockmarr, 1971) in order to determine the concentration of sporomorphs. Pollen grains were counted microscopically at ×400 and ×1000 magnifications on the surface of several slides, until the sum of at least 500 arboreal pollen (of trees and shrubs) was reached. The percentage values of terrestrial taxa presented in the pollen diagram are based on the sum of arboreal [AP] and non-arboreal pollen [NAP] of terrestrial plants, excluding local taxa. The percentage pollen values of aquatic and swamp taxa, and spores of cryptogams were determined on the basis of the total sum plus the number of the respective sporomorphs. The results are presented in pollen diagram drawn on a chronological scale with POLPAL software (Nalepka and Walanus, 2003). Local Pollen Assemblage Zones (L PAZ) were distinguished in the pollen diagram based on both the traditional method of spectra comparison and the ConSLink numerical method.
Radiocarbon dating
The layers for conventional radiocarbon dating were selected on the basis of significant changes of vegetation recorded in the pollen data. The samples were radiocarbon dated at the Absolute Dating Laboratory at Skała near Krakow. The obtained dates were then calibrated using depth-age scales (Walanus, 2015) based on the IntCal13 calibration curve (Reimer et al., 2013). As the number of radiocarbon dates from the studied profile was insufficient for the construction of a depth-age model, we also used ages interpolated from Stubno-Nakło 6 and Zariczczja pollen sequences (Czopek et al., 2018). The basis for interpolation were similarities of changes in taxonomical composition and frequency of pollen taxa. The historical information on the origins of the Leszno village (formerly Poździacz) in AD 1463 was used as additional information correlated with the strong increase in cereals cultivation and deforestation. Due to the indirect (not precise) dating the chronology of the upper part of profile should be treated with caution (Table 2, Fig. 2).
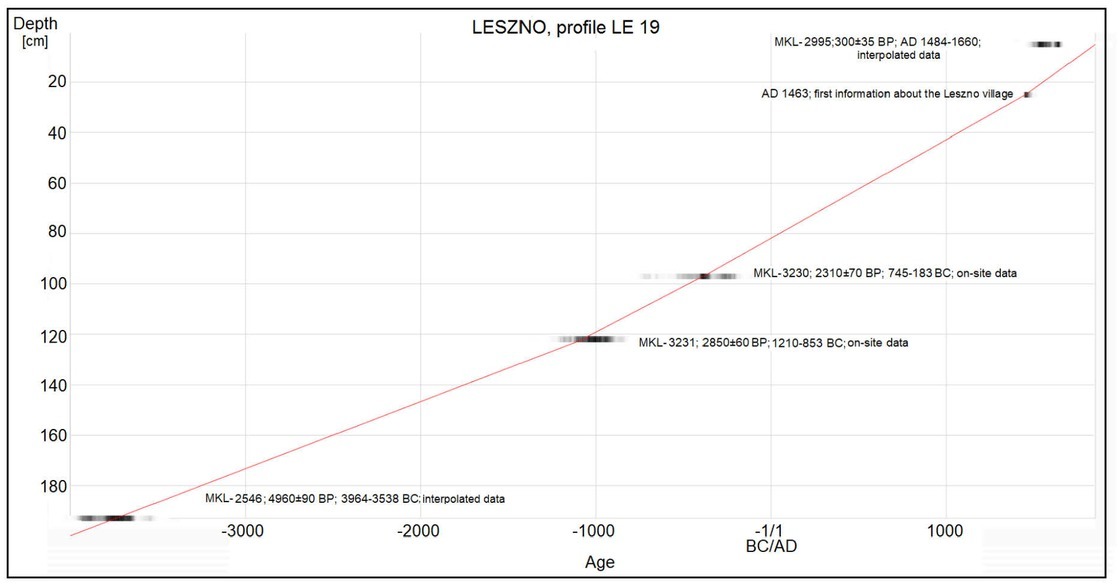
Table 2
Radiocarbon dates from the Leszno profile and ages interpolated from the closest pollen profiles, used for the construction of the depth-age model.
| No | Name of sample | Laboratory code | Age 14C (BP) | Calibrated age BC/AD (95.4% probability) |
|---|---|---|---|---|
| 1 | Leszno, LE/2016, 94–99 cm | MKL-3230 | 2310 ± 70 | 745–687 BC (4.1%) 665–644 BC (1.3%) 552–183 BC (90.1%) |
| 2 | Leszno, LE/2016, 120–125 cm | MKL-3231 | 2850 ± 60 | 1210–894 BC (93.9%) 871–853 BC (1.5%) |
| 3 | * Stubno-Nakło 6/1, 112–114 cm; (1.1 km from Leszno 19) | MKL-2546 | 4960 ± 90 | 3964-3632 BC (94%) 3558–3538 BC (1.4%) |
| 4 | * Zariczczja, Z- 2/2015, 18–20 cm; (ca. 25 km from Leszno 19) | MKL-2995 | 300 ± 35 | AD 1484–1660 (100%) |
. Results
Archaeological research
The archaeological sites registered within the alluvial ridge of the San river (Fig. 1) represent all epochs and cultures distinguished in south-east Poland. The analyzed territory covers the right bank of the San river valley (in the area of the Leszno profile) with an area of 72.5 km2. 131 sites were registered there (including 50 located above the profile), in which 271 settlement facts were identified (Table 3) (most of the sites were used in more than one period, and several had rich materials of different chronology, each of which is determined as “settlement fact”). The area of detailed research is a part of the entire Wisznia river basin (in total 1260 km2), constituting its western edge, delimited by the San river valley. A series of 271 settlement facts from this area, compared with materials (1772 sites with 3612 settlement facts) (Table 3) from the entire Wisznia river basin (Czopek et al., 2018) clearly indicates that it is fully representative.
Table 3
Number of settlement attributed to the particular cultures and periods at the 131 archaeological sites on the area of 72.5 km2 in the San river valley.
| Settlement facts | Absolute chronology | San-Region (72.5 km2 – Fig. 1) | Wisznia-Region (1260 km2 – Czopek et. al., 2018) | ||
|---|---|---|---|---|---|
| No | (%) | No | (%) | ||
| Number of recorded settlement facts | - | 271 | 100.0 | 3612 | 100.0 |
| Palaeolithic/Mesolithic | until 6th millennium BC | 1 | 0.4 | 24 | 0.7 |
| Neolithic | 6th-3th millennium BC | 12 | 4.4 | 276 | 7.6 |
| Stone Age | until 3th BC | 19 | 7.0 | 224 | 6.2 |
| Early Bronze Age (Mierzanowice culture) | 24th-18th century BC | 15 | 5.5 | 176 | 4.9 |
| Older/Middle Bronze Age (Trzciniec culture) | 18th-13th century BC | 33 | 12.2 | 193 | 5.3 |
| Late Bronze Age and Early Iron Age (Tarnobrzeg Lusatian culture and related materials) | 13th-5th century BC | 42 | 15.5 | 692 | 19.2 |
| Pre-Roman period and Pomeranian culture | 5/4th-1th century BC | 1 | 0.4 | 14 | 0.4 |
| Roman Period (Przeworsk culture) | 1th-5th century AD | 44 | 16.2 | 283 | 7.8 |
| Prehistoric Periods | until 5/6th century AD | 30 | 11.1 | 240 | 6.6 |
| Early Middle Ages | 6/7th-13th century AD | 30 | 11.1 | 584 | 16.2 |
| Late Middle Ages and Modern Period | 14th-18/19th century AD | 43 | 15.8 | 751 | 20.8 |
| Indeterminate chronology | ? | 1 | 0.4 | 155 | 4.3 |
Even an overall summary (Table 3) clearly indicates a systematic increase in the number of sites with materials with the successive cultures until the Early Iron Age (Czopek et. al., 2018). The largest number of sites is noted for the chronological interval of the Late Bronze Age and Early Iron Age, which is well identified in the sources and traditionally associated with the Tarnobrzeg Lusatian culture, which probably testifies to intensified settlement activity (Nogaj-Chachaj et al., 2005). It is worth remarking that the climatic conditions between the 9th and 3rd centuries BC were not very favourable for settlement and economic development – the so-called “Cold Iron Age” (Marks, 2016) which should also be associated with a period of increased humidity. It is climatic conditions that are taken to account for the clearly identifiable change in the economic structures of the prehistoric communities in the Early Iron Age which involved an increased role of breeding at the expanse of crop agriculture (Ostoja-Zagórski, 1982).
The next stage in the development of settlement, i.e. the pre-Roman period, is very scarcely represented in the sources. After this, already in the first centuries of the Common Era, another increase in the number of sites is noted. This activity should be connected with the population of the Przeworsk culture and the climatic conditions, optimal for its development (Roman Optimum) in the 1st century AD (e.g. Dobrzańska and Kalicki, 2003; Dotterweich, 2008; Büntgen et al., 2011 and Marks, 2016).
A more detailed comment is required concerning the situation in the late Subboreal and early Subatlantic periods. Until recently, materials of the Pomeranian culture, which should be dated to the 5th–4th/3rd century BC, were not distinguished either in the region concerned or in the wider territorial context of the whole basin of the upper and middle San. The latest discoveries and studies clearly corroborate its presence by both burial (not far from the area being discussed, i.e. Nienowice – Czopek, 2013) and settlement discoveries (e.g. Jarosław – Czopek, 2014). These are, however, sparse sites which evidence a clear attenuation of the settlement processes. It is significant in this context that the Pomeranian culture is above all known for graves and small cemeteries, which indirectly points out to a different model of economy preferring breeding while maintaining substantial mobility of the groups.
Sedimentological analysis
Taking into account the values of the grain size parameters (Folk and Ward, 1957) and the organic matter content, 5 lithological units can be distinguished in the Leszno 19 profile (Fig. 3). The palaeochannel is mainly filled with silty-clayey sediments (Mz = 5.8–7.9 phi) with an organic matter content gradually increasing towards the top (from 3.0% to 26.3%). The sediments do not contain calcium carbonate. The sorting of the sediments is poor across the entire profile (δI =1.6–2) while skewness (Sk) changes from negative (–0.1) to positive (0.2).
Fig. 3
Lithological profile, grain size indices (after Folk and Ward, 1957) and organic matter content in the Leszno 19 borehole log. 1 – clayey silt with organic matter, 2 – massive clayey silt, 3 – clay-ey silt with silt aggregates, 4 – organic silt, 5 – laminated silt (loam), 6 – clayey peat, 7 – wood, 8 – conventional radiocarbon dating, 9 – sampling sites, 10 – erosion boundary? 11 – medium sand (0.25–0.354 mm), 12 – fine sand (0.25–0.125 mm), 13 – very fine sand (0.125–0.063 mm), 14 – coarse silt (0.063–0.016 mm), 15 – fine silt (0.0160–0.002 mm), 16 – clay (> 0.002 mm)
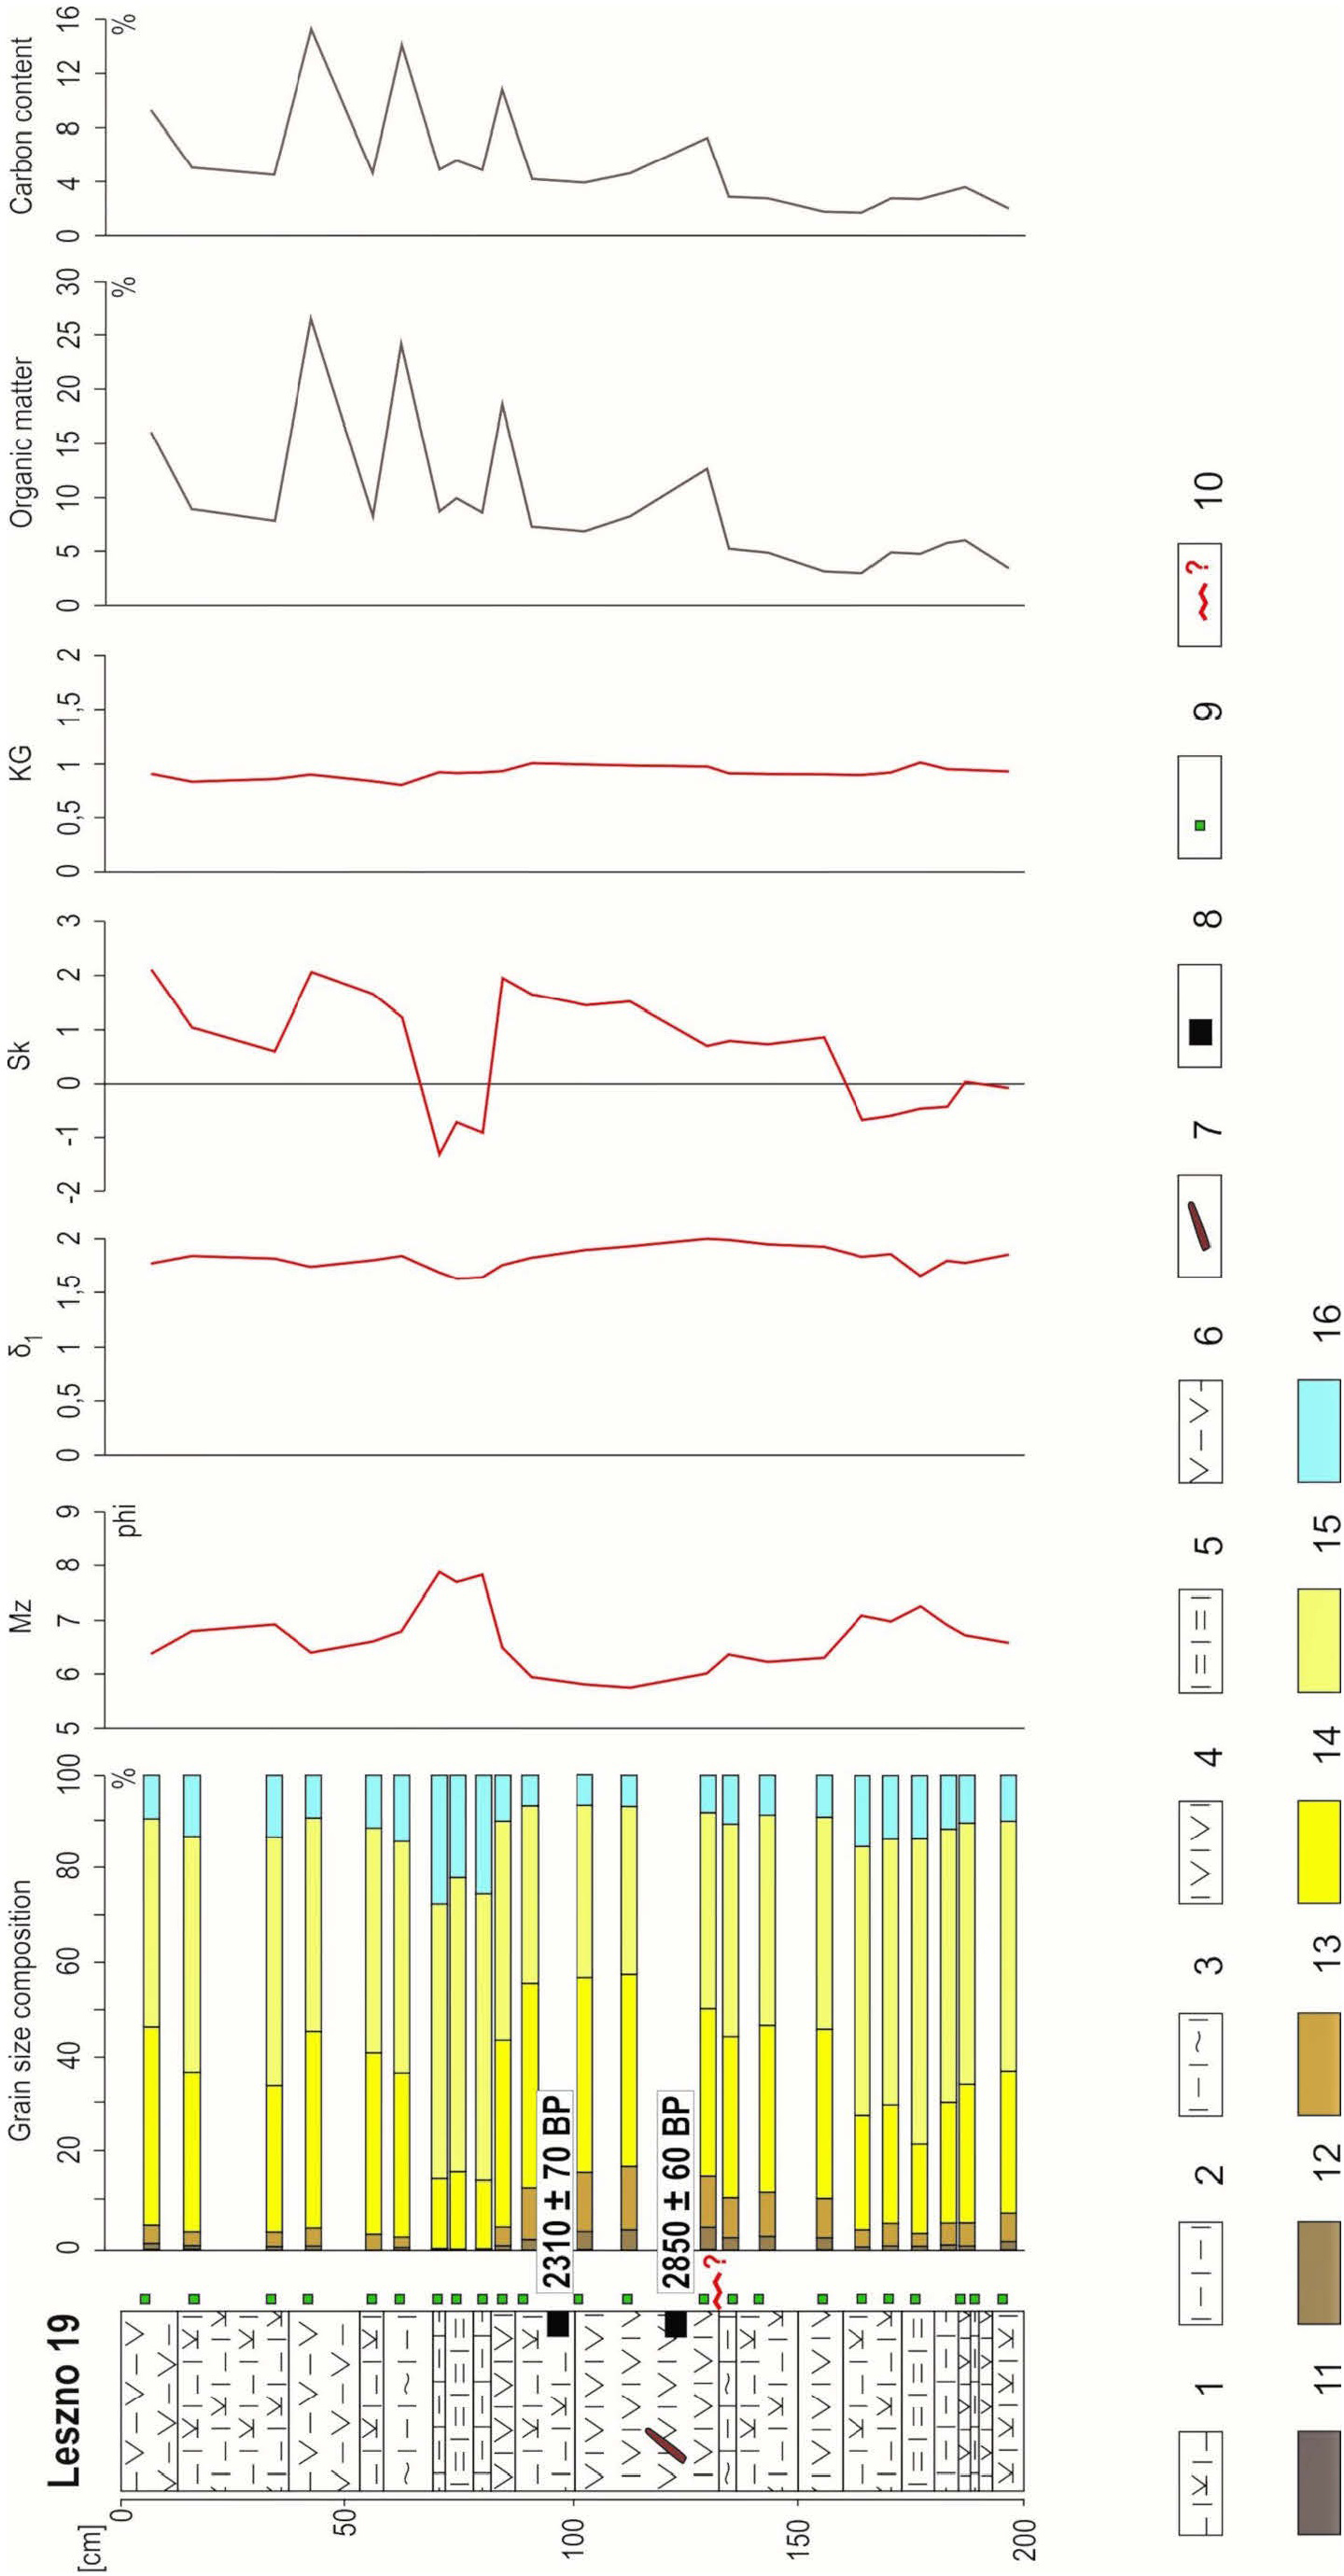
The bottom part of the profile, at the depth of 160–200 cm, is dominated by laminated and massive silt with dispersed organic content decreases towards the top of the unit from 6.1% to 3.0%. The mean diameter value (Mz) increases towards the top from 6.6 to 7.2 phi. The sediment is characterised by negative skewness (Sk = –0.01 – –0.06) and poor sorting (δI = 1.64–1.85).
Between 160 cm and 130–133 cm there occurs massive silt with a small amount of remains of water plants and organic contents in the range of 3.0–5.4%. The mean grain diameters (Mz) are in range of 6.2–6.3 phi. The sediment is poorly sorted (δI = 1.9–2.0) and positively skewed (Sk = 0.7–0.8).
At the depth of 130–133 cm, a clear (obliquely running) sedimentation boundary is marked and highlighted by the occurrence of a silt deposit containing organic matter, formed in the bottom of redeposited fragments (aggregates) of clayey silt. They are overlain to the depth of 85 cm by silt deposits containing a small fraction of organic matter (7.0–18.5%) and the greatest proportion of sand fraction (0.25–0.063 mm) in the whole profile, i.e. 15.0–16.5% (Fig. 3). The mean grain diameters (Mz) assume values in the range of 5.7–6.5 phi. The sediment is characterised by poor sorting (δI = 1.8–2.0) and positive skewness (Sk = 0.07–0.16).
At the depth of 69–85 cm a clear reduction in the sediment fraction sizes occurs as well as a change in the grain size indices. In the given depth interval in the bottom of the layer, there is present organic silt with soil aggregates overlain by laminated silty-clayey and organic sediments, with massive clayey silt in the top. The sediments are characterised by the greatest proportion in the whole profile of the finest fraction of sediments (clayey <0.002 mm) from 44% to 51% and a small content of organic matter (8.5–9.7%) (Fig. 4). The mean grain diameters (Mz) assume the highest value in the profile (7.7–7.9 phi). The sediments are characterised by poor sorting (δI = 1.62–1.68) and negative values of skewness (Sk = –0.7 – –0.12).
In the depth of 45–69 cm there is present clayey silt with organic remains and clayey soil aggregates as well as a layer of well-decomposed peat. From the depth of 45 cm to the top of the profile, it is clayey peat that prevails; it is poorly decomposed and has the highest content of organic matter from 7.8% to 26.3%. The mean sediment grain diameters (Mz) assume values from 6.4 to 6.9 phi.
Fig. 4
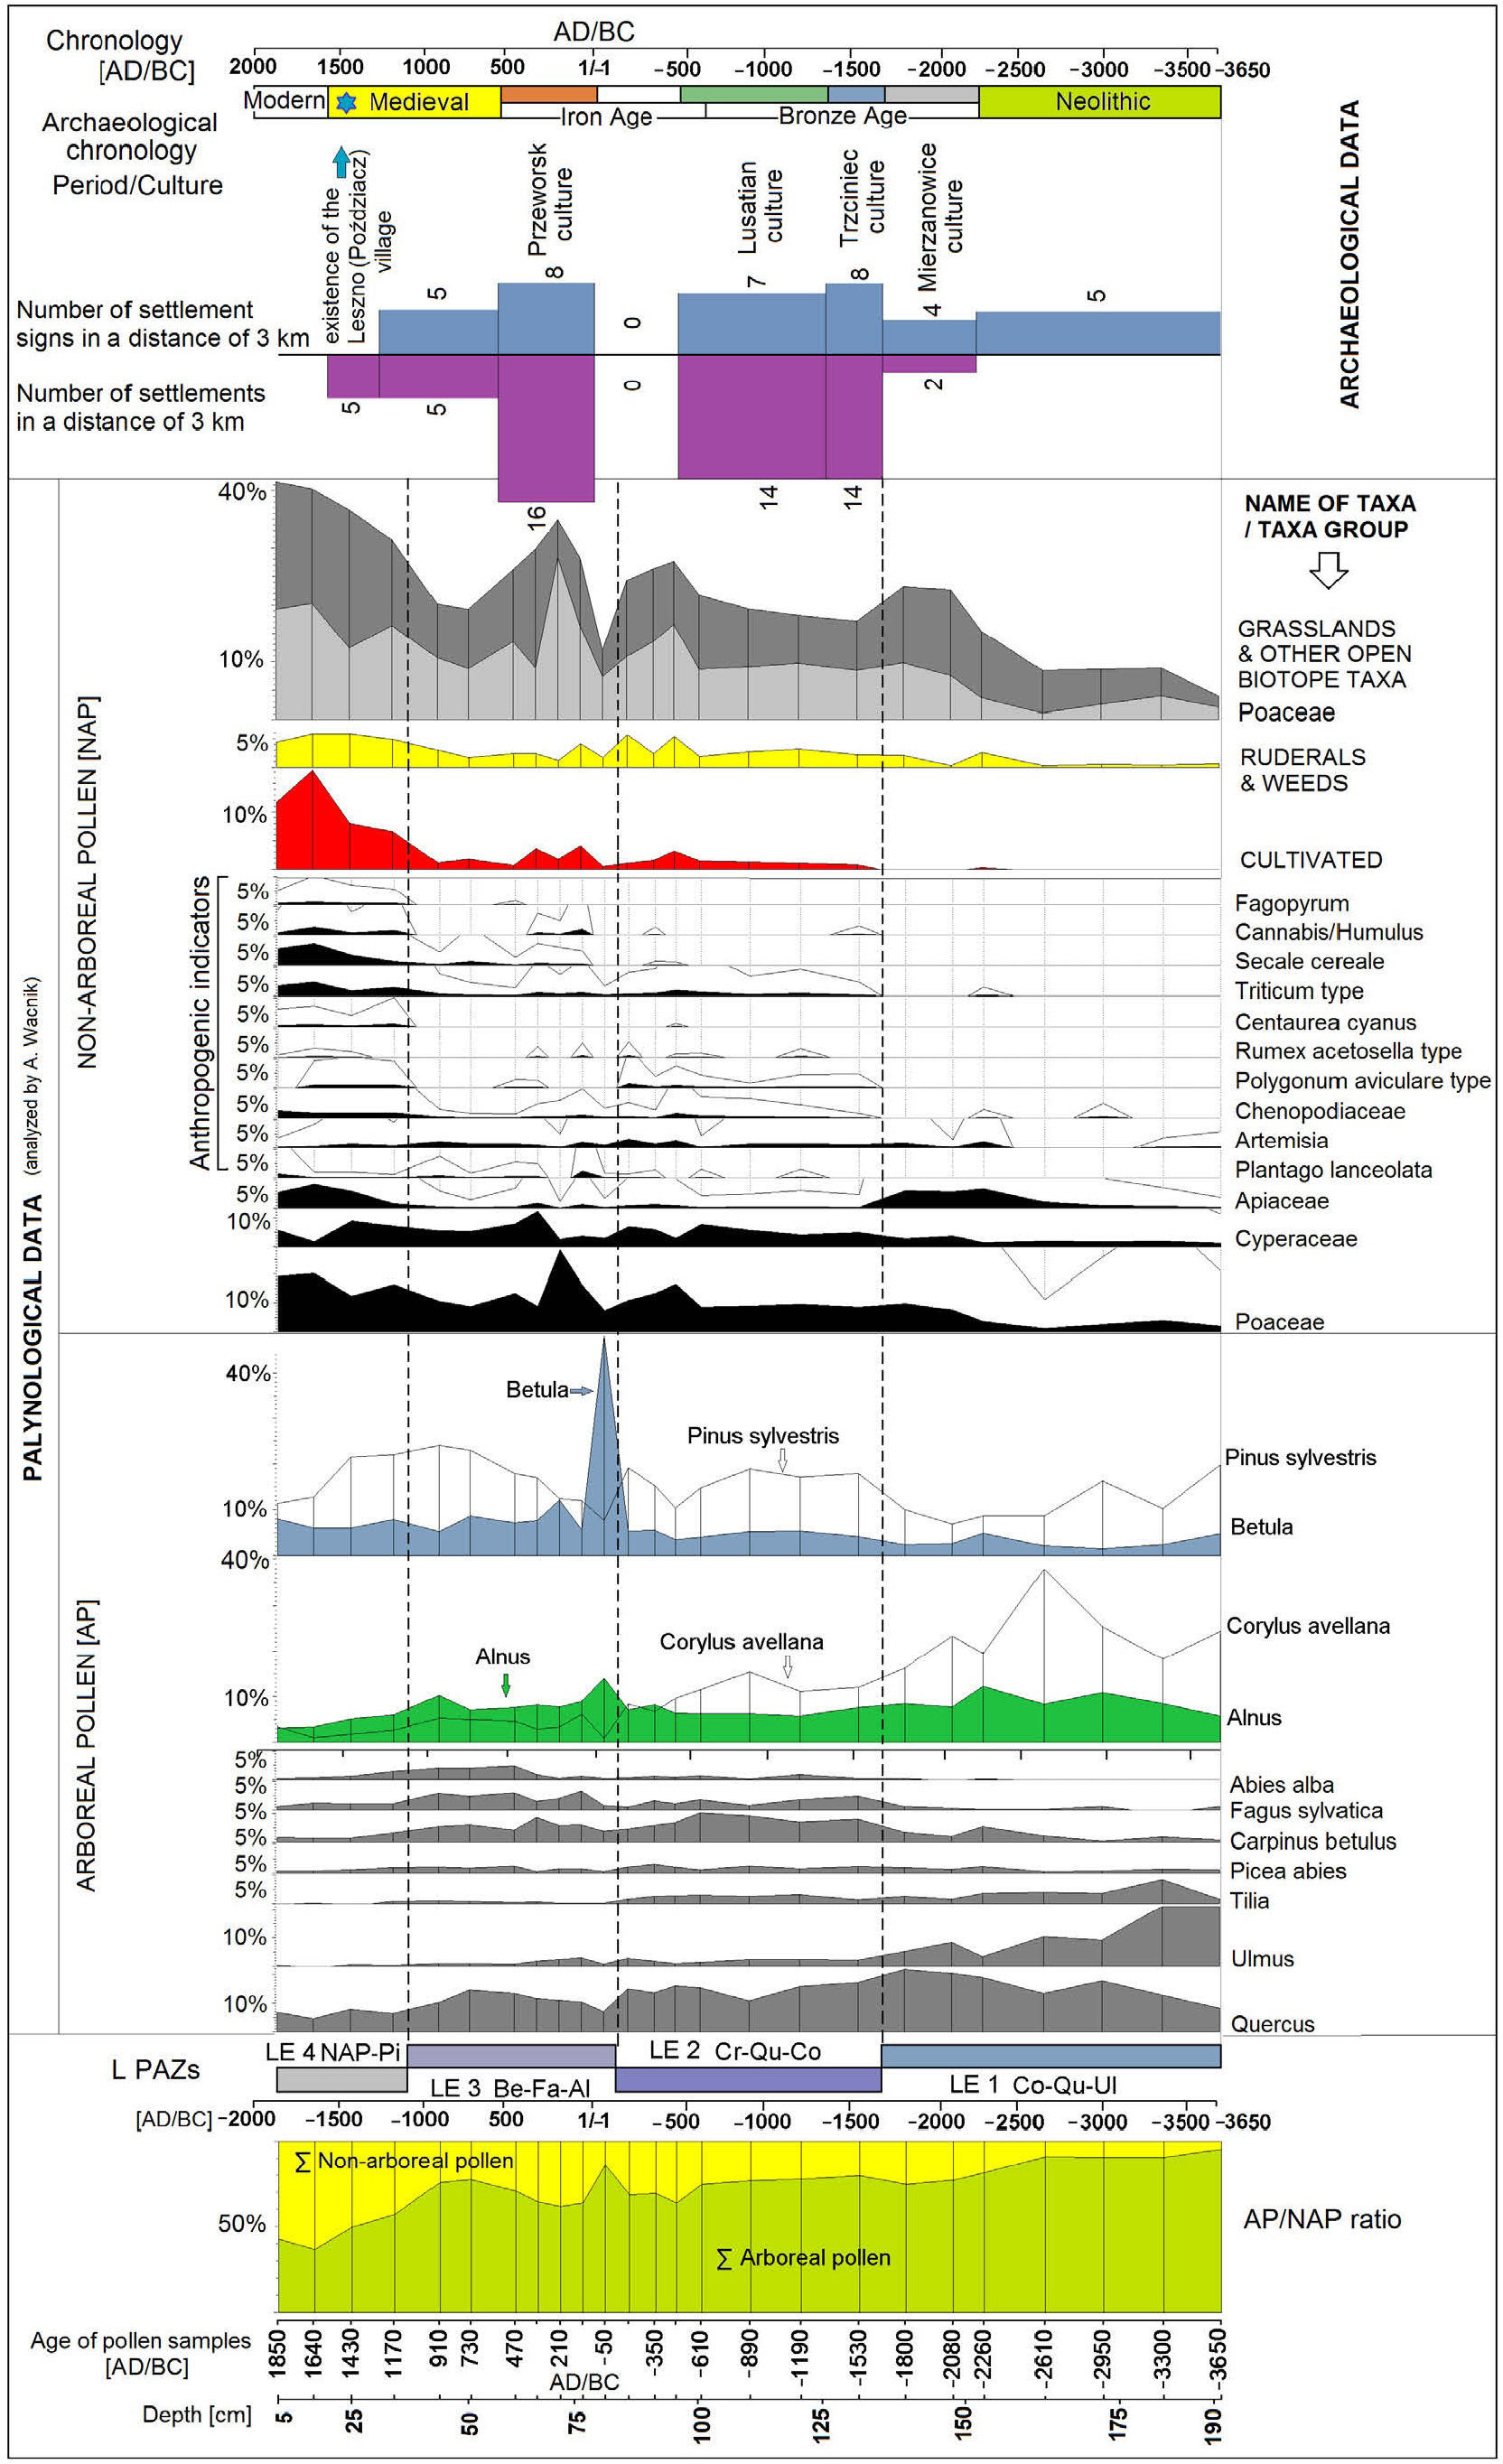
Diagram presenting changes in percentage values of pollen of selected taxa from the Leszno 19 profile, in the context of archaeological data on changes in the local settlement intensity. Co – Corylus, Qu – Quercus, Ul – Ulmus, Cr – Carpinus, Be – Betula, Fa – Fagus, Al – Alnus, Pi – Pinus, NAP – non-arboreal pollen.
Palynology
In the Leszno pollen sequence documenting vegetation changes from ca. 3500 BC until present, four local pollen assemblage zones (L PAZ) were distinguished (Fig. 4). The first one, L PAZ LE 1 (Corylus-Quercus-Ulmus; 193–140 cm; ca. 3500–1700 BC) is characterized by initially high values of Ulmus pollen (approx. 21%), decreasing from ca. 3300 BC (down to 5%), and accompanied by a significant increase of Corylus avellana (up to 38%) and Quercus (up to 22%) in the younger part of this zone. The constant values of Alnus pollen (up to 12%), and a more fluctuating share of Pinus sylvestris (up to 20%) and Tilia (up to 8%) are noted as well as low but continuous occurrence of Picea abies, Betula, Carpinus betulus, and Fraxinus excelsior (see also Wacnik, 2018). Until the end of this zone the ratio of arboreal/non-arboreal pollen is approx. 90/10 and the concentration of pollen is low until 2700 BC (approx. 80,000 pollen/cm3) and then increases up to approx. 600,000 pollen/cm3. The increasing share of pollen of herbaceous plants, especially of Poaceae, Apiaceae, Aster type, Cyperaceae, and Artemisia is observed from 2260 BC.
During L PAZ LE 2 (Carpinus-Quercus-Corylus; 140–80 cm; ca. 1700–50 BC) a decrease of Quercus, C. avellana, and Alnus pollen values and increase of Pinus sylvestris (up to 19%), Carpinus betulus (up to 10%), as well as Fagus sylvatica (up to 5%) are recorded. Extremely strong fluctuation of both AP and NAP values occurs between 600 BC and 50 BC. These changes indicate an opening of the forests due to local tree cutting. Earlier on, the quantities of arboreal pollen were more or less constant. Among the herbaceous taxa, human indicators are frequent and represented e.g. by a continuous curve of Triticum type pollen (besides single pollen grains of other crops: Hordeum type, Avena type and Secale cereale) as well as Artemisia, Chenopodiaceae, and Polygonum aviculare type, especially between ca. 610 and 190 BC (102–87 cm). The constant presence of cereal pollen started in the time of the Trzciniec culture and increased in the time of the Lusatian culture. The fast rise of Filicales monolete and regular presence of the Thelypteris palustris spores as well as pollen of Typha latifolia, Phragmites australis and Potamogeton reflect the ongoing process of plant succession in the oxbow itself (Wacnik, 2018).
The distinguishing feature of L P AZ LE 3 (Betula-Fagus-Alnus; 80–40 cm; ca. 50 BC – AD 1100) is a strong increase of light-demanding, pioneer Betula (with culmination up to 48% and the highest pollen concentration of 184,500 pollen grains/cm3; pollen accumulation rate = approx. 68,300 pollen grains/year/cm2) and Alnus (up to 14%) as well as a decrease of Corylus avellana. The increase of pollen values of Pinus sylvestris (up to 24%), Quercus (up to 15%), and Carpinus betulus (up to 8%) is noted once again after the strong fall at the beginning of the zone. The highest frequency in the whole profile is reached by Fagus sylvatica (7%) and Abies alba (5%). The mean value of non-arboreal pollen grains reaches approx. 30% between 80 BC and AD 470, then decreases. Poaceae reach the highest value of 28% at ca. AD 200. Taxa preferring different types of habitats including more dry (Plantago lanceolata, Centaurea jacea type, Jasione montana) and fresh to wet (Cyperaceae, Filipendula, Lychnis type, Lytrum) are recorded (see also Wacnik, 2018; Fig. 2). A continuous presence of cereals: Triticum type and Secale cereale is noted as well as Cannabis/Humulus type pollen (up to 2%).
From the beginning of the L PAZ LE 4 (NAP-Pinus; 40–5 cm; ca. AD 1100–1850) parallel to the reduction of values of most tree taxa such as Pinus sylvestris, Quercus, Alnus, Carpinus, Betulus, Fagus sylvatica and Corylus avellana, a strong increase of herbaceous plants both cultivated (Triticum type; up to 5%, Secale cereale; up to 8%, Fagopyrum; up to 1%, and Cannabis/Humulus; 3%) and ruderals and weeds (Centaurea cyanus, Chenopodiaceae, Polygonum aviculare type) is noted. The pollen values of Poaceae (up to 20%), Cyperaceae (up to 9%), Apiaceae (up to 8%), and Plantago lanceolata (up to 1.5%), representing chiefly the grassland communities are high. The arboreal/non-arboreal pollen ratio reaches up to 45/55 in ca. AD 1640 (mean value 65/35).
. Discussion
Development of local vegetation
In the period between ca. 3500 BC and 1700 BC the Leszno area was overgrown by mixed forests with a predominance of pine, oak, and birch. There also occurred different types of deciduous woodland communities. Some of them were dominated by oak and hazel while others where characterized by a high share of oak, elm, linden, hazel, with admixture of ash, hornbeam, and maple. On wet, marshy habitats alder woods as well as elm and ash cars could have developed. The initially small patches of open habitats covered with grasslands increased. The appearance of first Triticum type pollen confirmed the wheat cultivation conducted in the oxbow vicinity, in the time of the Mierzanowice culture development.
During the period ca. 1700–50 BC pine-oak forests with birch became more common. In the composition of deciduous oak-hornbeam forests the Holocene latecoming trees such as hornbeam and beech gained importance. Linden and elm were a small admixture in this type of woodland. Hazel grew in the undergrowth. Alder woods developed in wet habitats. Fir stands appeared in the region. The surface of woodlands was reduced at ca. 620–350 BC most probably as a result of agricultural and settlement activity of the Lusatian culture. Deforestation facilitated the spreading of grasslands. Fields used for cultivation of cereals were located not far from the oxbow. The regular presence of cereals started in the time of the Trzciniec culture but the local agriculture became more intensive in the later phase of the Lusatian culture (ca. 500 BC). Between ca. 350 BC and 200 BC the representation of crops decrease though share of ruderals/weeds and grasslands taxa was still high.
In the period between ca. 50 BC and AD 1100 the mixed pine-oak forests with admixtures of birch and spruce were the most widespread types of woodlands but forest in the type of the present Tilio-Carpinetum community also occurred. Alder woods with birch could have slightly increased their surface area. The characteristic short-lasting expansion of birch, recorded in the pollen sequence at ca. 50 BC, may reflect the episodic development of birch dominated semi-natural woods on areas previously cleared and then abandoned. However, it cannot be ruled out that high culmination of birch pollen is an effect of accidental overrepresentation. The archaeological data showed a weakening of settlement in the region from the 4th century BC to the beginning of the Common Era. The changes in the settlement intensity could have stimulated a secondary succession on postagricultural fallow lands and unused grasslands. The local range of this phenomenon is supported by the fact that it has not been known from the Sandomierz Basin so far but it was observed for example in northern and northeastern Poland (Wacnik et al., 2012; Szal et al., 2014). Significant decrease of arboreal taxa (such as pine, oak, and spruce) which started already in the 1st century AD suggest the renewed reduction of the woodland cover. Deforested land was used as farmland by the Przeworsk culture community that inhabited the area for the next centuries and left remains of 16 settlements at a distance of 3 km from the studied palynological site (Fig. 4). The increase of herbaceous taxa, marked by the highest representation of Poaceae and a significant share of anthropogenic indicators, especially crops such as wheat, oat and rye as well as hemp and/or hop was related to the economic development of the area. In the 5th/6th centuries AD there was another increase in the share of e.g. pine, fir, oak, and beech as well as a small reduction in the number of human indicators which probably resulted from the weakening of the anthropogenic exploitation of the area. The large-scale woodland clearance was initiated in the 12th century AD. Most of oak-hornbeam forests and alder woods have been grubbed up in the Middle Ages and in the Modern Times. Patches of mixed pine dominated forests, with spruce and oak stayed restricted to a small surface. The reduction in tree stands resulted from the enlargement of grasslands and arable land used for cultivation of cereals, buckwheat, and hemp and/or hop.
Reflection of human impact in environmental changes
The increase in the sediment fraction size, including the share of fine-grain sand, and the presence of soil aggregates from the depth of 130–133 cm clearly coincides with the end of the settlement of the Mierzanowice culture and the beginning of the settlements of the Trzciniec culture in the Early Bronze Age (18th–13th centuries BC). It falls immediately above the pollen zone border between the L PAZ LE 1 and L PAZ LE 2 which reflects significant changes in the local vegetation. The increase in the proportion of pine, hornbeam and beech as well as the reduction of oak, elm, and hazel in the composition of the forest communities took place concurrently with the development of agriculture. In the pollen diagram, from ca. 1530 BC (depth of 132 cm) there begins a constant presence of cereal pollen, the indicators of the local crops and the presence of arable land (Fig. 4). These changes resulted in increased supply into the riverbed of mineral material (sandy silts) originating from soil erosion in the deforested areas. Prevailing share of silts fraction (60–75%), poor sorting (1.6–2 phi) and mean grain size (Mz) ranges from 5.7 to 7.9 phi indicate, that main source of supply for sediments deposited from suspension in palaeochannel were loess deposits. A clear boundary is formed by Mz= 6.5 phi. Above this value skewness (Sk) is negative, below this value it is positive. This statement is accordance with the sedimentological characteristics of overbank deposits from Vistula river valley near Kraków (Kalicki, 1991). Changes in skewness from positive to negative values may indicate large differentiation in dynamics of overbank deposits sedimentation.
Similar changes in the composition of the vegetation and the presence of indicators of crop plants in the zone dated to 1440–980 BC were observed in the palaeochannel filling of the Wisłok river at the confluence with the San river at Grodzisko Nowe (Gębica et al., 2008). Furthermore, the layer of sediments at the depth of 85–69 cm with the highest proportion of the finest clay fraction may indicate the recession of agriculture (reduction of cultivation or abandonment of arable land), which resulted in decreased (reduced) supply into the riverbed of the coarser fraction of mineral material. The aforementioned layer in the pollen diagram corresponds to the next border between pollen zones (L PAZ LE 2 and L PAZ LE 3; Fig. 4) and further changes of vegetation. In the period from ca. 200 BC to the beginning of the Common Era (depth of 87–80 cm), a decrease was observed in the representation of cereals and grassland taxa with a relatively higher representation of ruderals and weeds. At the depth of 82 cm, a high value of birch pollen was recorded and one of the possible interpretations of this phenomenon was the development of birch dominated forests on the postagricultural lands. Another increase in the supply of coarser silt material and soil aggregates was observed in the profile above the depth of 69 cm. In the pollen sequence, from ca. AD 200 (depth of 72 cm), there is visible re- increase in the proportion of anthropogenic indicators related to the activity of the Przeworsk culture in the Roman period (the first centuries AD). The settlement of this culture, like the later settlement of the Early Middle Ages (from the 6th century AD), is documented with numerous archaeological sites in close vicinity of the study site. The period, which may be identified with the accumulation of a layer of the finest-grained sediment, should thus be placed between the decline of the very resilient settlement from the Early Iron Age (from the 5th –6th centuries BC), which is clearly visible in the entire region, and the once again intensified settlement activity from the Roman period (from the 1st century AD), which is marked in the sediments by a greater proportion of the coarser suspension material. It can be thus assumed that the recession of agriculture concerns the pre-Roman (La Tène) period. The number of sites from that period is significantly smaller as compared with the earlier and later periods. The settlement decline in the La Tène period is also marked in the pollen diagram of the San palaeochannel at Kopki village north of Sarzyna (Bałaga and Taras, 2001, 2005). Studies carried out in the San river valley corroborate the earlier reports form central Poland concerning the phase of late La Tène stabilisation of valley slopes and bottoms resulting from the recession of settlement and also from the ensuing increase in the compactness of forests as well as the natural regenerations of degraded forests (Twardy et al, 2004).
. Conclusions
The increase in the fraction size in the Leszno 19 profile correlates well with the increase in man’s activity in the 2nd and the 1st half of the 1st millennia BC (the decline of the Mierzanowice culture, the Trzciniec culture, the Tarnobrzeg Lusatian culture (and related elements) as well as in the 1st millennium AD (the Przeworsk culture and the early Medieval settlement) what is also manifested in both archaeological and palynological data. Whereas the decrease in the supply of mineral material into the river channel attributable to the period of recession of settlement between the 4th and the 1st centuries BC, is supported only by a decline (although not total disappearance) of anthropogenic indicators. This is corroborated by the archaeological materials which reveal a significant reduction in the number of dated sites originating from that chronological interval. This contrasts particularly sharply with both the period preceding this stage (the early part of the Early Iron Age, i. e. the 8th–5th centuries BC) and the following period (the Roman period, i. e. the 1st–4th centuries AD). Both can be termed as prehistorical optima with respect the intensity of development in the Wisznia river basin a long with a part of the S an river valley (Czopek et al., 2018). These changes are caused not only by the cultural transformations but also by the suggested change in settlement preferences among the community of the Pomeranian Culture in the 5th–3rd centuries BC. It is assumed that the economy of that time ‘was based on various forms of exploitation of the natural environment’ (Ostoja-Zagórski, 1995) emphasising however some essential changes in comparison with the previous period. They concerned a different crop structure (barley-dominated) and a definite increase in the significance of animal breeding (Łuka, 1974; Czopek, 1992 and Kwapiński, 1995). Thus, both of these aspects, i.e. the reduced intensity of settlement and/or the changed management practices in agriculture, should be taken into consideration when interpreting the differences found (or in searching for the causes of their changeability) concerning the grain size distribution of the sediments filling the San palaeochannel.
An additional value, very essential from the point of view of archaeology, is the fact that the change in the grain size distribution observed in the Leszno 19 profile is attributable to the Early Iron Age. Due to the flattening of the calibration curve of the radiocarbon dates, we do not have at our disposal any precise determinants that would invigorate the interpretation of the cultural processes taking place in that age. Thus far, the numerous attempts at absolute dating, also by means of dendrochronology or thermoluminescence (Czopek et. al., 2013), have not brought about the expected outcomes. This is why the observations of the changes in the grain size distribution in the sediments discussed in the paper are so important. They encourage us to undertake further studies and analyses. There are plans for the future to once again collect cores from the oxbow lake and subject them to a detailed geochemical analysis, e.g. for phosphorus content which indicates man’s economic activity. It is also worthwhile to note that in the light of the most recent analysis concerning settlement and cultures in the valleys of the San and the Wisznia rivers (Czopek et. al., 2018), the Early Iron Age appears to be a period of dynamic settlement and culture related changes in which natural conditions probably played an essential role.