
. Introduction
The 210Pb (T½ = 22.3 y) radioactive-dating method is the most frequently and reliably used method to calculate short-term sediment deposition and sedimentation rates (0– 200 y) in oceans, estuaries, rivers and lakes (Humphries, 2010), because of its relative insolubility and long half-life. As a natural radioactive element in the 238U decay chain, it is present in both soils (sediments) and the atmosphere. In sediments 210Pb has two sources: the supported 210Pb, which is continuously decaying in the sediments from its parent radionuclide, 226Ra, with which it is assumed to be in secular equilibrium, and the unsupported 210Pb, formed by the emanation of 222Rn from soils, which then decays into a series of short-lived radionuclides, and which are finally deposited in the catchment area and directly in the lake.
Studying the natural sediment deposits makes it possible to highlight the historic modifications (Alvisi and Dinelli, 2010) of the major hydrological processes and the erosion of soils due to vegetal surface overexploitation, deforestation/reforestation, or changes in agricultural techniques (Begy et al., 2015a). The layers can also provide information about possible atmospheric organic pollutants, heavy metals (Qi et al., 2010) or radioactive emissions from nuclear installations. Estimates of sediment accumulation rates, and the significance of heavy metal inputs (Steiner et al., 2000; Al-Masri et al., 2002) from anthropogenic activities relative to natural inputs, were the subjects of many studies of lakes (Larsen et al., 2010; Schneider et al., 2014; Baskaran et al., 2015), river deltas (Xu et al., 2008 and Hou et al., 2014), lagoons (Niencheski et al., 2014) and seas (Sert et al., 2012; Szmytkiewicz and Zalewska, 2014).
This work presents the results of the first detailed study on the sedimentation processes and the associated morphological changes in the Iacob and Isac Lakes, and the Danube Delta, using the 210Pb radiometric dating method. The sedimentation rate in the Iacob and Isac lacustrine units was determined in order to investigate the temporal variation of the Danube River’s solid discharges, and to reflect the variations in the sediment levels caused by flooding or human activities. Additionally, 137Cs measurements provided a useful independent time marker for validating the data obtained from the 210Pb dating. In the sediment of Lake Iacob the heavy metal concentrations were analysed to reconstruct the pollution history.
. The Study Site
The Iacob and Isac Lakes can be found in the first part of the marine Danube Delta, south from the Sulina Branch, but without direct connections to it. The lake banks are marked by vegetation formed mainly of grasses belonging to the Poaceae family (reeds), facilitating permeability and water exchange with the other specific limnophilous units. The phytoplankton and zooplankton levels in both lakes are high, and the development of green-blue algae is favourable (Oosterberg et al., 2000).
Lake Iacob is part of the Rosu-Puiu lake complex, and has a total surface area of 2208 ha (600 ha open water, 360 ha potentially floating reed and 1248 ha inundated reed). The lake is 4.6 km long, and 1.6 km wide through a flow lake. It is 3.63 m deep and situated at an altitude of 1.8 m. The basin of Lake Iacob consists of a depression between two elongated lakes in the NE-SW direction, and the formation which marks the initial propagation stages of the Sulina delta lobe (ca. 3300 years BC). In the present, the main pathway of communication and sediment exchange between this lake, and the rest of the deltaic system is represented by a secondary channel situated in the south of the lake. This starts at the Caraorman Channel, which was built in the 1930–1940 period (Oosterberg et al., 2000) in the Rosu-Puiu complex, and is seconded by two other lower discharge channels of the Sulina Branch.
Lake Isac is a border lake with a total area of 2560 ha, of which 1020 ha is open water, 260 ha potentially floating reed, and 1280 ha inundated reed. Lake Isac is 4.2 km long and 3.1 km wide, its depth is 2.4 m, and it is situated at an altitude of 1.32 m. The basin of Lake Isac is part of the Uzlina and Isac Lakes system in the Grogova-Uzlina complex. The Lake has three channel entries: one in the NE part, one in the NW part and the last one in the southern part of the lake. This has an indirect connection to the Sf. Gheorghe Branch through Lake Uzlina. This channel was built between 1941 and 1951 (Oosterberg et al., 2000), while the NE and NW channels are linked to each other, and start at the Caraorman Channel (Fig. 1), being connected to the high water and sediment discharge into the Sulina Branch, and have a constant water travel time of 1 day. In addition to its favourable location in the Central Danube Delta, Lake Iacob is ideal for heavy metal pollution determination typical for the Central Danube Delta.
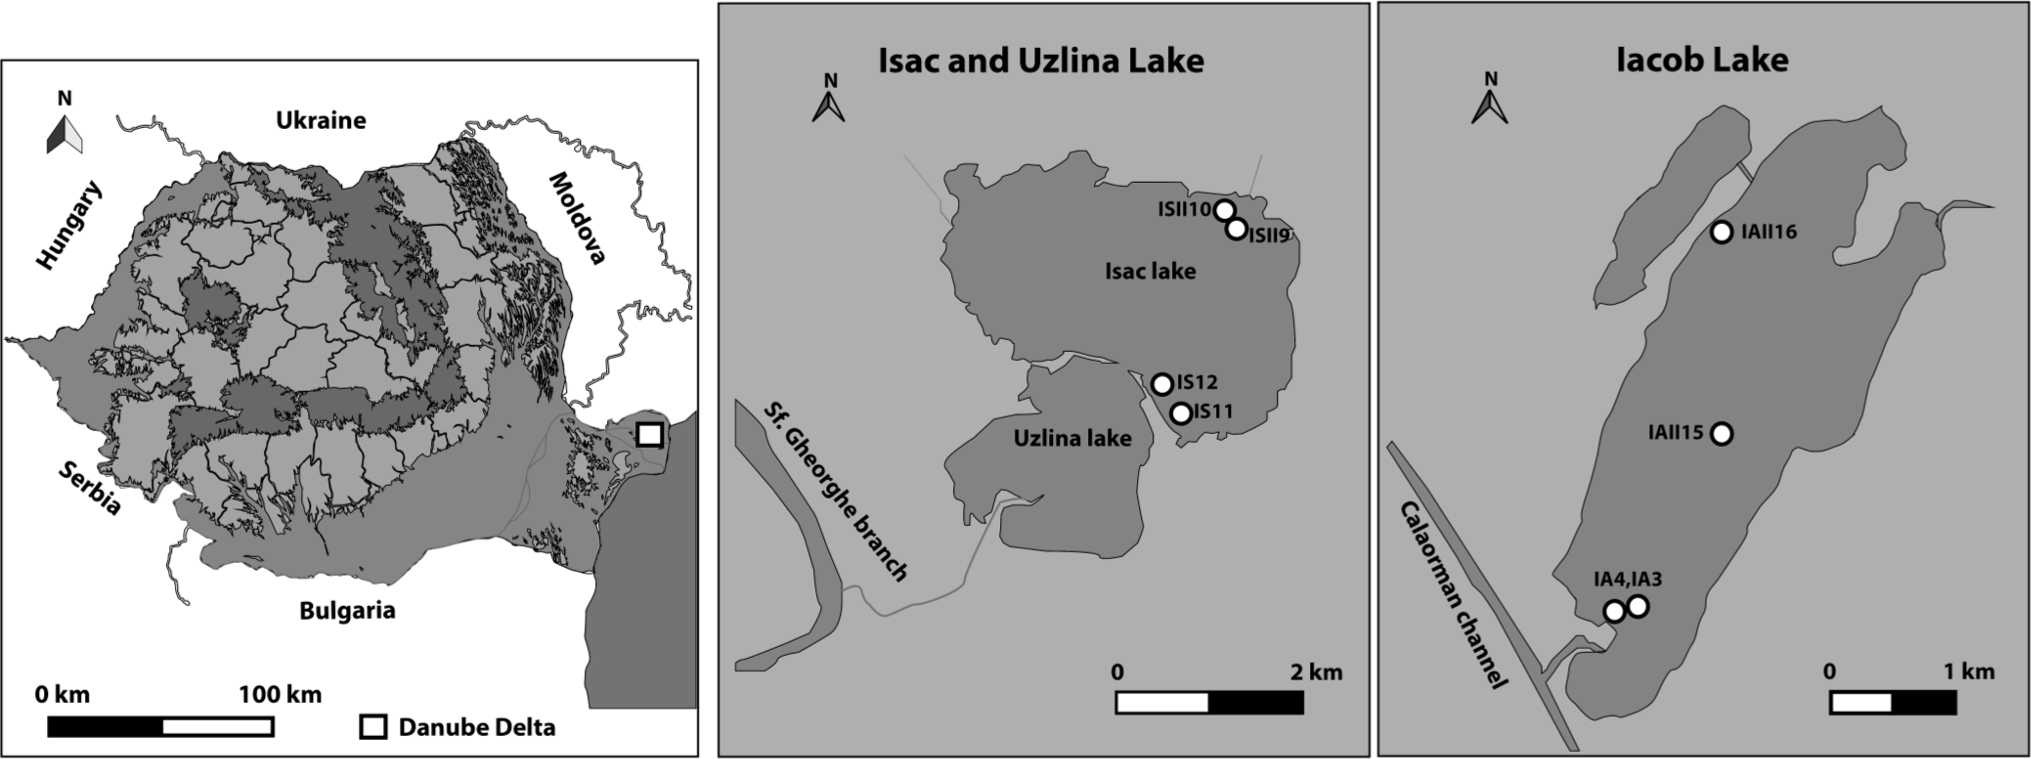
Four sediment cores with lengths in the 42–77 cm range were taken from each lake using a gravity corer during two sampling campaigns: IA3 (45° 07′ 49.3″ N, 29° 23′ 38.8″ E) and IA4 (45° 07′ 49,7″ N, 29° 23′ 43,2″ E) and, respectively, IS11 (45° 05′ 51.7″ N, 23° 16′ 35.3″ E) and IS12 (45° 05′ 57.4″ N, 23° 16′ 28.7″ E), were taken in November 2013, while IAII15 (45° 8′ 9,50″ N, 29° 24′ 3,10″ E) and IAII16 (45° 9′ 8,70″N, 29° 24′ 2,70″ E) and, respectively, ISII9 (45° 06′ 55.9″ N, 29° 17′ 36.7″ E) and ISII10 (45° 07′ 01.5″ N, 29° 17′ 36.7″ E), were taken in August 2014.
. Materials and Methods
Each of the sediment cores was sub-sampled into 1–3 cm slices. The sub-samples (2–5 g) of the sliced core sections were used for measuring the physical characteristics of the sediment sample, including bulk density, water content and porosity, as described in Saravana Kumar et al., 1999. The porosity was calculated from the fluid capacity of the interconnected pores. By dividing the pore volume by the bulk volume, the porosity in percent terms can be determined (Manger et al., 1963).
The remaining quantity of each sub-sample was dried in a drying oven at 75°C, until a constant mass was obtained. After grinding, sieving and homogenisation, the samples were stored in the laboratory for α and γ spectrometric measurements. LOI (Loss on Ignition) measurements were performed to determine the organic mass (OM) and carbonate content (IOC) at 350°C and 750°C respectively, the sum of the two (OM and IOC) giving the total carbon content (TOC).
210Pb chronology
Gamma spectrometry
Samples for gamma spectrometric measurements were placed in cylindrical aluminium boxes (6 cm diameter and 1cm height) sealed with aluminium tape, to avoid the 222Rn loss. For the gamma spectrometric measurements ~15–20 g dried sediment samples were used. The sealed boxes were stored for 3 weeks in order to reach the radioactive equilibrium between 226Ra and its progenies.
High resolution γ spectrometric analyses were carried out using an ORTEC GMX type HPGe detector (0.878 keV FWHM at 5.9 keV and 1.92 keV at 1.33 MeV with a relative efficiency of 34.2% and a 0.5 mm Be window) for the determination of the supported 210Pb. The 226Ra was measured via 222Rn and its short life products 214Pb (using the 295.1 keV and 352.0 keV energy photo-peaks) and 214Bi (using the 609.3 keV photo-peak) (Moor, 1984); for 137Cs the 661.7 keV energy gamma line was used. To determine the activity concentration of the radionuclides the relative method was applied using the IAEA-385 Irish Sea sediment (for the 226Ra determination) and IAEA-375 (for the 137Cs determination) reference materials. The minimum acquisition time for all measurements was 80.000 s.
Alpha spectrometry
The total 210Pb content was measured via alpha spectrometry, using 210Po, by the chemical separation of the Polonium isotope from the sediment matrix and from the other alpha emitters. For each 0.5 g of dried homogenised sediment sample, 0.3 ml of 209Po tracer (with 100 mBq/ml activity) was added, in order to determine the chemical yield. Acid digestion was carried out by using 20 ml of concentrated HNO3 in three steps; each time the sample was evaporated until near-dryness. After these, 20 ml of concentrated HCl in three doses was used. For the elimination of organic matter some drops of H2O2 were added. In order to eliminate the acids, 20 ml of distilled water was added and evaporated until near-dryness. The last procedure was repeated three times. The 210Po sources were prepared by spontaneous deposition on the surface of high Ni content stainless steel discs in an HCl acid medium with 0.5–1 pH for 3 h at 85°C. Interferents (Fe-ions) were eliminated by adding ascorbic acid for the formation of iron complexes (Begy et al., 2015b). The obtained sources were measured by an ORTEC SOLOIST 900 mm2 PIPS detector (19 keV resolution) and an ASPEC-92 data acquisition system.
The constant rate of the 210Pb supply (CRS) model was used to determine the ages and sedimentation rates of each sub-sampled sediment layer. This model is used if the sediment accumulation is not constant over time (deltaic lakes showing dynamic changes over short periods), but if it can be presumed that the rate of the unsupported 210Pb deposition is permanent (Appleby et al., 2001).
Heavy metal analyses
In Lake Iacob the heavy metal concentrations were measured using an Inductively Coupled Plasma Mass Spectrometer of the SCIEX Perkin-Elmer Elan DRC II type. Measurements were made for Li, Mg, Al, K, Cr, Mn, Fe, Co, Ni, Cu, Zn, As, Cd, Hg and Pb. For the heavy metal determination the exact measurement method described in Baceva et al., 2011 was used.
. Results and Discussion
The physical parameters
Lakes Iacob and Isac
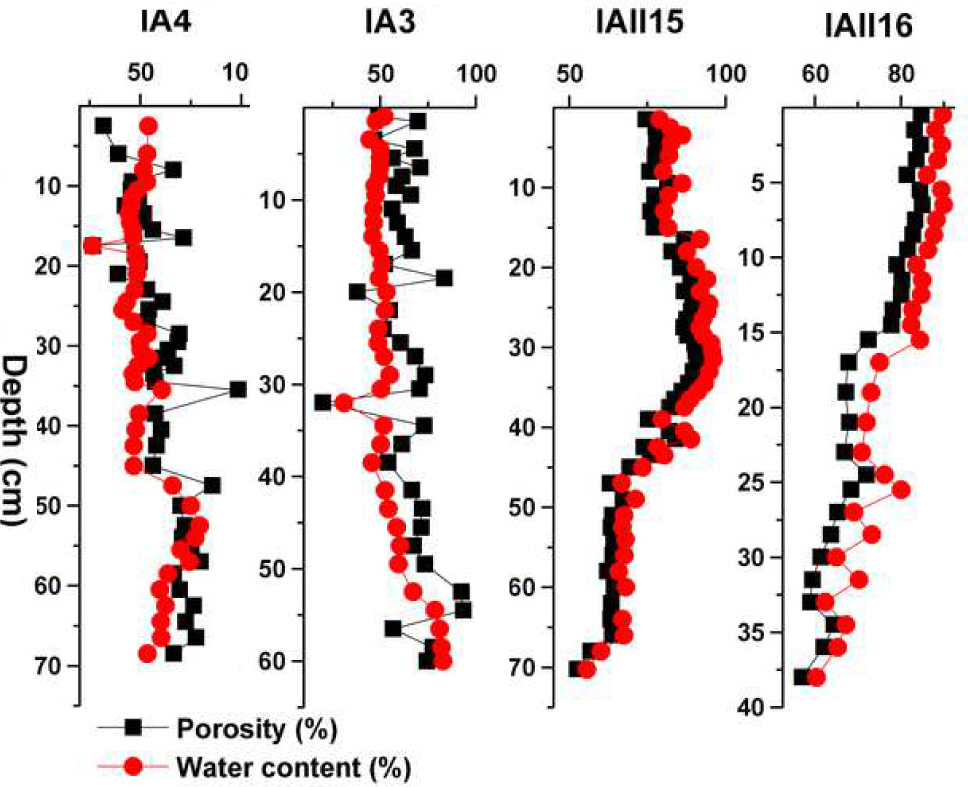
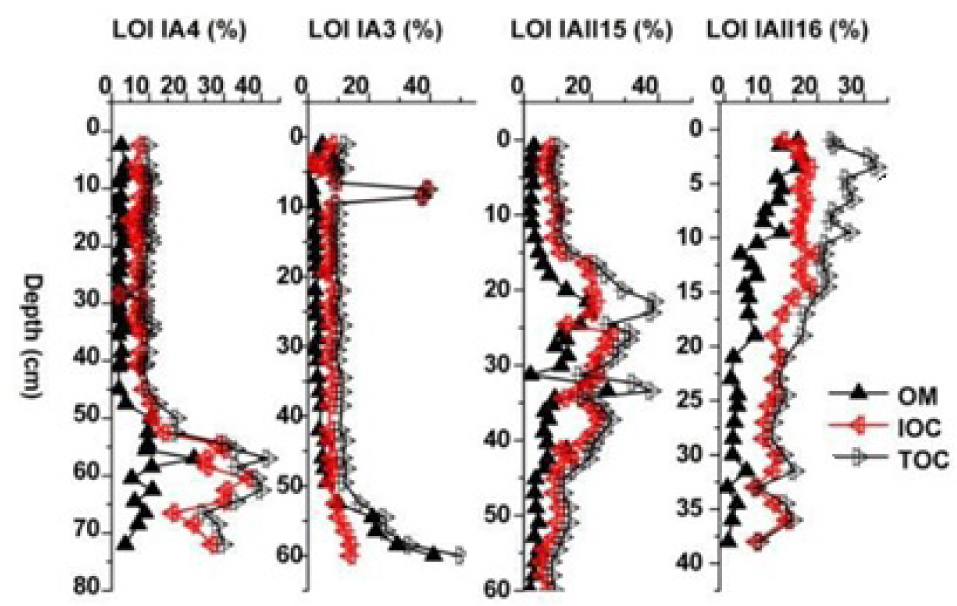
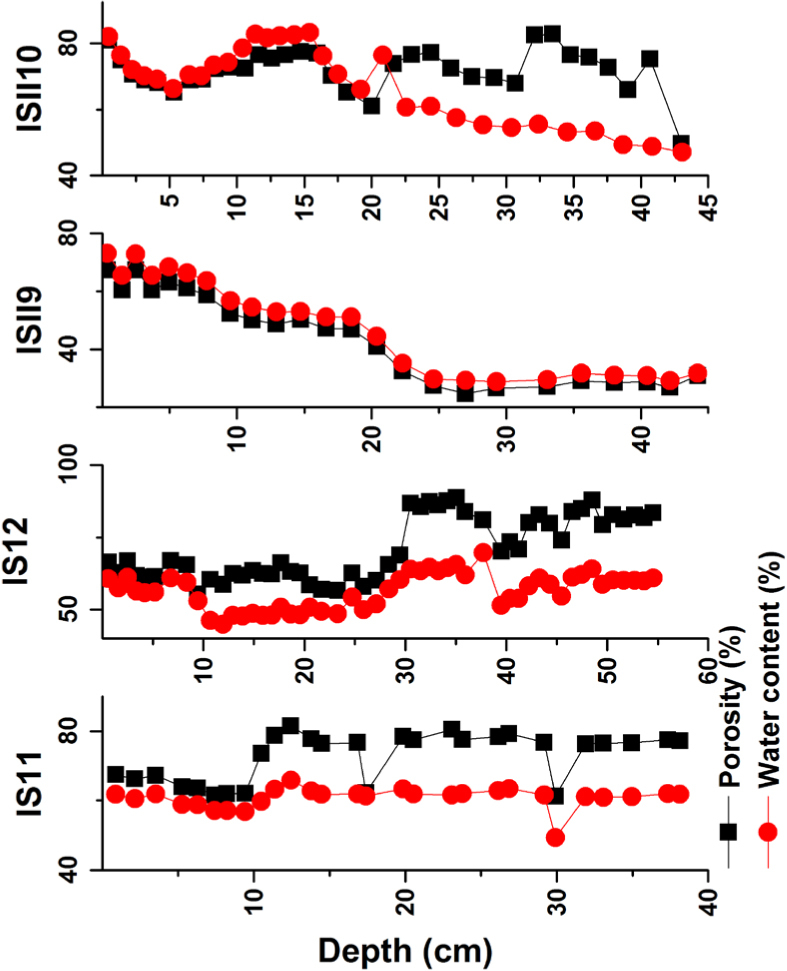
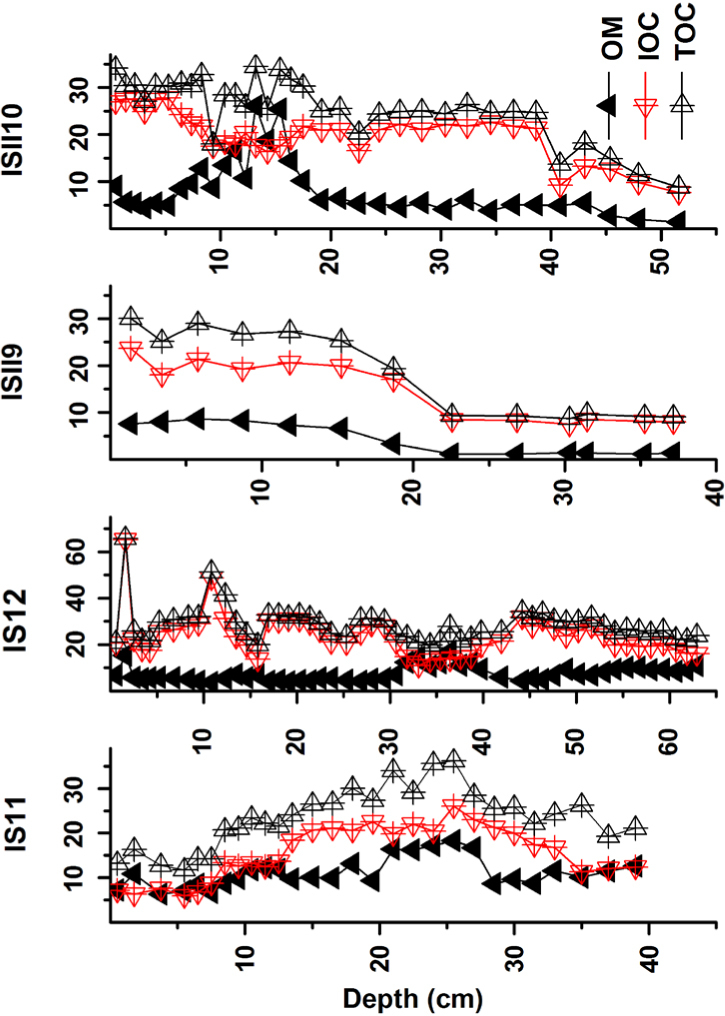
Hakanson (1977) observed a correlation between the OM and water content of the sediments when analysing the Swedish Lake Ekoln. This connection is apparent in the sediments of Lakes Iacob and Isac, the exception being the IA3 core in the case of Lake Iacob, where the water content does not increase in the same manner as the OM, probably because of the compaction of the sediment (Fig. 2). Where the water content and the porosity did not correlate with the OM quantity, the deposition of inorganic matter was higher than that of the OM (Fig. 3). Because the pressure in the upper layers was lower than that of the lower ones, the porosity and water content of the sediments (the first 15 cm in IAII15 is 75%) was relatively high, despite the OM content’s being low (the first 15 cm in IAII15 is 2%). This was also influenced by the location of the sampling point. Although the water content of IAII15 shows an increase from 44% to 80% in the first 34 cm, this was followed by a decrease in the next 72 cm. The water and OM are correlated in Lake Isac, the exception being the first 10 cm of the ISII10 core where the OM was on average 7%, and the water content 73%, where the same process took place as in the case of IAII15 (Figs. 4 and 5).
226The Ra and 210Pb concentrations
Lake Iacob
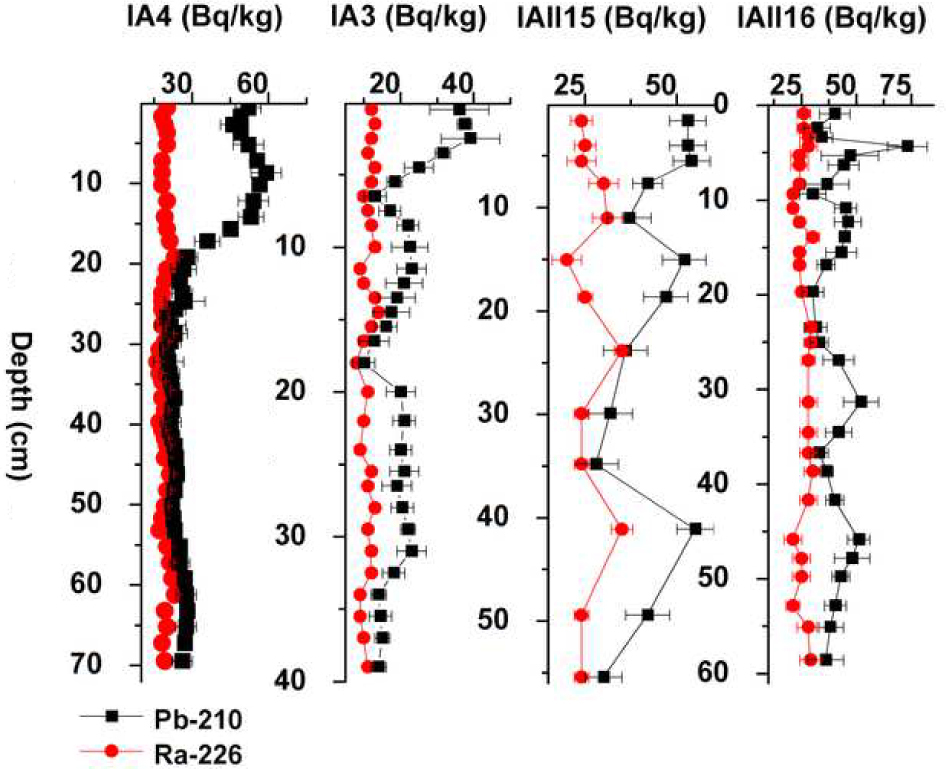
The mean 226Ra concentration had an average of 20 ± 2 Bq/kg in the cases of IA3, IA4 and IAII15, while in the case of IAII15 it was only 15 ± 2 Bq/kg. These values were lower than normal for 25–45 Bq/kg (United Nations, 2008) for the supported 210Pb concentration because the 226Ra was dissolved from the sediment due to the long transport route.
The 210Pb concentration decreased according to the law of disintegration, some perturbation being visible throughout the sediment cores (Fig. 6). The dating horizons were taken at 49 cm for IA3, at 55 cm for IA4, at 69 cm for IAII15 and at 37 cm for IAII16.
Lake Isac
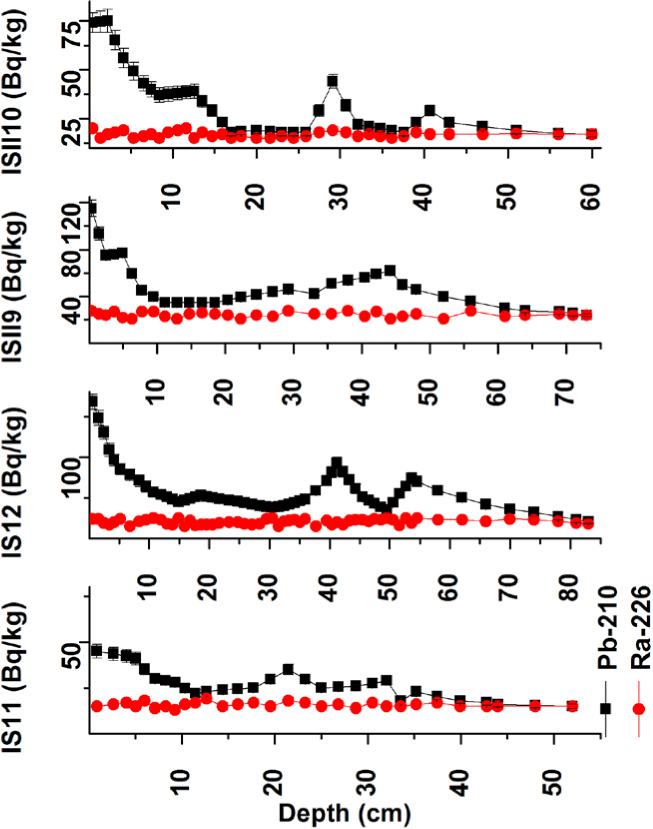
In the case of IS12 and ISII9, the 226Ra concentration had an average of 30 ± 4 Bq/kg, while in the case of IS11 and ISII10 this value was lower: 13 ± 2 Bq/kg (Fig. 7). The latter two sampling points were in the proximity of the inflow channels and a greater 226Ra quantity could be dissolved. The dating horizons were taken at 34 cm for IS11, at 75 cm for IS12, at 65 cm for ISII9 and at 51cm for ISII10.
Age depth models of the sediment cores
Iacob Lake
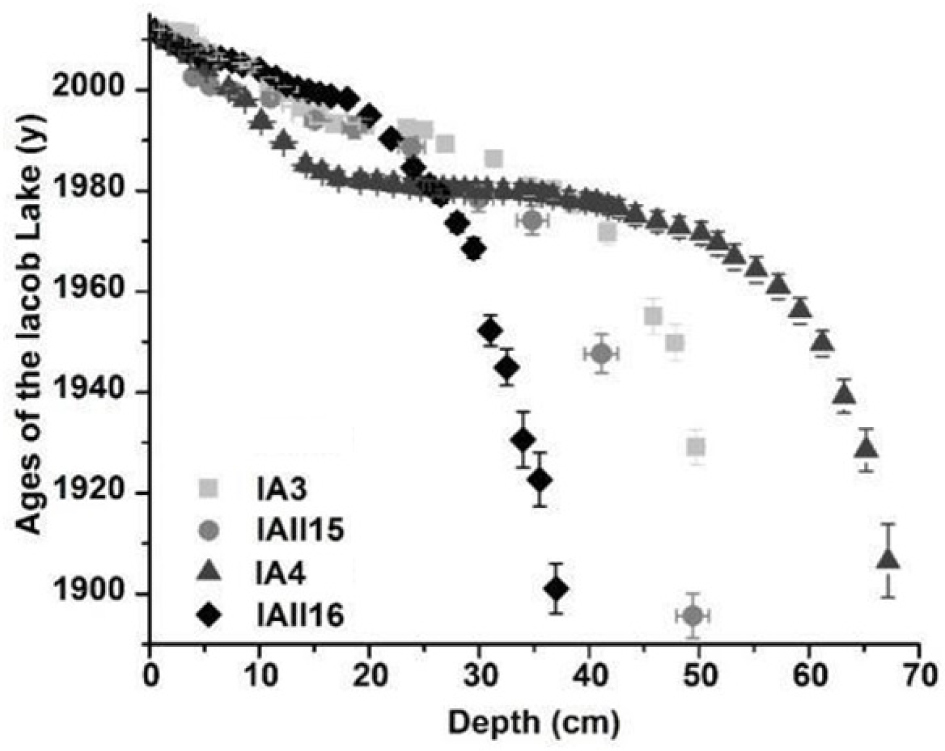
A comparison of the age distributions as correlated with the depth of the distinct sediment cores is shown in Fig. 8. It is clear that the deposed sediment quantity is proportional with the consistency of the age/depth function. For example in the IAII15 core the period of 19–55 cm shows ages of 1976 ± 5 y and a high sedimentation rate. Similar decreasing tendencies are apparent in the IA3 and IA4 cores taken from each other’s proximity in order to examine the sampling technique, which prove the consistency of the sampling procedure.
In all cases 137Cs measurements were taken to validate the determined ages for the sediment layers. In Fig. 9 the two peaks for 1986 (the Chernobyl nuclear accident) and, respectively, 1963 (nuclear weapon tests) are visible, while the ages correspond to the obtained data resulting from the CRS model calculations. It is noticeable that the two 137Cs peaks have similar activities, although the values for Chernobyl should be higher. This is due to the fact that the radioactive cloud of the Chernobyl nuclear accident spread mostly throughout central Romania, and the eastern part of Germany and Austria, where the Danube has parts of its catchment area.
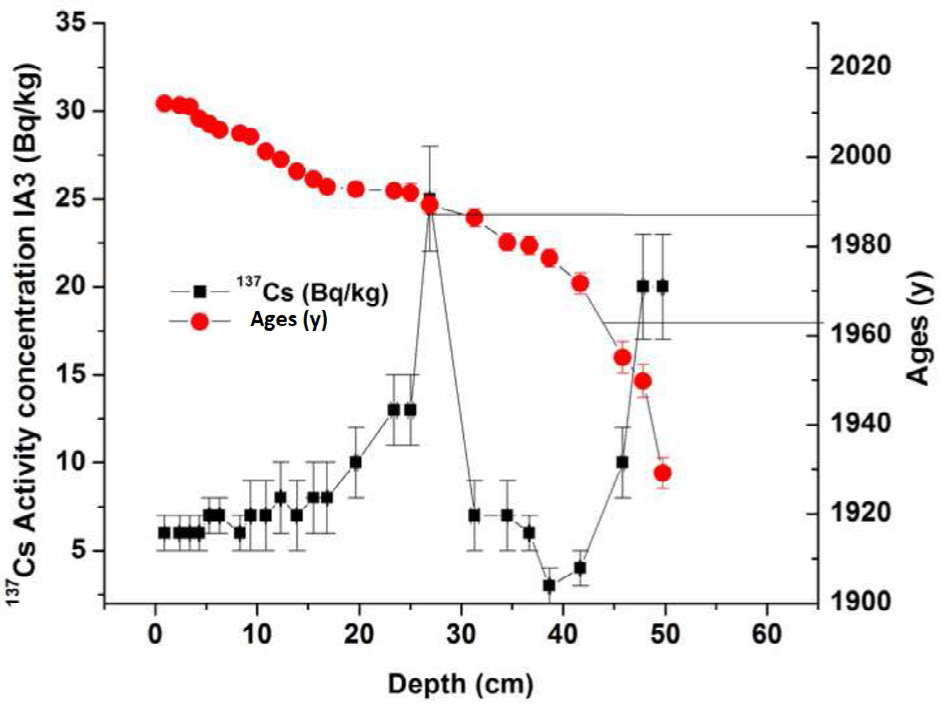
The 137Cs contamination originating from the Chernobyl nuclear accident is relatively low. However, the thermonuclear weapon test with maximum 137Cs contamination in 1963 caused general, evenly spread, contamination throughout the entire catchment area.
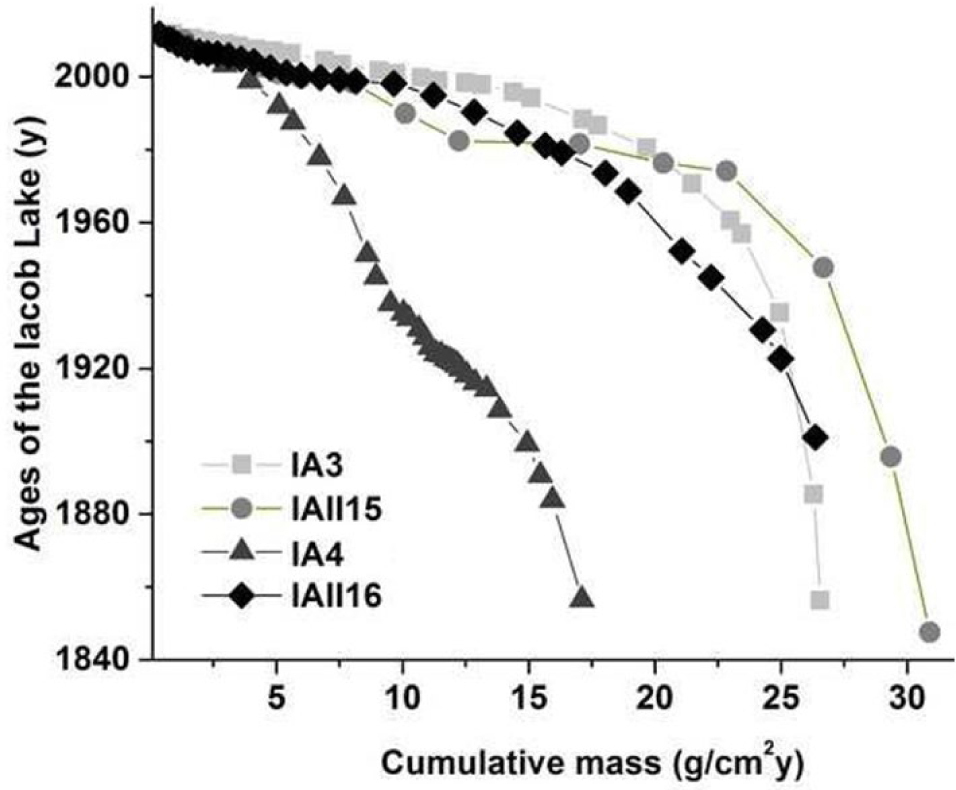
From the sediment dynamics point of view, the sampling points situated in the vicinity of the main inflow channel and the one situated at the secluded shore show similar increases in cumulative mass (Fig. 10), reaching values in the 27–32 g/cm2y range, while the one situated in the middle of the lake (IAII15) receives the least quantity of sediment (17 g/cm2y).
Lake Isac
Lake Isac has a high biomass content, and the development of algae types is favourable in the lake. Also, there is intense vegetation in the areas of the sampled cores, the OM content being commensurately high in the sediment.
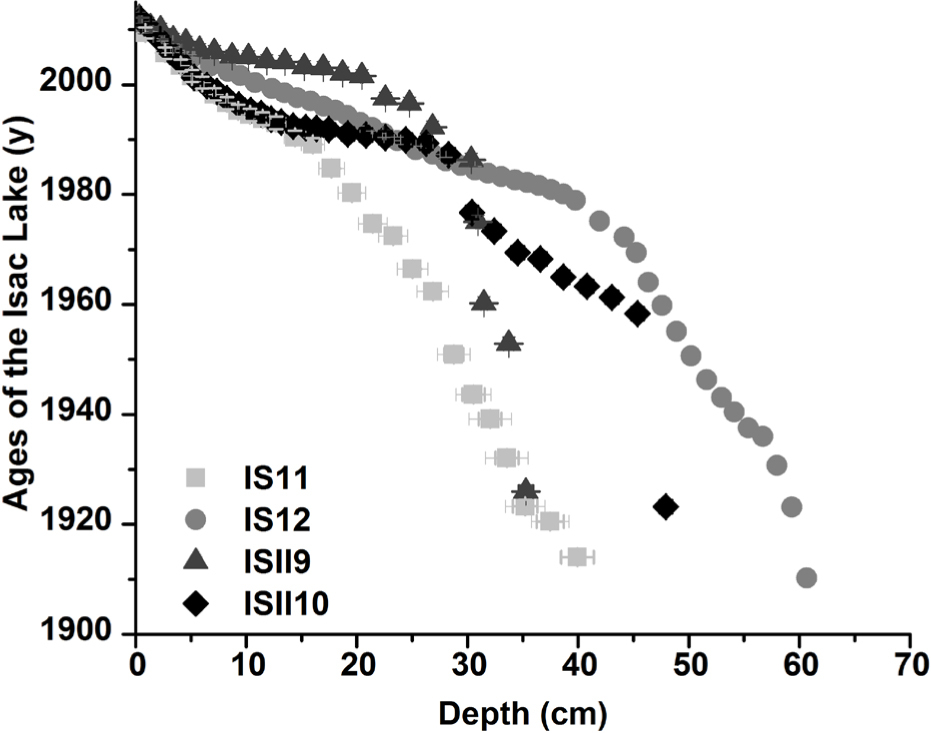
The ages decrease similarly in the case of the IS11 and ISII10 in the first 15 cm, the two cores having a similar OM content, meaning that in the last 15 years the sediment has been deposited uniformly in the two sampling areas, the decomposing vegetation having had a dominant role. After the first 15 cm of the ISII10 core, a plateau is visible, which points to a great influx of sediment over a 2 year time span, and correlates with the OM content of the sediment core. This is also visible in the ISII9 core, where the extent of the compaction decreases with the OM content. In IS12, a compaction, together with the increase of OM, is also evident. The sediment layer corresponding to 1920 can be found at the 35–60 cm depth. The most sediment was deposited in the area of the IS12 core, which points to greater exposure.
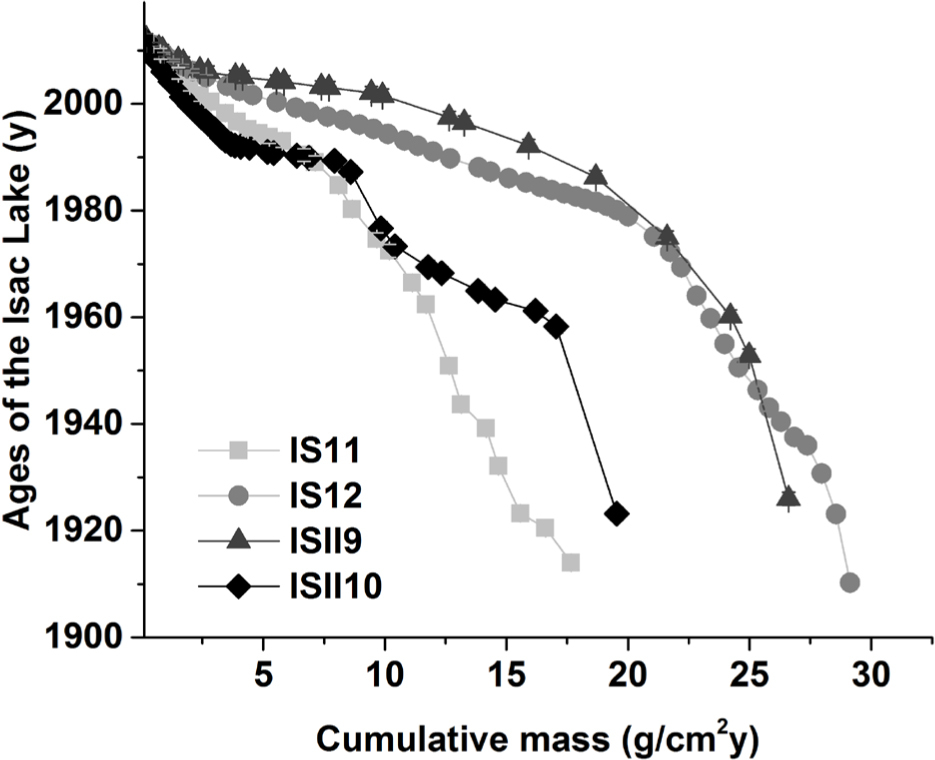
The exposure of the sampled cores can be shown with the cumulative mass in accordance with the obtained ages. The most sediment is deposited in the areas of the IS12 and ISII10 sampling points, because of their proximity to the channel entrances, while IS11 and ISII9 are further away (Fig. 12).
Sedimentation rates
Lake Iacob
Analysing the sedimentation of IA3, four peaks are evident, providing information about the past hydrological events, i.e. the floods of 1980, 1991–1993, 2004 and 2011. The deposited sediment quantity and its velocity show that the 1991–1993 flooding was the most significant. The values for mass sedimentation exceed 2.2 ± 0.09 g/cm2y (Fig. 13). The 2004 and 2011 peaks were also the consequences of major floods, with peak discharges of 10,800 m3/s and, respectively, 10,200 m3/s. Similar four sedimentation peaks were measured by Babic Mladenovic and his team (Babic Mladenovic et al., 2013) in the suspended sediment behind Iron Gate 2. Compared with IA3, IA4 shows three maximum values: in 1974, 1980 and 1998. Although the above mentioned cores were taken in close proximity, and the decreases in the ages in accordance with depth, shows a similar trend, the correlation between the peaks visible in the sedimentation rate is not conclusive. This might be due to the fact that the sectioning of the sub-samples of the two cores was made differently, IA3 being cut into smaller layers, so its resolution for sedimentation rates is higher.
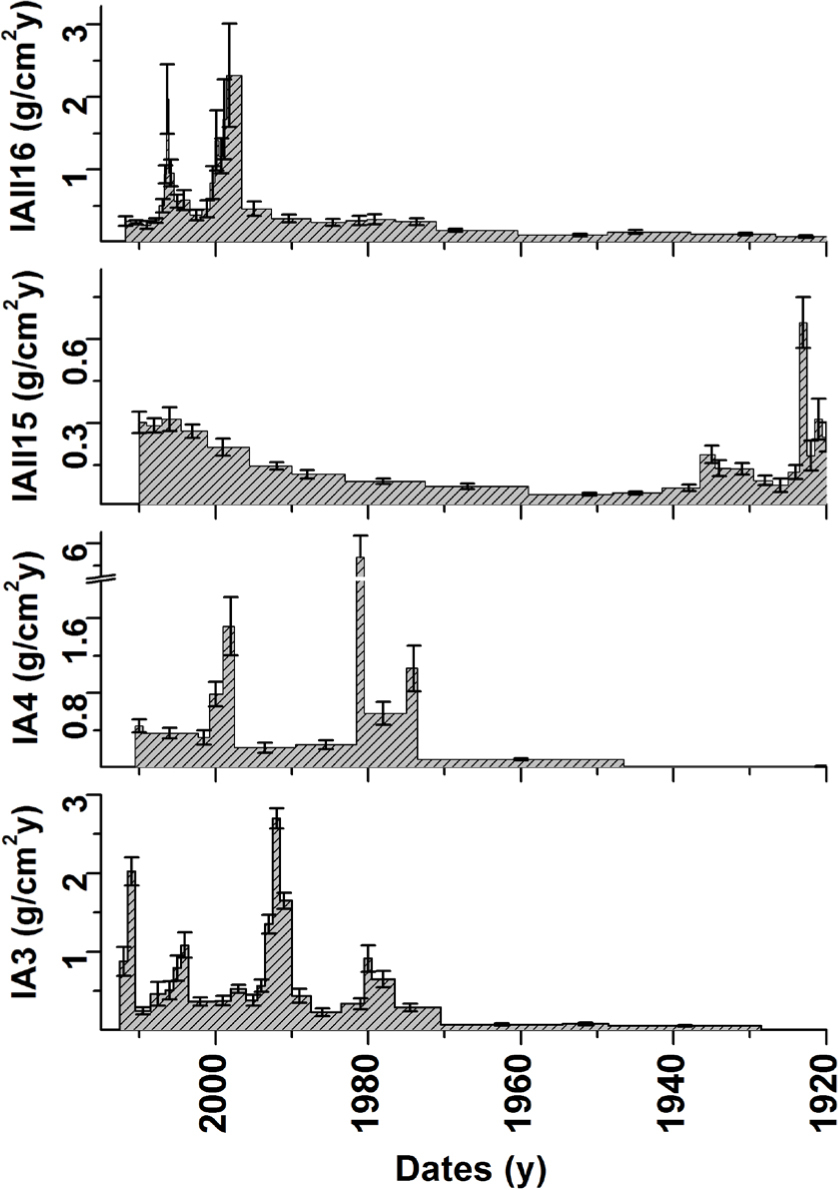
The sedimentation rates corresponding to the IAII15 sampling point shows the least intake, the values ranging up to 0.61 ± 0.18 g/cm2y, while the highest values were recorded in the 1948–1952 period. An increase in the sedimentation rates is visible after 1973, the values increasing by up to 5.2 times until 2013. In case of IAII16, two peaks are visible, i.e. in 1998–2000 and 2004–2008.
The peaks recorded in 1974 and 1980, visible in three of the sediment cores (IA3, IA4 and IAII16), show a gradual sedimentation decrease starting in 1972, when the Iron Gates hydroelectric power station was built, from 0.418 ± 0.14 to 0.376 ± 0.1 g/cm2y, and if a longer period is used for calculation, between 1972–1989, the average decreased to 0.2 ± 0.08 g/cm2y, which is almost half the sediment levels. This artificial dam also has a sediment-intake-regulating function, since floods with discharges over 11,000 m3/s were registered once a year in the 1974–1982 period.
Lake Isac
According to the sampling points, the cores can be grouped into two areas: samples ISII9 and ISII10 from the north-eastern part of the lake, close to the entry channel, and IS11 and IS12 from the south-eastern part, close to the Uzlina entry channel.
For IS11, the mean mass sedimentation was 0.45 g/cm2y. Five peaks are visible: in 2014, 2001, 1998, 1991–1994 and 1988. The deposited mass sedimentation quantity shows that the 1991–1993 flooding period was the most significant (0.82 ± 0.07 g/cm2y) (Fig. 14). In the IS12 core, the 1991–1993 flooding period is not apparent because of the sharp increase in the mass sedimentation rate from the early 1980s, forming a high range of peaks which had three maxima. Comparing the 1986 data to the 1978–1980 sedimentation rates, these increased to double the values, and the average of the mass sedimentation rate was 0.63 ± 0.05 g /cm2y. It is clear that because it was closer to the entry channel, the mean of the mass sedimentation in the IS12 core was 28% higher than that of IS11. In the ISII9 case before 1980, the mass sedimentation rate was relatively constant at 0.11 ± 0.01 g/cm2y. After 1980, this constant value increased sharply to 0.51 ± 0.06 g/cm2y from 0.06 ± 0.01 g/cm2y and 15 years later the sedimentation rate increased by a further 4.3 times, the maximum of 3.95 ± 0.06 g/cm2y being observed in 2002. In the ISII10 core, the sedimentation rate decreased in 1950 to 0.13 ± 0.01 g/cm2y from 0.86 ± 0.12 g/cm2y recorded ten years before. After the 1970s the sedimentation rate decreased from 0.61 ± 0.14 g/cm2y to 0.22 ± 0.03 g/cm2y; this year the Iron Gates hydroelectric power station was built. In this core average the mass sedimentation rate was 0.43 ± 0.03 g/cm2y.
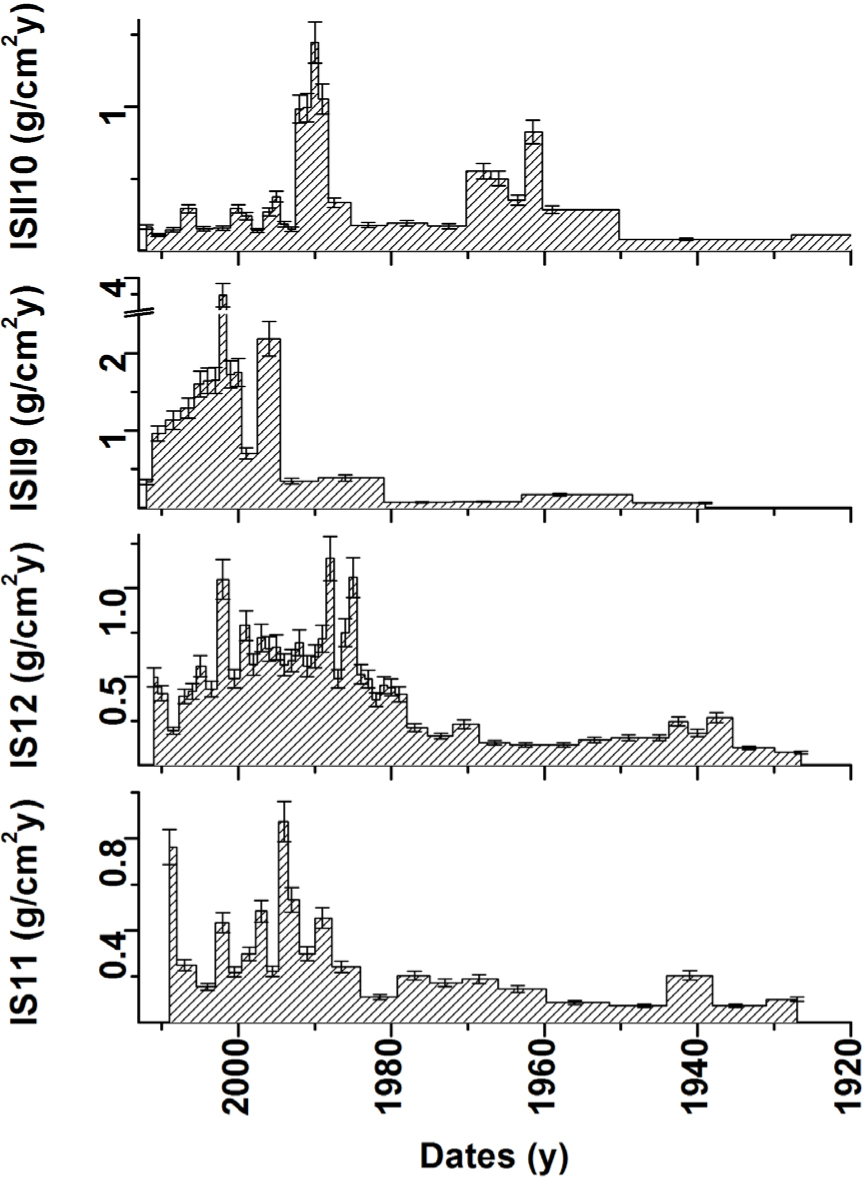
The entire sediment core shows increases in the sedimentation rates after 1980, because of the increase in tree felling, which has a direct proportional effect on sediment accumulation. In the ISII10 core it is shown that the sedimentation rate decreased drastically and was in the 0.14–0.22 g/cm2y range until 2014. The increases in the ISII9 sedimentation rates happened simultaneously with the decreases of the sedimentation rates in the ISII10 sampling point.
This could have been due to the fact that until the 1990s the western part of the entrance to the north-eastern channel was more exposed to sediment deposition than the eastern part, the continuously deposited sediment building a natural barrage overtime. After 1990, the majority of the incoming sediment started to settle in the eastern part of the lake.
Heavy metal concentrations
Heavy metal concentration measurements were carried out on the IA3 sediment core situated in the south, at the main inflow of the lake. The concentrations of the lowest sediment layer are considered to be those of marine substrate, these values being compared with those measured in higher levels.
The average heavy metal and mineral concentrations were as follows: 16.933 ppm Li, 3.955% Mg, 10.726% Al, 2.275% K, 28.554 ppm Cr, 291.408 ppm Mn, 14.09% Fe, 6.006 ppm Co, 14.924 ppm Ni, 22.883 ppm Cu, 8.289 ppm As, 401.883 ppb Cd, and 245.45 ppb Hg. In the case of Zn and Pb, half the measured samples were below the limit of detection, their highest values being 78.469 ppm and 11.575 ppm respectively. The obtained results are on average 3–4 times higher than the values measured in the water during the 2005–2009 period by the Black Sea Scientific Network, but are significantly lower than the values measured in the marine substrate.
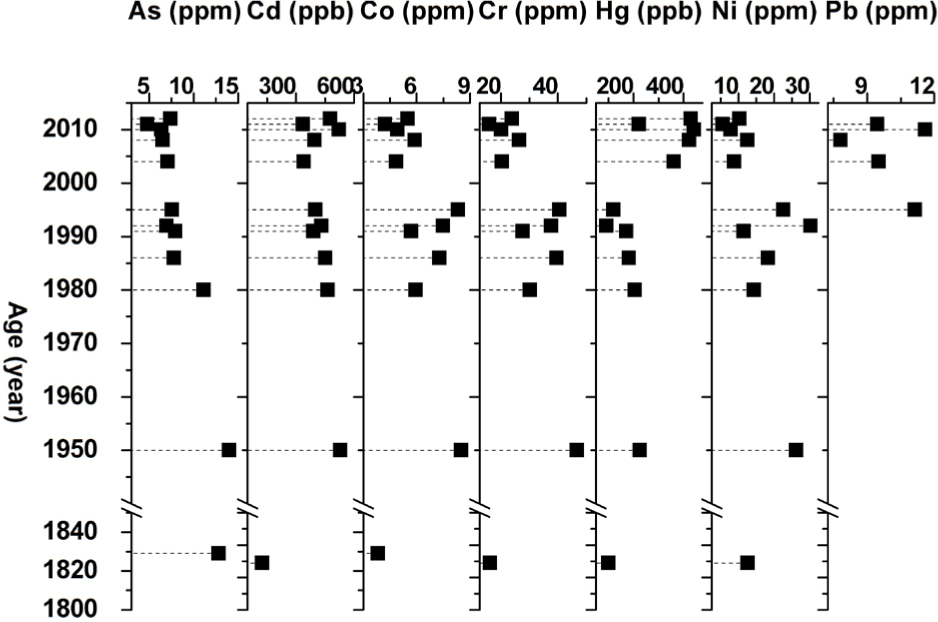
As, Cd, Co, Cr, Hg and Ni started to appear in 1980 (Fig. 10), when the Danube Delta received a great amount of sediment (confirmed by the high sedimentation rates in the 1974–1982 period). The metallurgical industry in Romania was the most flourishing in the 1950–1982 period, when 6 metallurgical factories were constructed, one of them being at the edge of the Danube Delta, in Tulcea Slatina. The decreasing heavy metal content in the 1990s can be an indicator of the failure of industrial production due to political changes in eastern Europe and Romania starting in the 1987–1989 period. With the decline of the metallurgical industry, the heavy metal movements were not over: as can be seen in Fig. 15, in some cases this decrease is present only after 1995, which can be influenced by the heavy metal dissolution of polluted soils and the decomposition of contaminated vegetation. The Cd shows a relative consistency, with an average of 548± 61 ppb. This value is normal compared to the Cd concentration from most soils worldwide, which does not exceed 1.0–1.1 ppm (Kabata-Pendias 2001), while the values of Hg and Pb seemed to be increasing in the upper layers of the sediment core. The increased Pb concentration was caused by the increases in the Pb releases in the 2010–2013 period to 5.4 tonnes/y, whereas in the 2005–2010 period it was only 1.7–0.3 tonnes/y (ANPM report, 2013). The anthropogenic sources of Pb can be traffic, metallurgical mining, batteries, old lead-based paints, and sewage sludge (Salminen et al., 2005). Cr, Co and Ni show lower values compared to the (on average) 1.45 times higher values registered in the 1980–1995 period. In the case of As, concentrations show a decreasing trend compared to the 14 ppb measured in the marine substrate, the values reaching 4 ppm by 2013. The average content of As in soil in the Earth was 6.8 ppm (Kabata-Pendias, 2011).
. Conclusions
The first study for applying the 210Pb dating method and the 137Cs validation was carried out on Lake Isac and Iacob from the Danube Delta, Romania. These lakes were assessed the first time due to alpha and gamma spectrometric measurements, which were carried out to measure the radionuclides of interest (210Pb/ 210Po, 226Ra and 137Cs) in the Danube deltaic sediments. The geochronology of the sediment layers was generated and sedimentation rates were assessed in order to determine the dynamics of the sedimentation processes involved in the evolution of the Danube Delta, and, more precisely, Lake Iacob The reconstruction of heavy metal concentrations in each sediment layer was also made in the case of the IA3 sediment core.
The low OM content meant, that the increases in the sedimentation rates in these cases had no correlation with the decaying organic matter, but with the quantity of sediment transported by the Danube. The results show that mean sedimentation rates in case of Lake Iacob were 0.51 ± 0.08, with a max. of 3.84 ± 0.05 and a min. of 0.03 ± 0.01 g/cm2. In the case of Lake Isac the mass sedimentation average was 0.58 ± 0.09 g/cm2, the maximum being 3.95 ± 0.06 g/cm2y and the minimum 0.02 ± 0.01 g/cm2y. A quasi-similar pattern in the sedimentation rates can also be found in the water, and the sediment in- and out-flow behind Iron Gate 2, which correspond to major flooding events from the previous 50 years, where discharges of over 10,000 m3/s were measured in the catchment areas of the Danube Delta.
The sedimentation rates can be divided into four major periods: 1940–1972 (1972 is the date of the construction of the Iron Gates), 1972–1980, 1972–1989 (the period until the regime changes in Romania), and 1989–2013. In the case of Lake Iacob in the first period the average sedimentation rate was 0.418 g/cm2y, in the second it slowly decreased to 0.376 g/cm2y, and in the third period it decreased to 0.209 g/cm2y, which means a retention of 27.3% of the sediment after the IG power-plant construction. In the case of Lake Isac, the changes are more visible: in the first period the sedimentation rate had an average of 0.446 g/cm2y, and in the second it decreased to 0.197 g/cm2y, which means a 42.35% retention of sediment. After that, in the third period, the sedimentation slowly increased to 0.269 g/cm2y. In the last period, in both the lakes, a big increase in the sedimentation rate is visible in Lake Iacob – by more than three times (0.677 g/cm2y) – and in Lake Isac by more than twice (0.715 g/cm2y).
Flooding after 1980 can only be observed in Lake Iacob, because of the Mahmudia meander cutting into the Sf. Gheorghe branch in the 1984–1988 period (Tiron et al., 2009). These are not as visible in the sedimentation rates of Lake Isac – only the IS11 sediment cores show the end of the 1980 flooding period. The mentioned channel cutting is responsible for the increased sedimentation rates starting from 1981 in the IS12 core area.
After the 1970s the sedimentation rate decreased from 0.61 ± 0.14 g/cm2y to 0.22 ± 0.03 g/cm2y, when the Iron Gates hydroelectric power station was built. However, not every sediment core is suitable for the assessment of effects, since a series of other factors (flooding, precipitation quantity, storms, various human interventions etc.) can also influence the sedimentation rates.
A sudden decrease in the total 210Pb content, and stagnation in the age/depth correlation, can be an indicator of a high sediment-intake quantity, as it is in the case of IAII15. The total 120Pb concentration had an average of 37 Bq/kg in the 19–55 cm range and the ages for this period were calculated at 1980 ± 2 y, while mass-sedimentation rates show an average of 1.92 ± 0.34 g/cm2y (compared to the 0.68 ± 0.13 g/cm2y average in the core).
The heavy metal concentrations were on average higher than the values measured in the marine substrate (the exception being As). The results are on average 3.36 times higher than the values measured in the water during the 2005–2009 period by the Black Sea Scientific Network. Pb contamination is visible only from the beginning of the 1990s, when the Pb based fuel was introduced, while Hg concentrations only started to grow after 2000. Ni, Cd, Co and As started decreasing after 1995, since industry had a marked decline after 1989, when some of the major mines and factories were closed down because of the changes in the political regime.