
. Introduction
Anthropogenic radionuclides from the Cold War era above-ground nuclear tests are routinely used to date sediments around the globe (Ketterer et al., 2004a; Sanders et al., 2016; Sanders et al., 2010). These radionuclides, including Pu isotopes, fission products (137Cs, 90Sr, 129I) and activation products (3H, 14C), were deposited globally from the early 1950’s to the late 1960’s from USA and former Soviet Union nuclear bomb testing (Abril, 2003; Alhajji et al., 2014). Plutonium is very useful as a chronological tool as the 239Pu and 240Pu atomic ratios (240Pu/239Pu) can be used to indicate the source. For instance, 240Pu/239Pu atomic ratios from global fallout (~0.18) differ from well-known 240Pu/239Pu atomic ratios from events such as Fukushima (0.30–0.33) (Zheng et al., 2012) and Chernobyl (~0.43) (Ketterer et al., 2004b). These distinct ratios may be useful for separating phases of sediment deposition because the nuclear accidents and testing dates are well known (Kelley et al., 1999).
There are six principal radio-isotopes of Plutonium; 238Pu (t½ = 87.74 years), 239Pu (t½ = 241,100 years), 240Pu (t½ = 6,561 years), 241Pu (t½ = 14.29 years), 242Pu (t½ = 373,000 years) and 244Pu (t½ = 8.3×10⁷ years). The isotopes 238Pu, 239Pu, 240Pu, 242Pu and 244Pu decay through α emission, whereas 241Pu decays through β emissions, producing 241Am (t½ = 432.6 years). Sediments where 240Pu + 239Pu (240+239Pu) activity is first detected represents pre nuclear bomb deposited sediments and hence pre early 1950s deposition. Because plutonium is relatively immobile under both freshwater and saltwater conditions (Ketterer et al., 2004b; Zheng and Yamada, 2004) it is an ideal chronology tool in lake environments.
Anthropogenic radionuclides from atmospheric fallout have been widely used as a tracer of sedimentation processes in the Northern Hemisphere (Abril, 2003; Alhajji et al., 2014; Ketterer et al., 2004a; Omokheyeke et al., 2014; Pourcelot et al., 2003; Quinto et al., 2013; Todorović et al., 2013; Wu et al., 2011; Zheng and Yamada, 2004), and 240+239Pu atomic ratios have been used with great success in fresh water lake studies (Cao et al., 2017; Ketterer et al., 2004a; Łokas et al., 2017; Mietelski et al., 2016a; Wu et al., 2011). Furthermore, plutonium radioisotopes (239+240Pu) have been successfully used as a chronostratigraphic marker in Australia and New Zealand (Everett et al., 2008; Leslie and Hancock, 2008; Sanders et al., 2016; Tims et al., 2013). However, Pu radionuclides have not been used extensively in the South American continent.
The timeframe of when anthropogenic plutonium was deposited globally closely matches periods of rapid and extensive land use change in the Amazon Basin (Barlow et al., 2016). As such, Pu isotopes may be a valuable tool in assessing sedimentation changes in the Amazon floodplains associated with deforestation and/or urbanization. The aim of this study is to assess the potential of 240+239Pu signatures as a geochronology tool to determine the sediment accumulation rates in the Amazon floodplain lakes of the major rivers in the Amazon forest. To achieve this aim, six sediment cores were collected from differing floodplain lakes to construct sediment dates from 1950 to present using anthropogenic (239+240Pu) radionuclide signatures. These deposition chronologies were then compared to ~100 year records using natural (210Pb, 226Ra) radionuclide tracers. The dating methods outlined in this work will be used to form geochronologies during the 20th century, a timeframe that the Amazon has experienced substantial deforestation and significant changes in sediment loads (Barlow et al., 2016; Rowland et al., 2015).
. Material and Methods
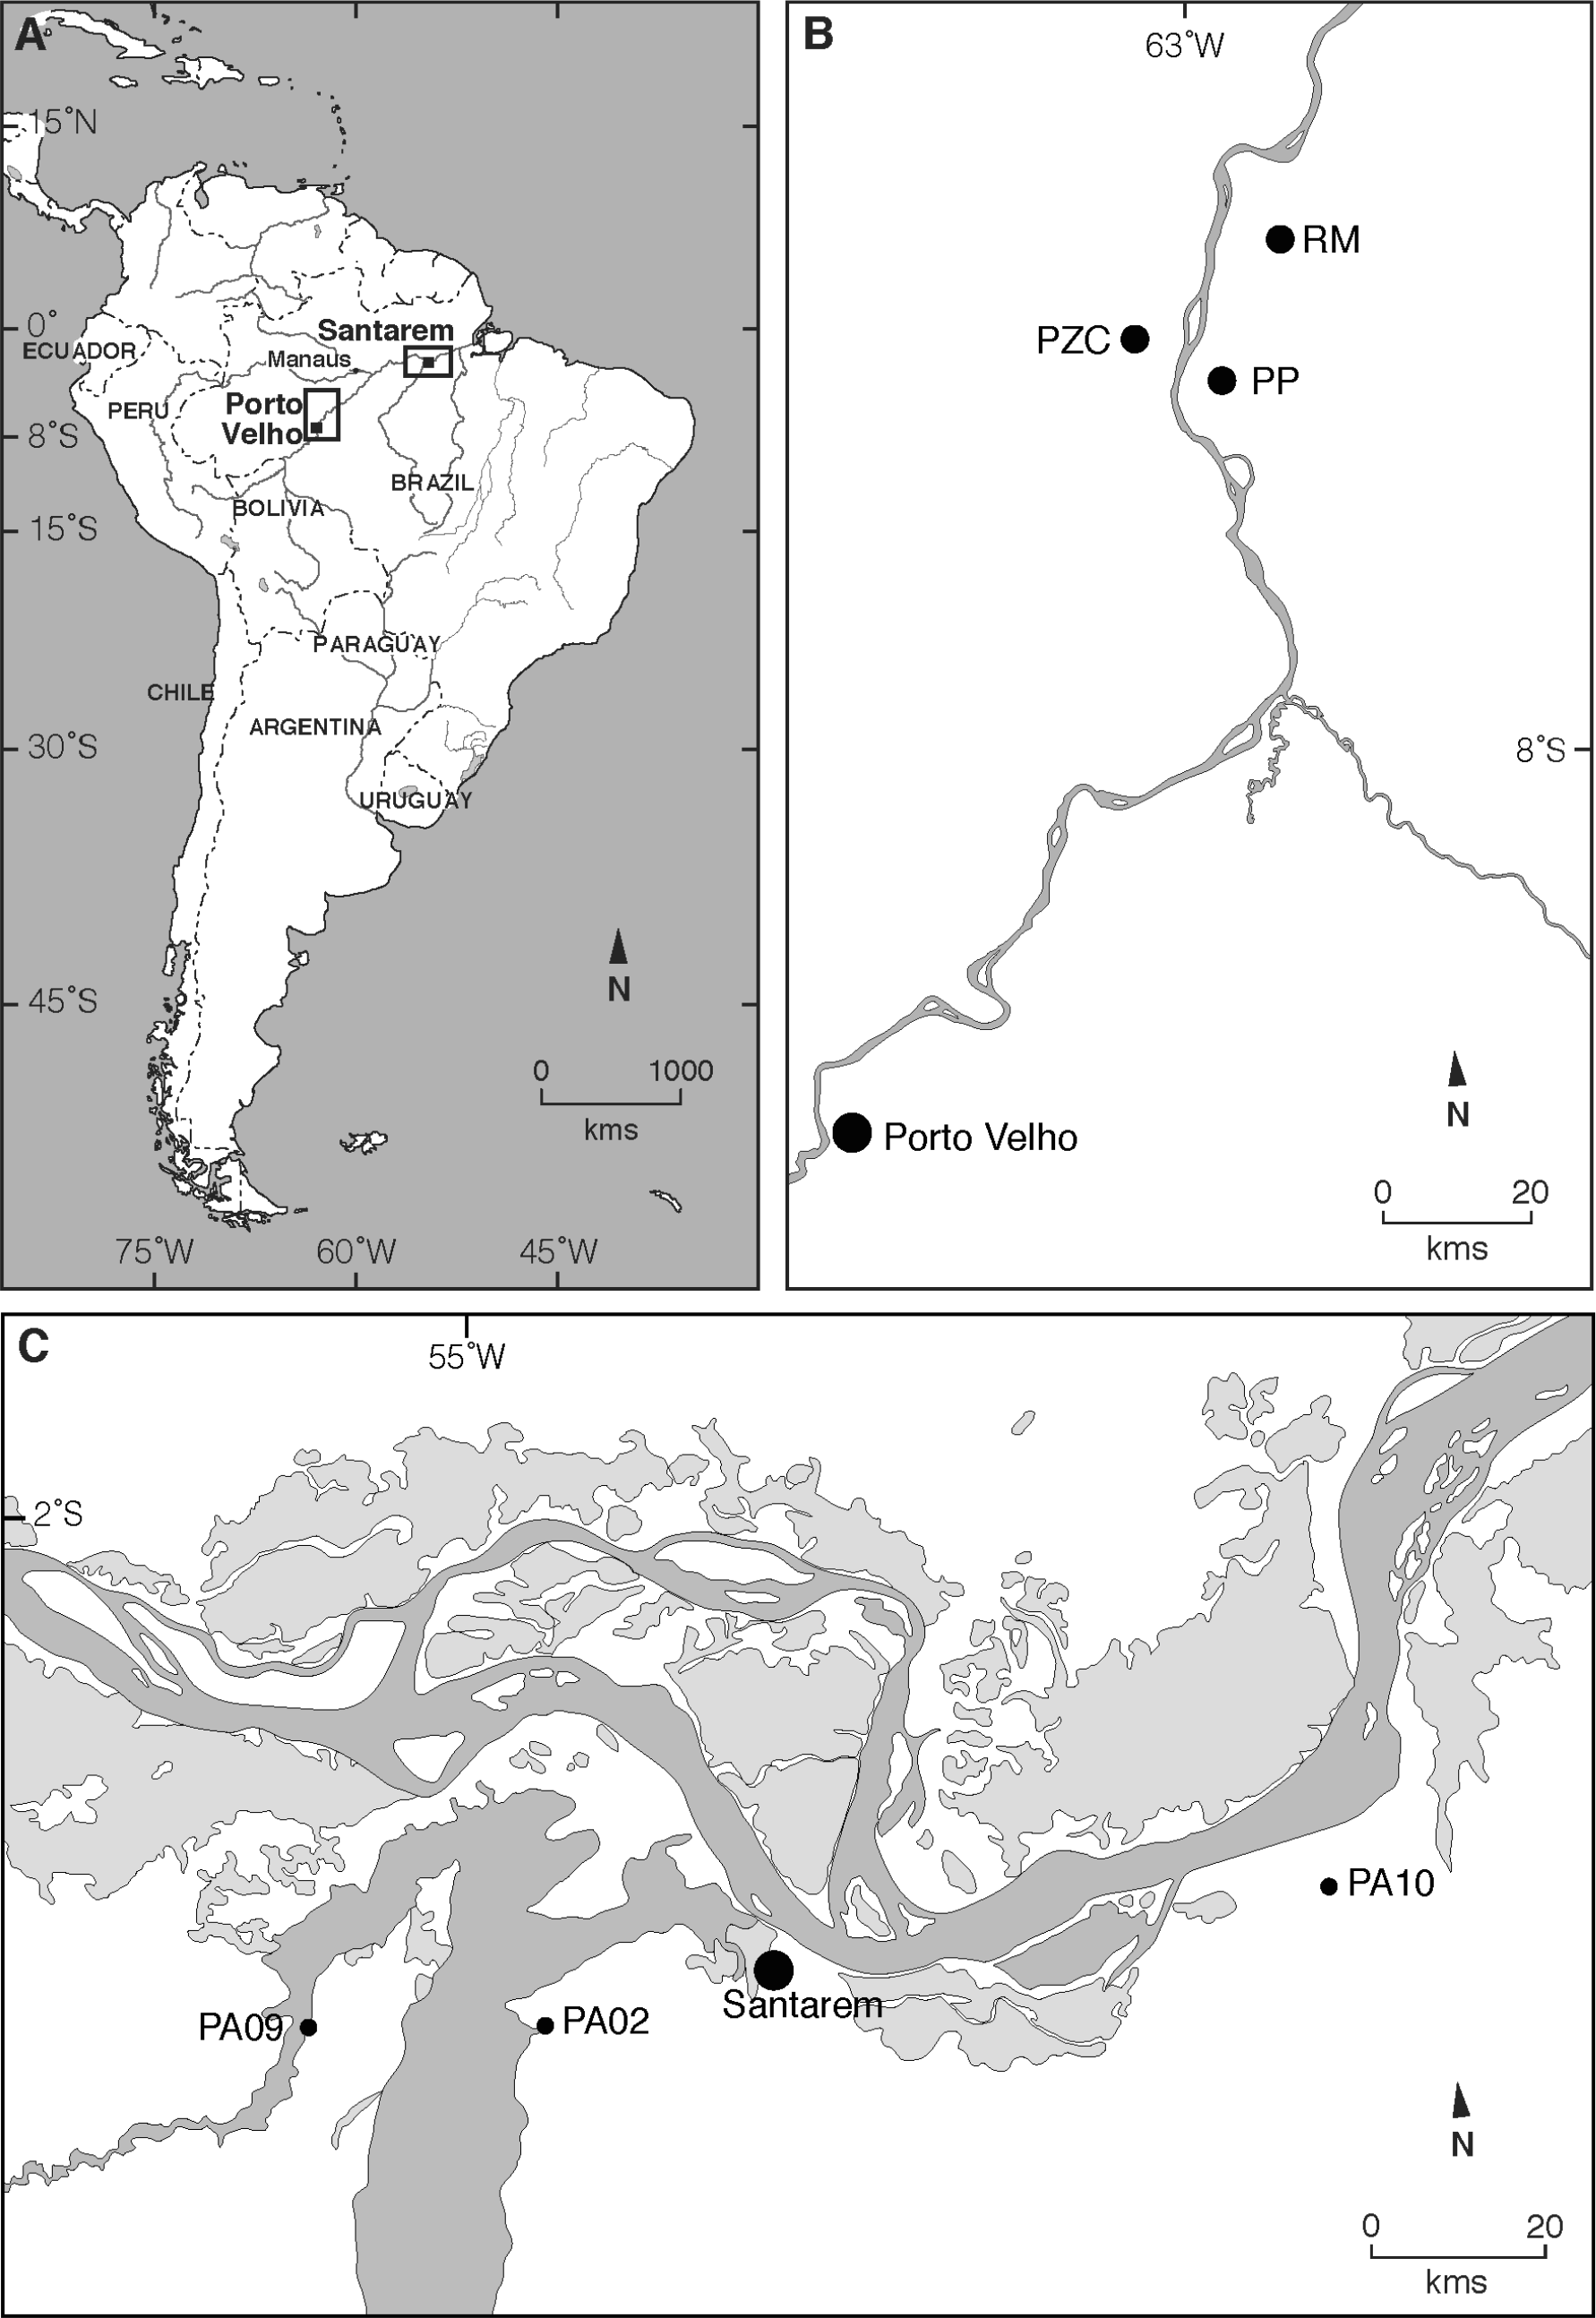
Six sediment cores were collected from Amazon floodplain lakes adjacent to the Amazon and Tapajos Rivers (PA2 and PA9 adjacent the Tapajos River, and PA10 adjacent the Amazon River), and another three PP, RM and PZC, adjacent to the Madeira River near the city of Porto Velho, Brazil (Fig. 1). The sediment cores were collected using percussion and rotation to minimize sediment compression. The sediment cores ranged from 25 to 70 cm length. The sediment cores were sub sampled in 2 cm intervals. Dry bulk density (DBD, g cm-3) was determined as the dry sediment weight (g) divided by the initial volume (cm3).
Figure 1
Study area: A) South America; B) Porto Velho region showing study sites RM, PP, PZC floodplain lakes adjacent to the Madeira River and; C) Santarem region showing study sites PA2 and PA9 floodplain lakes located near the Tapajos River, PA10 sediment core from a floodplain lake directly influenced by the Amazon River.
The laboratory preparation for Pu analysis followed the method of Ketterer et al. (2004a, 2004b) having been scaled to accommodate larger sample masses. Sample aliquots ranging from 10 to 29 grams were dry-washed at 600°C for 16 hours, and leached with 50 mL of 16 M HNO3. The leaching was conducted overnight at 80°C with added 242Pu yield tracer (NIST 4334g, 19 picograms). Acid leaching (as opposed to complete dissolution with HF) is known to solubilize stratospheric fallout Pu, and there is little possibility that refractory HNO3- insoluble Pu exists, at least in the Brazilian coastal plain setting (Sanders et al., 2010).
The leachates were diluted to 100 mL, filtered to remove solids, and the aqueous solutions were processed with TEVA resin (ElChrom, Lisle, Il, USA) in order to chemically isolate 3.0 mL Pu fractions in aqueous ammonium oxalate solution suitable for measurements by sector ICPMS. Pu determinations were performed using a VG Axiom MC operating in the single collector (electron multiplier) mode. The system was used with an APEX HF system (ESI Scientific, Omaha, NE, USA) with an uptake rate of 0.4 mL/minute. Qualitative mass spectral scans (averages of 50 sweeps over the mass range 237.4–242.6) were collected for selected samples prior to the electrostatic sector quantitative scanning of 238U+, 239Pu+, 240Pu+, and 242Pu+. Detection limits were evaluated based upon the analysis of two blanks. A detection limit of 0.01 Bq/kg of 240+239Pu is applicable for samples of nominal 25 gram mass (Ketterer et al., 2004a; Ketterer et al., 2004b; Ketterer and Szechenyi, 2008).
For 210Pb dating the sediment cores were analyzed for radionuclide concentrations in an HPGe gamma well detector (Appleby and Oldfield, 1992). Freeze dried and ground sediments were packed and sealed in gamma tubes. The 210Pb and 226Ra activities were calculated by using a factor that includes the gamma detector efficiency, as previously determined from certified reference material IAEA-300 (Baltic Sea Sediment) and the gamma-ray intensity. The 210Pb and 226Ra activities were measured using the 46.5 KeV and 351.9 KeV gamma peaks, respectively (Sanders et al., 2016). Prior to radionuclide measurements, samples were set aside for at least 3 weeks, to allow for 222Rn ingrowth and to establish secular equilibrium between 226Ra and its granddaughter 214Pb. The excess 210Pb activities (referred to as 210Pbex from here onward) were determined by subtracting the 226Ra concentrations (i.e. supported 210Pb) from the total 210Pb concentrations. The sediment accumulation rates (cm yr-1), taken from the 210Pb constant initial concentration (CIC) dating method, and the dry bulk density (g cm-3) in each interval (cm) were used to determine mass accumulation rates (Appleby and Oldfield, 1992).
. Results
The dry bulk densities (g cm-3) are shown in Table 1. The Pu atomic ratios in the six sediment cores indicate that the Pu is originating from stratospheric fallout (plutonium isotopic ratios 240Pu/239Pu) which ranged from 0.17 to 0.19 in the sediment cores near the Tapajos and Amazon Rivers and 0.16 to 0.20 in the sediment cores near the Madeira River (Table 2). There is no consistent activity pattern down the sediment profiles that resembles the expected atmospheric deposition history. Therefore, it is not possible to assess a 1963 peak deposition date from this profile. However the material below the depth where 240+239Pu first appears was deposited pre-bomb (that is, prior to the early 1950s) (Sanders et al., 2014b; Sanders et al., 2010). From the three sediment cores collected in proximity to the Tapajos and Amazon Rivers (PA2, PA9 and PA10), plutonium was first detected at the 14–16 cm interval for PA2, with the highest concentrations at the 10–12 cm interval of 0.533 ± 0.037. In PA9 plutonium was first detected at the 58–62 cm interval with the highest concentrations at the 42–46 cm interval of 0.0925 ± 0.022 Bq/kg 240+239Pu (Fig. 2). In core PA10, plutonium is first detected in the 14-16 cm interval, and has a maximum concentration of 0.717 ± 0.005 Bq/kg 240 + 239Pu at the 16–18 cm interval. In the three sediment cores near the Madeira River (PP, PZC and RM), plutonium is first detected at the 20–22 cm interval for PP with the highest concentration of 0.129 ± 0.010 Bq/kg 240+239Pu at 12–14 cm interval. In PZC plutonium was first detected at 26–28 cm interval with the highest concentration at the 12–14 cm internal of 0.127 ± 0.011 Bq/kg 239+240Pu. In core RM plutonium is first detected in the 38–40 cm interval and has a maximum concentration of 0.098 ± 0.013 Bq/kg 240+239Pu (Fig. 2). A grand average for 240Pu/239Pu atomic ratios were 0.187 ± 0.019, as determined from the collective core intervals and propagating the standard deviations from each sediment core.
Table 1
Depth profiles of dry bulk density (DBD) (g cm-3) and mass accumulation rates (MAR) (g cm-2year-1) of the six sediment cores (PA2, PA9, PA10, RM, PP, PZC) studied in this work.
Table 2
Sediment accumulation rates (mm year-1) and inventories (mBq cm-2)based on the 210Pb and 239+240Pu sediment dating methods.
Figure 2
239+240Pu, 210Pb, 226Ra and 210Pbex profiles from the six sediment cores in this work. The first occurrence of 239+240Pu indicates ~1950 when these radionuclides were first introduced into the atmosphere. The ~1950 mark on the 210Pbex profiles are based on the sediment accumulation rates dated through the Constant Initial Concentration (CIC) approach (Appleby and Oldfield, 1992). PP, PZC, RM, PA2, PA9, PA10 - study sites.
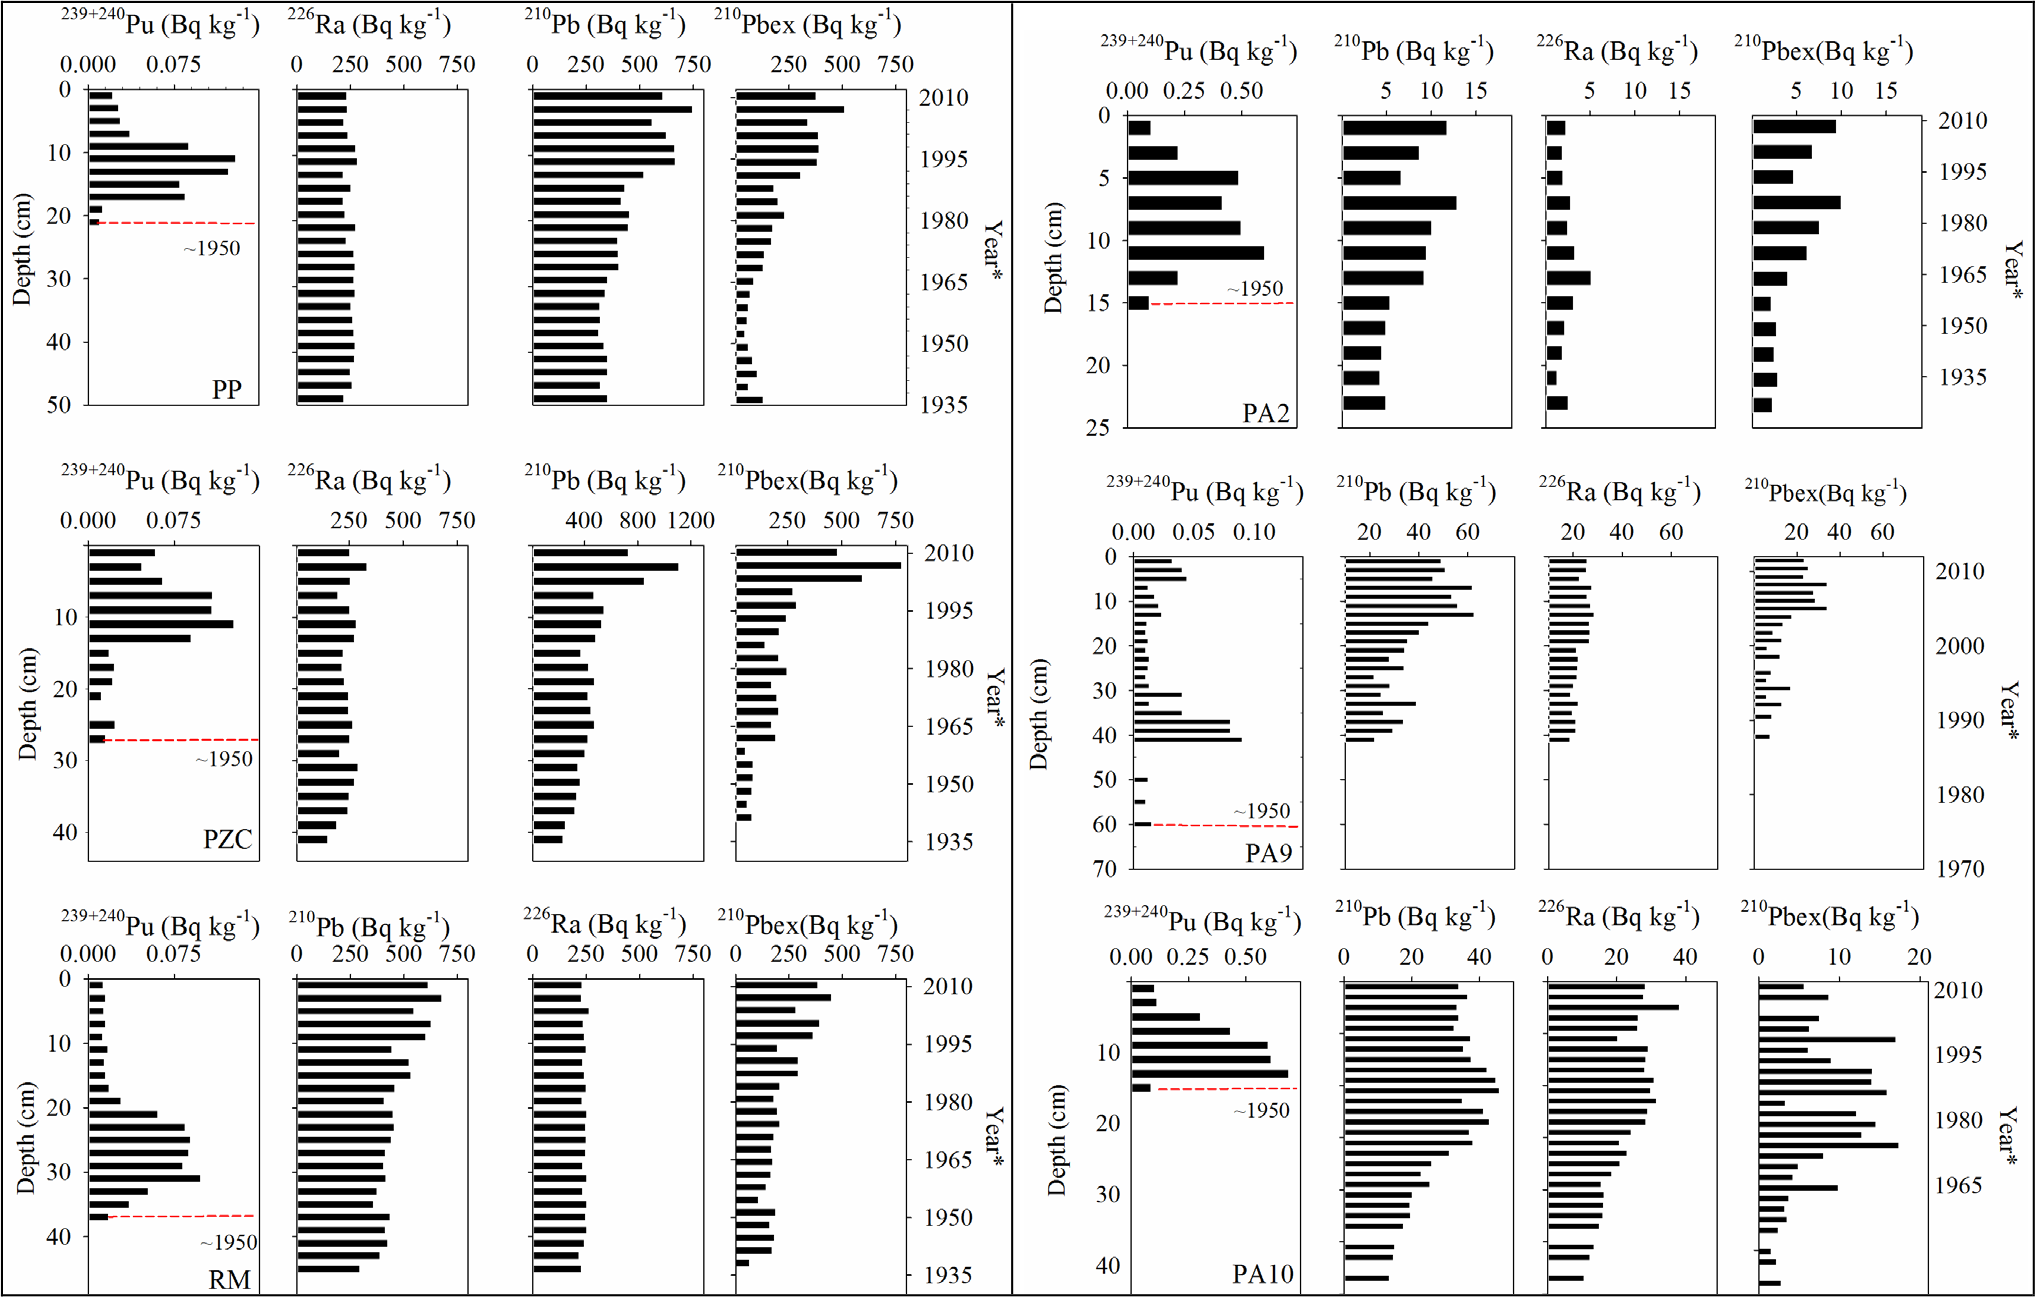
Fig. 2 shows the 210Pb, 226Ra and subsequent 210Pb(ex) sediment core profiles. A general downcore decrease in 210Pb(ex) activity was found in five of the six sediment cores (Fig. 2), with only PA10 showing substantial sediment mixing at the surface intervals. For sediment core PA9, 210Pb analysis was conducted from the surface down to 40–42 cm depth interval. However for the Pu analyses in this same sediment core, samples were combined in 4 cm intervals from the 42–46 until the 68–72 cm depth intervals. No 240+239Pu was found in the 62–66 and 66–70 cm intervals. Therefore the 1950 date was established to be at the 58–62 cm depth interval representing the onset of nuclear bomb testing, as 240+239Pu was only introduced into the atmosphere after the early 1950s.
The 240+239Pu and 210Pb inventories and fluxes shown on Table 2 are based on the entire core. These inventories give an integrated view of the total supply of 240+239Pu and 210Pbex to the water column from multiple sources. The 240+239Pu and 210Pbex input comes from the atmosphere and runoff, which should be included when considering the sources to the sedimentation inventories. The 210Pbex inventories may also include an in situ production source. The mass accumulation rates (g cm-2 year-1), noted on Table 2, were determined by multiplying the sedimentation rates (cm year-1), by the dry bulk densities (g cm-3) for each sediment core interval.
. Discussion
The 240+239Pu results are consistent with the 240Pu/239Pu of 0.180 ± 0.014 discussed by Kelley et al. (1999), indicating that the source is from Cold War era above-ground nuclear tests deposited globally from the early 1950’s to the late 1960’s (Abril, 2003; Alhajji et al., 2014). Furthermore, these values are in good agreement with the reported 240Pu/239Pu in southern Equatorial (0–30°S) fallout reported by Kelley et al. (1999), who determined an average 240Pu/239Pu atomic ratio of 0.173 ± 0.027. The detected plutonium ratio is directly related to anthropogenic introduction to the environment through nuclear bomb testing in the 1950s (Ketterer and Szechenyi, 2008). This affixes an upper limit on the average sedimentation rate of near 2.4 mm year-1 in core PA2, 10.2 mm year-1 in sediment core PA9 and 2.3 mm year-1 in core PA10 for the lakes near the Porto Velho regions and 3.4, 4.2 and 6.2 mm year-1 for the sediment cores PP, PZC and RM, respectively, near the Santarem region (Fig. 1).
The mass accumulation rate results indicate that even though higher plutonium peak concentrations are observed in the PA10 sediment core, the MAR is greater in the PA9 sediment core (Table 1). The lower 240+239Pu mass accumulation rates in the other sediment cores may be due to dilution from a large sediment load or possibly a result of grain size differences, as the waters vary from fine grain sediment-laden Amazon River to the relatively high concentrations of sand in the Tapajós Rivers (Junk et al., 2015).
There appears to be large sediment focusing, a process whereby water turbulence moves sediment from shallower to deeper zones of a lake (Blais and Kalff, 1995), in the floodplain lakes in this work. This is because the initial atmospheric fallout flux of 240+239Pu is fairly well known and much lower than was found in this study (Kelley et al., 1999). 240+239Pu atmospheric fluxes, derived from the sediment inventories, found here are extremely large for the Southern Hemisphere, 4.9, 1.0, 0.5, 2.7, 2.0 and 3.7 mBq cm2 yr-1 in sediment cores PA2, PA9, PA10, PP, PZC and RM respectively. Furthermore, the 240+239Pu fluxes in this work are substantially higher than in coastal sediment cores taken on the southeastern region of Brazil (0.10 mBq cm-2 yr-1) (Sanders et al., 2010) or continental shelf (0.20 to 0.43 mBq cm-2 yr-1) (Sanders et al., 2014a) of South America, supporting the assertion of high fluxes of the particle reactive Pu tracers in specific depositional settings of the Amazon Basin. The expected global fallout atmospheric flux of Pu to the sediments is 0.58 mBq cm-2 yr-1.
The 240+239Pu inventories in this work are substantially greater than the global fallout atmospheric fluxes and greater than most other lakes around the globe. For instance, Lake Bosten, China 0.46 mBq cm-2 yr-1 (Liao et al., 2014) and in Lithuania Lake 1.0 mBq cm-2 yr-1 and 0.05 to 0.32 mBq cm2 yr-1. However the fluxes in this work are lower than what was found in NW Greenland 5.14–31.6 mBq cm-2 yr-1 (Lukšiene et al., 2014; Mietelski et al., 2016b). One of the reasons for the high fluxes found in this work is likely because 240+239Pu deposited on land may also enter water bodies due to soil erosion and run-off processes, which then accumulate in wetland or lake environments. For instance, forest canopies are very efficient in the initial capturing of atmospheric fallout (Iurian et al., 2015; Todorović et al., 2013). Therefore the inventory of anthropogenic radionuclides in sediments reflects the source function and the transport of radionuclides (Pourcelot et al., 2003; Todorović et al., 2013). Indeed, the highest atmospheric 240+239Pu fluxes (PA2), derived from the inventories on Table 2, is an area open to the river floodplain lake, an indication of intense lateral transport of the particle reactive Pu.
The 240+239Pu and 210Pb methods are interpreted as having comparable sediment accretion rates in three sites (PA2, PZC, RM) and substantially different in the other three floodplain lakes (PA9, PA10, PP) (Table 2). The difference in sediment accretion rates between these two dating methods may be attributed to the different time spans these two models represent. For instance, accretion derived from 240+239Pu represent a net accumulation rate relative to a 60-year timeframe whereas net accumulation rates calculated using the CIC approach with 210Pb represents an over 100 year timescale. When comparing net accumulation rates from these two methodologies, we are assuming a consistent deposition regime across these timescales. However this may not be the case along the Amazon Basin as a result of changes in seasonal rain (El Nino) and land use activites (such as deforestion) which will influence the sediment loads that are delivered to the floodplain lakes.
The 210Pbex inventories, shown in Table 2, give an integrated view of the sedimentary dynamics as the 210Pbex inventories vary greatly from one floodplain lake to another. These differences in 210Pbex inventories indicate differing depositional fluxes (Smoak et al., 1996). The 210Pbex flux to the sediments is a function of the total supply from the atmosphere, in situ production, and from creeks and rivers, all of which should be included when considering the sources of the 210Pbex to the sedimentation inventories (Smoak et al., 1996). The relatively large fluxes of 210Pbex greatly exceeds what was measured directly from the atmospheric fallout rates (15.3 mBq cm-2 yr-1) in South-eastern Brazil (Sanders et al., 2011). Hence, the depositional inventory at the sediment coring locations in this work is far greater than the inventory of the directly deposited atmospheric flux in South-eastern Brazil. These high inventories are also noted from the 240+239Pu profiles. This is because the initial atmospheric fallout of 240+239Pu is fairly well known and lower than what was found in this study (Kelley et al., 1999). Indeed, 240+239Pu fluxes found here are extremely large for the Southern Hemisphere, which are reported to range from 0.20 to 0.43 mBq cm-2 yr-1 (Kelley et al., 1999; Sanders et al., 2010). Because the 240+239Pu fluxes follow the same high inventories as 210Pbex, the sedimentary profiles in this work support the assertion that sediment focussing is contributing to the relatively high fluxes of the particle reactive tracers in the depositional settings of the Amazon floodplains.
. Conclusion
The 240+239Pu and 210Pb sediment dates in this work indicate that the Amazon floodplain lakes accumulate sediment at rates between 2.4 and 18.6 mm year-1 during the previous century. However the derived 240+239Pu and 210Pb sedimentation models produced substantially different sediment accretion rates in three of the six sites. These differences are attributed to the different time spans these independent models represent and/or the solubility of Pb and Pu along the sediment column. From the two independent dating methods used in this work which are based on different time scales, we conclude sedimentation rates have remained relatively stable near the Madera River and the 240+239Pu and 210Pb inventories indicate that there is greater sediment focusing at the Madeiras River floodplain lakes, as compared to the Tapajos and Amazon River floodplain lakes, during the previous century. Furthermore, this work shows that the detection of a recognizable 240+239Pu in sediment profiles of the Amazon floodplain lakes is promising in terms of future uses as a geochronometric tool in the this region. The geochronologies derived from the 240+239Pu and 210Pb dating methods outlined in this work are of an ideal timeframe for studying the effects of anthropogenic influences along the Amazon Basin during the 20th century.