. INTRODUCTION
Quartz (SiO2) is a natural dosimeter used in retrospective dosimetry, for archaeological and geological dating. The luminescence properties of natural quartz depend on the point defects contained within the crystal, which may reflect specific conditions during silica formation and its post-growth treatments. The detailed thermoluminescence (TL) emission spectra of a wide variety of quartz material were reported by Rink et al. (1993) who concluded that the colour of the TL emission is indicative of the provenance, growth method and thermal history of the material. For example, they observed that granitic quartz could have various emissions at 360–380 nm, 420–470 nm and at 630 nm. A broad TL emission band centred at 560–580 nm was observed only in natural quartz of hydrothermal origin and material of volcanic origin is usually dominated by red emission. Generally three TL emission bands: UV violet (360–440 nm), blue (around 450 nm) and red (650 nm) have been observed in the TL emission spectra of natural quartz (Krbetscheck et al., 1997) resulting in TL peaks, namely at 110, 220 and 325°C; the 325°C peak is used in TL dosimetry and dating.
While a wide range of emission wavelengths are available for analysis in TL dosimetry, the choice of optically stimulated luminescence (OSL) methods is limited due to the need to use excitation wavelengths in the blue/green spectral range. Most commonly, the OSL signal is observed using optical filters that pass wave-lengths centred on 340 nm during optical stimulation at 470 nm (Bøtter-Jensen et al., 2010); (Wintle and Adamiec, 2017). This is advantageous since using optical excitation at 647 nm, (Huntley et al., 1991) found the OSL emission of natural quartz to be centred at ∼365 nm, with only weak emission between 400 and 500 nm.
However, the luminescence detected in this region shows unusual characteristics, especially after high-temperature annealing (0–1200°C), whereby particular enhancement in the luminescence sensitivity occurs between the phase transition temperatures 573 and 870°C (Bøtter-Jensen et al., 1995). In a more detailed study, Poolton et al. (2000) attempted to correlate such OSL behaviour of material that had undergone successive annealing treatments, with changes in the defect structures and populations, as monitored by EPR. They tentatively concluded that oxygen vacancy (E′) centres act as non-radiative recombination centres, competing with the trap responsible for the UV emission: such E′ centres are annealed out of the samples at temperatures in the range 500–700°C, explaining the OSL sensitivity increase. The UV emission is attributed to the [AlO4]0 centres (Martini et al., 1995); and thermal treatment has already been reported to strongly enhance the UV emission (Martini et al., 2012). Studies on well-defined relationships between the mentioned luminescence emissions and specific defects in quartz are still ongoing.
In this study, luminescence properties of heated quartz from the archaeological site at Karakorum (Mongolia) will be investigated in terms of their thermoluminescence spectra. Previously, bricks from historical buildings in Mongolia were studied by optically stimulated luminescence (Solongo et al., 2006a, 2006b, 2006c) in order to extract information about the chronology of the brick production at the Karakorum. The known historical facts about the chronology of some parts of the historical buildings in the Karakorum allowed testing the OSL to architectural ceramics, thus ensuring an age underestimation previously obtained for some bricks. The bricks were produced in the “Mantou” type kilns under oxidising/reducing atmosphere and were subjected to different thermal treatment performed during brick production in the past. By the results presented in this article, we want to examine how these thermal treatments affect the thermoluminescence spectra of quartz and the dose evaluation using various SAR protocols.
. EXPERIMENTAL
Site and samples
The brick samples used in this study were collected at the archaeological site Karakorum (47°12′N/102°50′E; 1461–1462 m a.s.l.) located in Orkhon Valley, Mongolia. This site assumed major importance as the medieval capital of the Great Mongolian Empire and as one of the most important cities in the history of the Silk Road. Karakorum (Qara Qorum) founded in 1220 became a walled urban settlement under Chinggis Khaan's son Ögedei Khan in 1235. “The palace district” was first identified in 1948–1949 by a Russian-Mongolian archaeological team led by Sergei V. Kiselev (Kiselev et al., 1965). The Mongolian-German Karakorum Expedition (MDKE) conducted by the German Archaeological Institute (DAI) and the Mongolian Academy of Sciences (MAS) in the old Mongolian capital has radically revised the conventional image of Karakorum (Hüttel and Erdenebat, 2011). According to the inscriptions, the Wanan palace of Ögodei Khan and some temples built at the same time, among them a monumental Buddhist stupa temple, the “pavilion/temple of the origin of the Yüan”, are held as the oldest buildings of the city. They were built in 1235 at the same time as the city walls. While the palace was completed within a year in the early part of 1236, the great Buddhist stupa temple was only finalised in 1256. It is known that the first restoration of the temple took place in 1311, and the second one between 1342 and 1346 (Hüttel and Erdenebat, 2011).
About fourteen “Mantou” type kilns with round walled fire pits and fire canals were discovered, nine of which were almost entirely intact (Hüttel and Erdenebat, 2011); it is evident that that numerous architectural ceramics, including roof tiles, bricks and Buddhist figurines come from these factories. These bricks were initially classified based on their colour, which is indicative of the provenance, use of oxidising and reducing atmosphere and thermal history of the material. In most kilns, carbon monoxide serves as the primary reducing agent, but in some traditions, hydrogen (a potent reducing gas) may have been generated towards the end of the firing through the introduction of water to the firebox or the kiln-chamber (Rose Kerr, 2004). Red coloured bricks were produced in an oxidising atmosphere, while grey coloured bricks were produced using conventional “air-starved fuel” reduction or the generation of water gas. Firing temperatures in the “Mantou” type kilns ranged in the interval 800–1000°C (Rose Kerr, 2004).
The bricks from the Karakorum were previously subjected to CW-OSL measurements; quartz from grey coloured bricks, however, gave significant dose/age underestimations (Solongo et al., 2006a). The main reason for this was that the ratio of fast to medium components was too low and De's with the highest fast to medium ratio were considered; in addition, we performed post-IR-OSL (Banerjee et al., 2001), leading to better dose estimates. That led to the conclusion that only red coloured bricks were suitable for blue-stimulated CW-OSL measurements.
Sample preparation and measuring equipment
The environmental radiation dose rates were measured using high-resolution γ-spectrometry applied to the external layer of the sample to determine K, U and Th concentrations. In-situ water content measured shortly after sampling was taken into account. The contribution from cosmic radiation to the dose rate was calculated following Prescott and Hutton (1994), assuming an uncertainty of 5%. The radionuclide concentrations were converted to dose rate data using the conversion factors from Guerin et al. (2011). Table 1 summarises the sample description and dose rate data.
Table 1
Fragments of bricks for luminescence dating and concentration of radionuclides measured by high-resolution gamma-spectrometry.
For luminescence procedures, the external layer of the ceramic fragments was removed; the obtained cores were carefully crushed and sieved. All crushed material was subjected to 15% H2O2, 30% H2O2 to remove organic material, to 10% HCl to dissolve carbonate minerals, prior to density separation using a heavy liquid and separated by 2.62 g cm−3 and 2.74 g cm−3 to obtain quartz fractions. For quartz, grains were etched with 40% hydrofluoric acid (HF) for 40 min. to remove the alpha irradiated outer rinds and HCl to eliminate the possible formation of fluorosilicates. For OSL and TL measurements 90–120 μm coarse grains were deposited onto disc using 1 mm and 2 mm spot, while for TL spectra measurements 8 mm aliquots were used.
Spectral measurements were carried out in MPI Heidelberg using the TL/OSL-Spectrometer described by Rieser et al. (1999). Here a Czerny-Turner flat field spectrograph was equipped with a grating of 150 lines mm−1 for the measurements, with the entrance slit of spectrograph being set to 0.5 mm. The detector used was a liquid nitrogen cooled CCD array (Princeton Instruments), which had a size 1100×330 pixel. In order to cut the intense red/IR thermal emission at higher temperatures, the heat-absorbing filters were used.
All OSL measurements were performed using an automated Risø TL/OSL-DA-15 reader, equipped with blue light-emitting diodes (470±30 nm, 50mW cm−2) for stimulating the quartz, a Thorn-EMI 9235 photomultiplier combined with three 2.5 mm U-340 Hoya filters (290–370 nm) for OSL signal detection. Laboratory irradiation was undertaken using a calibrated 90Sr/90Y beta source delivering (2.72±0.2 Gy/min) to coarse grain aliquot. LM-OSL measurements were carried out by continuously ramping the power from zero to maximum (90% of power), over a period of typically 3000 s. For TL measurements, the TL glow curves (180 – 460°C; 5°C/s) were recorded using “D410 transmission filter” (410±30 nm) for TL signal detection. The dose De was determined using SAR (Table 2) procedure (Murray and Wintle, 2003), which employed CW-OSL, LM-OSL and TL measurements.
Table 2
SAR procedure using CW-OSL, LM-OSL, TL used in this study.
. RESULTS AND DISCUSSION
Quartz TL emission spectra
For the measurement of TL emission spectra samples were irradiated artificially with 50 Gy using a 90Sr β-source and stored for four weeks at room temperature. Because luminescence of natural quartz is usually weak, some samples were irradiated with 100 Gy. The measurements were performed using a heating rate of 5°C/s, a spectral range of 300–1200 nm, and a temperature range of 20–500°C.
Fig. 1a, 1b show the representative TL contour plot obtained for the natural laboratory irradiated quartz samples HD3 (red brick) and HD2-57 (grey brick). Over the entire investigated temperature range, the spectrum of the detected glow peaks is dominated by a blue emission. Two TL peaks are clearly detected around 225°C and 350°C, respectively.
Fig. 1
TL contour map recorded after laboratory β-irradiation and storage for 4 weeks. (a) heated quartz samples HD3 (red coloured brick), and (b)HD2-57 (grey coloured brick).
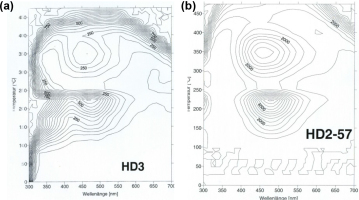
Fig. 2a, 2b shows TL emission spectra plotted vs the wavelength. For quartz HD3, the emission band peak had maxima at ∼360, and 440 nm, in agreement with the wavelength peaks presented in summary by (Krbetscheck et al., 1997). For this sample, for the temperature range of 75 to 175°C, both the UV emission band peaking at ∼366 nm and the blue emission band peaking at 440–460 nm (∼2.8 eV) increased in intensity. The UV emission band is still observed in the range 200–275°C, but disappears at 300°C. In contrast, the blue emission at 470 nm (2.6–2.5 eV) emission increases for 200–275°C.
Fig. 2
TL emission spectra for heated quartz (a, c) HD3 and (b, d) HD2-57. Deconvolution into Gaussian components of the thermoluminescence emission spectra of HD3 showed a broad UV emission band peaking at 366 nm, and the blue emission band peaking at 474 nm. HD2-57 showed typical for quartz blue emission bands peaking at 470 nm for a temperature 200–350°C, and 490 nm emission at 125–175°C. There is peak with low intensity at 600 nm. The UV emission band is absent in TL spectra of HD2-57.
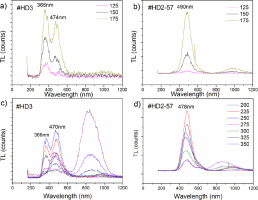
In contrast, for quartz HD2-57 the UV emission band is missing. The emission had maxima at ∼478 nm and a low-intensity orange-red band at ∼600 nm. We observed an increase in the intensity of blue emission bands over a temperature range of 125 to 175°C, but this tends to decrease with the further rise in temperature from 225 to 350°C. The intense high-temperature peak at around ∼800 nm observed in both samples may be inherited from the thermal history.
The comparison of the TL emission results is a strong indication that annealing in the past has taken place at different temperatures. Similar treatments have been already described in the literature. Previously, (Bøtter-Jensen et al., 1995) showed that a high-temperature annealing prior irradiation could significantly increase the luminescence sensitivity, typically by three orders. Poolton et al. (2000) explained the OSL sensitivity increase and concluded that E′ centres are annealed out of the samples at temperatures in the range 500–700°C.
Radio-luminescence and thermoluminescence spectra were used by Schilles et al. (2001) as a means of investigating the luminescence sensitivity changes if quartz was heated beyond the first and second crystal phase transitions, in the temperature range 573 and 1050°C. The results lead them to conclude that luminescence is generally sensitised in quartz by removal of oxygen vacancy E’ centres, which act either as non-radiative recombination centres or as luminescence centres emitting in the deep UV-region. They concluded that after annealing material beyond the first phase transition, the UV (360 nm) emission became enhanced in their samples.
Martini et al. (2009) reported that samples annealed at around 500°C showed dramatic enhancement of the 3.4 eV (360 nm) band followed by a decrease. This is consistent with our observation for quartz HD3 which exhibits similar TL spectra suggesting that quartz experienced in the past the annealing around the first transition phase. Deconvolution into Gaussian components of the thermoluminescence emission spectra of HD3 indicates the presence of 363nm band.
Further, Martini et al. (2012) showed that “hydrogen-swept” quartz has no UV emission. Hydrogen is important due to the supposed participation in various generation processes of defects, both intrinsic and extrinsic, and to the high mobility. Hashimoto et al. (2001) reported that the atomic hydrogen derived from the radiolysis of OH-related impurities could operate as a “killer” of radiation-induced Al-centers.
The study of the relationship between the luminescence emissions and specific defects in quartz is beyond the scope of this study. However, it can be inferred that the technological parameters of manufacturing grey coloured bricks, including high-temperature annealing and cooling using hydrogen reduction, could have affected luminescence properties such as the decrease in the UV emission band.
In the following sections, we addressed the question of whether the TL spectra affect luminescence properties and the dose assessment using different SAR measurements.
OSL characteristics of quartz
In OSL dating protocols, OSL signal is usually obtained under during optical stimulation at steady stimulation power, resulting in a continuous wave OSL (CW-OSL) signal. It is well-known that the decay of signal during the OSL measurement of quartz does not form the simple exponential, it is composed of components generally referred to as fast, medium and slow, each of which has different optical and thermal luminescence properties, indicating the existence of three optically active traps according to Bailey et al. (1997).
Alternatively, the OSL signal measured using a linearly increasing stimulation power to obtain the linearly modulated OSL (LM-OSL, (Bulur, 1996)) signal tends to separate the individual OSL components involved in the OSL production, and it was initially used as an analytical tool (Bulur et al., 2000, 2002) for discriminating the different OSL components (Jain et al., 2003), (Singarayer and Bailey, 2003).
Representative blue-stimulated CW-OSL decay curves of heated quartz are shown in Fig. 3. Note that HD3 was stimulated for 20 s after preheating at 220°C, HD2-57 for 100 s after preheating at 260°C. The test dose CW-OSL signal was fitted to a sum of first-order exponential components, and the fitting procedure revealed that the OSL signal of HD3 comprised the dominant fast component. The contribution of fast, medium and slow components are shown in the inset. In contrast, HD2-57 does not have a fast OSL component, but medium and slow components.
Fig. 3
(a, b) Fitting of CW-OSL decay curves and (c, d) pseudo-LM-OSL decay curves for quartz HD3 and HD2-57. The insets show the relative contribution of fast and medium components. (e) Deconvolution of experimental LM-OSL curves HD3 and K02-08.
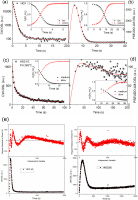
A simple mathematical transformation to convert the CW-OSL decay curves to the LM-OSL curves was performed according to Bulur (2000), and pseudo-LM-OSL curves constructed are shown in Fig. 3b, 3d for quartz HD3 and HD2-57, correspondingly. The inset shows the relative contribution of fast, medium and slow components derived from the pseudo-LM-OSL.
The fitting of multi-exponential functions to the CW-OSL decay curves from HD3 revealed the presence of fast, medium and slow OSL components correspondingly. The corresponding photoionisation cross-sections values were 2.47 ± 0.33 × 10⁻¹⁷ cm2 (fast), 5.05 ± 1.44 × 10⁻¹⁸ cm2 (medium), which are in agreement with the values of 2.32 ± 0.16 × 10⁻¹⁷ cm2 and 5.59 ± 0.44 × 10⁻¹⁸ cm2 (Jain et al., 2003).
The fitting procedure revealed that the LM-OSL signal of HD3 (Fig. 3e) is dominated by fast, and LM-OSL of K02/02 is not dominated by fast OSL component, but by the medium and slower components, these results are consistent with the CW-OSL results. The corresponding photoionisation cross sections for fast, medium and slow components were 2.15×10⁻¹⁷, 3.14×10⁻¹⁸, 4.64×10⁻¹⁹ (cm2), respectively, giving rise to b values of 1.59, 0.52 and 0.04 (s−1), which is in agreement with (Choi et al., 2006).
Application of SAR
CW-OSL
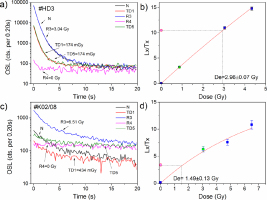
The single-aliquot regenerative dose protocol based on the measurement of optically stimulated luminescence from heated ceramics has been successfully used in retrospective dosimetry (Bøtter-Jensen et al., 2000) and for dating of heated ceramics in archaeology and art history (Bailiff, 2007; Chruścińska et al., 2014; Solongo et al., 2014; Solongo et al., 2006a). Here we present SAR measurements using CW-OSL (Table 2) performed on HD3 and K02/08. Figs. 4a, 4b show the representative natural, regenerated and test dose CW-OSL decay curves recorded during the SAR cycles, respectively. The signal is derived from the initial three channels of the CW-OSL minus background.
Fig. 4
(a), (c) The representative natural, regenerated and test dose CW-OSL decay curves recorded during the SAR cycles for quartz HD3 and K02/08, respectively, N-natural OSL, R3, R4 - regenerated OSL, TD1, TD5 – test dose OSL. (b), (d) The corresponding dose-response curve fitted by exponential fit.
There are several main features in the CW-OSL signals recorded during SAR:
1) OSL signals of HD3 are bright. Test dose-response of HD3 to a test dose TD=2 s (or 174 mGy) is ∼8,000 cts in the initial 0.2 s of stimulation; recycling ratio (R5/R1) is 1.0. The recuperated signal (R4) implicated by the ratio of the sensitivity-corrected 0 Gy value to the sensitivity-corrected natural signal is small (∼ 100 counts, R4/N is 0.1). The OSL signal is dominated by the fast component (Fig. 3), and the ratio of fast to medium was 12. The corresponding dose-response curves were fitted by exponential, from which the equivalent dose of 2.96±0.07 Gy was derived for HD3.
2) OSL signals of K02/08 are very dim. Test dose-response of K02/08 to a test dose TD=4 s (or 344 mGy) is ∼150 cts. per 0.2 s; recycling <10%. The recuperated signal R4 is ∼100 cts., that makes 4.5% of natural OSL. The OSL signal, fitted by a sum of two exponentials, the fast ratio is only 0.6 and the equivalent dose of 1.49±0.13 Gy for K02/08 was derived.
For that sample K02/08, additionally, a preheat temperature plateau test was conducted, this is done order to select appropriate preheat conditions that minimise thermal transfer for De determination using the SAR protocol. Preheat temperatures from 200°C to 280°C with an interval of 20°C were tested, with the cut-heat kept at 200 to 220°C for 10 s, using the heating rate of 5°C/s. Three aliquots were used for each temperature point, and the corresponding dose-response plots of the three aliquots for each preheat are shown in Fig. 5. A plateau was observed for temperatures from 200°C to 240°C, which is recommended to select for routine De determination.
Fig. 5
Preheat plateau test K02/08. a) dose-response curves obtained for preheat temperatures from 200°C to 280°C and the corresponding pre-heat plot De=f(T). b) TL glow curves obtained at the end of SAR protocol after giving a dose of 1.1 Gy. Inset shows sensitivity changes occurring during SAR.
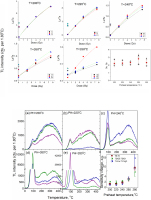
To see how the preheat temperature affects the TL glow curve, we performed an additional sequence at the end of SAR: give a dose of 1.1 Gy and measure TL without preheating. Fig. 5b shows these TL glow curves registered at the end of the SAR cycle. Interesting here is the relationship between the OSL and TL measurements. At higher preheats, the OSL intensity increases and the slope of growth curves (Lx/Tx) become flatter as the test dose (Tx) OSL increases; this sensitivity increase of TL 110°C signal in the TL glow curves may be the indicator of such increase. The De's obtained for the preheat temperature of 260°C are higher. However, sensitivity changes that occur during the SAR cycles starting at 240°C preheat become too high (> 2).
LM-OSL
The first successful attempt with LM-OSL using SAR protocol was made (Li and Li, 2006) and Choi et al. (2006) on coarse-grain quartz extracted from sediments. However, it has not been widely adopted because of the greater time required to make the LM-OSL measurements and the extra time needed for analysis compared with using CW-OSL (Wintle and Adamiec, 2017).
We adopted LM-OSL using SAR protocol (Table 2), which includes an additional step 7, namely, repeated readings of LM-OSL at 125°C, with no heating between the measurements; this was done to ensure that the hard-to-bleach component was optically bleached (Bulur et al., 2002). Examples of LM-OSL glow curves for brick samples HD3 and K02/02 are shown in Fig. 6. LM-OSL peak has two important parameters, the peak height, Lmax, and the peak position on the time scale tmax.
Fig. 6
LM-OSL measurements on HD3 and K02-02 using SAR. (a, e) The natural (N) and regenerated (Reg) LM-OSL curves; (b, f) test dose LM-OSL; (c) LM-OSL dose-response curve derived by integrating fast (0–200 s) and slow (last 100 s) for HD3 and by integrating medium (0–100 s) and slow (last 100 s) for K02-02; (d) The sensitivity changes occurring during SAR cycles. Test dose TD – signal (0–200 s), Reg and TD signals of slow components derived as integer of last 100 s.
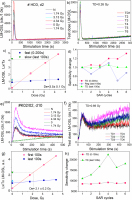
For HD3, LM-OSL measurement time was 3000 s; the natural and regenerated LM-OSL signals recorded during SAR and test dose-response to a test dose TD=3 s (or 260 mGy) are shown in Fig. 6b. The fitting procedure showed that the OSL signal is dominated by the fast component. The equivalent dose will be estimated using dose-response, integrating the fast component (0–200 s) and the slow component (last 100 s), from which a dose of 3.5±0.1 Gy was derived. This is in agreement with those obtained using the initial part of the CW-OSL decay curve. The sensitivity changes of fast (0–200 s) and slow (last 100 s) components during the SAR cycles are shown in Fig. 6d.
For quartz K02-02, LM-OSL measurements were conducted for t=500 s. Figs. 6e, 6f show the natural, regenerated and test dose curves. The dose-response plot was constructed using the integrating 0–100 s, from which a dose of 2.1 ± 0.2 Gy was derived, which was probably based not on the fast OSL component. It is observed that the OSL signal derived from the last 100 s of measurement of the test dose, possibly due to the hard-to-bleach slower components, increases with each SAR cycle (see Fig. 6h). This observation is consistent with results published elsewhere that in some samples sensitisation of slow components with heating can occur at a much higher rate than of the fast/medium components.
The fitting LM-OSL curve with a sum of relevant components is difficult and time-consuming; therefore, instead of applying curve fitting, the equivalent dose may be determined using a dose-response from integrating 0–100 s signal. Furthermore, the equivalent dose obtained was in agreement with those obtained using the initial part of the CW-OSL.
TL-SAR
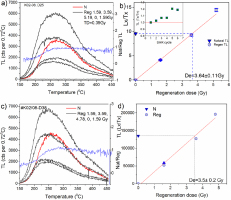
TL dating is usually used to the dating of bricks (Bailiff and Holland, 2000; Blain et al., 2007; Chruścińska et al., 2008, 2014; Guibert et al., 2009; Martini and Sibilia, 2001; Solongo et al., 2014). Two methods were used to determine De – TL measurements using SAR (Table 2) and the TL-REG (regenerative measurements involved the same sequence as TL-SAR but without test dose) method. Preheat at 180°C was used, and the TL glow curves (180–495°C; 5°C/s) were registered. The ratio of natural TL to laboratory regenerated TL signal (NatTL/RegTL) versus temperature was plotted for each aliquot; the integration range was 325–370°C (or 300–350°C). Examples of TL glow curves for brick samples K02/08 K02/36 are shown in Fig. 7. Inset in Fig. 7b shows the sensitivity changes during the SAR cycles. There is no difference between the TL-SAR and TL-REG for these samples; SAR TL De is 3.81±0.33 (n=10) and using TL-REG De of 3.5±0.20 Gy.
Fig. 7
a) SAR-TL und c) regenerated TL measurements on heated quartz K02/08. TL signal was derived by integrating 325–370°C and 300–350°C, correspondingly. (b, c) corresponding dose-response curves. Inset in b) shows sensitivity changes during SAR. SAR TL De is 3.81±0.33 Gy (n=10). Regenerated TL gives De of 3.5±0.20 Gy.
Luminescence ages
The overall goal of this study was to evaluate the potential of luminescence dating as a tool for building archaeology. The results obtained by OSL and TL for all samples under study are summarised in Table 3. As can be seen from Table there is an agreement between the OSL and TL data for red-coloured brick samples originated from the Great hall basement (#K02/01, HD12B, Hd3 and HD3-1); furthermore, all results are consistent with the age control in the form of the Karakorum inscription 1346. Brick sample (B288B) is an only redcoloured sample that yields date of 1370±55 AD, depicting the basement in the manufacturing district, all other bricks were grey coloured.
Table 3
Age estimates and dose De obtained using different luminescence methods (n number of aliquots, all doses are obtained for coarse quartz). * CW-OSL dates were taken from Solongo et al. (2006a).
On the contrary, the De results obtained by TL SAR protocol for grey coloured samples (K02-08, K02-02, K02-36) are higher than those obtained by OSL. For sample K02-02 and K02-08, which are taken from the basement of historical buildings such as Buddhist stupa and lotus, the TL dates correlate with the time of constructing the Buddhist stupa that is known from historical documentary records.
. CONCLUSIONS
In this study, we presented results of CW-OSL, LM-OSL and TL using SAR protocols on heated quartz from the archaeological and historical site in the Karakorum (1220/1235-1260/1370-1388) – the ancient capital of Mongolia, to test their convergence with the age control in the form of the Karakorum inscription 1346. The old Mongolian capital of Karakorum was moreover a centre of great importance for manufacturing, which has been documented by the kilns, that show that not only bricks and roof tiles were fabricated on-site but also building decorations, clay sculptures and the thousands of Tsa-tsa were deposited in the hall. A series of bricks were selected based on the need for chronological evaluation of the Great Hall building.
The TL spectra conducted on quartz from red and grey coloured bricks appeared to be characteristic of the technological origin. Quartz TL from red bricks showed a UV emission band at ∼360 nm and a strong fast OSL component dominated signal. In contrast, blue emission detected in the TL spectra of grey coloured bricks, resulting possibly in the medium component dominated OSL signal. Quartz TL from red bricks showed intense UV emission band at ∼360 nm; this is consistent with previous findings (Bøtter-Jensen et al., 1995) that annealing at around 500°C showed dramatic enhancement associated with intense OSL emission. Both CW-OSL and LM-OSL signals are dominated by fast component, and the sensitivity changes and recuperation of fast component are negligible. Doses obtained using CW-OSL, LM-OSL and TL protocols on red-coloured bricks gave ages in reasonably good agreement with each other and with the historical age.
On the contrary, it can be inferred that the technological parameters of manufacturing grey coloured bricks, including high-temperature annealing and cooling using hydrogen reduction, could have affected luminescence properties such as the decrease in the UV emission band. Therefore, quartz from grey-colored bricks is assigned to the low intensity OSL signal, dominated by medium OSL component. Both, CW-OSL and LM-OSL measurements using SAR protocols resulted in younger ages, probably from the medium OSL component. However, TL results gave dates from 1180±70 AD to 1360±70 consistent with the historically expected ages.
