
. INTRODUCTION
The invention of ceramic fundamentally changed human survival practice and social behaviour (Wu et al., 2012), and opened a new era of exploitation of natural resources (Jordan and Zvelebil, 2009). Ceramics have been used as daily utensils by humans since the Last Glacial Maximum (Wu et al., 2012), and provide direct evidence of human activity as an artificial tool. Study of human adaptation to extreme environments is important for understanding our cultural and genetic capacity for survival (Rademaker et al., 2014). The high altitude of the Qinghai-Tibetan Plateau (QTP) means it is one of the harshest environments on Earth, with low atmospheric pressure, low oxygen content, low moisture, low temperature and high solar radiation, and it was one of the last regions to be settled by humans (Brantingham and Gao, 2006). The Bronze Age Nuomuhong (NMH) culture was the first to permanent settle above 2500 m, from c. 3600 years BP relied on the development of the agropastoral economy (Chen et al., 2015), and ceramics played an important role in human adaptation to the harsh environment.
The numerous ceramic finds associated with NMH archaeological sites on the QTP have primarily been dated using typological analysis, supported by radiocarbon dating of wood, charcoal and bones from the same cultural layer (Xie, 2002; Zhao and Wu, 1960). However, there are key problems that limit the application of both techniques. Typological analysis is a relative dating method that involves the systematic classification of ceramics based on the similarity of form, style, content and manufacture and its affinity with a specific archaeological period. Typological analysis is relatively intuitional and convenient, with little equipment required, and can be used to estimate the age of ceramic in the field, provided archaeologists have sufficient experience. Some sites lack the representative, well-characterized and relatively complete samples required. Also, similar ceramic types may be present in different cultural periods, so that without independent dating, the wrong period may be assigned. For example, brown sand-tempered ceramics were considered diagnostic of the Bronze Age Kayue culture (3600–2600 cal BP) in the Yushu area of the east-central Tibetan Plateau, however, recent radiocarbon dating of the sites has given much more recent ages of between AD 540 and 1620 (Ren et al., 2018).
In the 1990s, most radiocarbon dating at archaeological sites used conventional liquid scintillation counting on unidentified wood charcoal (IA, CASS 1991; 2003; 2005). Dates obtained from unidentified wood charcoal may not accurately reflect the true age of the human behaviour that produced the charcoal because the wood could have come from long-lived trees or been preserved for a long time in cold or arid conditions (Dong et al., 2014).
Luminescence dating has a great advantage over other methods in that it directly dates the ceramic; the luminescence date indicates the last exposure of a ceramic to temperatures of 300–500°C or higher, usually the firing event, or last time was heated. To date, there has been limited application of luminescence dating to ceramics finds on the QTP. Rhode et al. (2007) and Hou et al. (2015) used thermoluminescence (TL) and optically stimulated luminescence (OSL) to date a small number of early prehistoric pottery pieces near Qinghai Lake, on the northern QTP, but no systematic study has been undertaken. In this study, the quartz and K-feldspar luminescence characteristics of five NMH culture ceramics from a stratigraphic section at Talitaliha site in the Qaidam Basin, on the northeastern QTP, were investigated. Radiocarbon dating on bone and charcoal from the same cultural layer as the ceramics was used to provide independent age control to evaluate the reliability of OSL dating of ceramics. Another six OSL dates were obtained from the sampling sections to constrain the age of NMH activity at Taitaliha.
. STUDY AREA AND SAMPLING SECTION
The Qaidam Basin is a large intermountain basin at an altitude of 2800 m, located in the northeast QTP (Fig. 1). The basin is surrounded by peaks, with the Qilian Mountains to the north and east, the Kunlun Mountains to the south and the Altun Mountains to the west, and the terrain gradually slopes from northwest to southeast. The basin covers an area of 1.2×10⁵ km2, and it drains an area of about 2.5×10⁵ km2. The modern Qaidam Basin is subject to an extremely arid climate with a desert landscape. Precipitation decreases, and evaporation increases, from southeast to northwest, with mean annual precipitation of 26 mm and pan evaporation of 3200 mm (Yu and Lai, 2014). Wind-eroded yardangs and salt lakes are predominant landforms in the west, with aeolian deposition in the east, and the basin is surrounded by alluvial and/or proluvial fans from the high mountains. Oases developed on proluvial fans and loess-paleosol in the eastern part of the basin provide the main habitat for prehistoric people and modern humans. During the Second National Archaeological Survey in China, numerous Bronze Age sites were identified in the Qaidam Basin (Bureau of National Cultural Relics, 1996). The sites were systematically excavated between 1957–1959, by the Institute of Archaeology, Chinese Academy of Social Sciences and Qinghai cultural relics administration committee, and the NMH culture was first named (Zhao and Wu, 1960).
Fig. 1
Location of Talitaliha archaeological site in the Qaidam Basin. The site (red star symbol) is located at the edge of a huge proluvial fan. Black triangles represent other Nuomuhong culture sites in the Qaidam Basin: (1) Hongshanzuinanpo (Chen et al., 2015); (2) Baishuihexian; (3) Tawendaliha (Chen et al., 2015); (4) Xiariyamakebu (Chen et al., 2015); (5) Keer (Chen et al., 2015); (6) Shangchaikai; (7) Qiaohuerage.
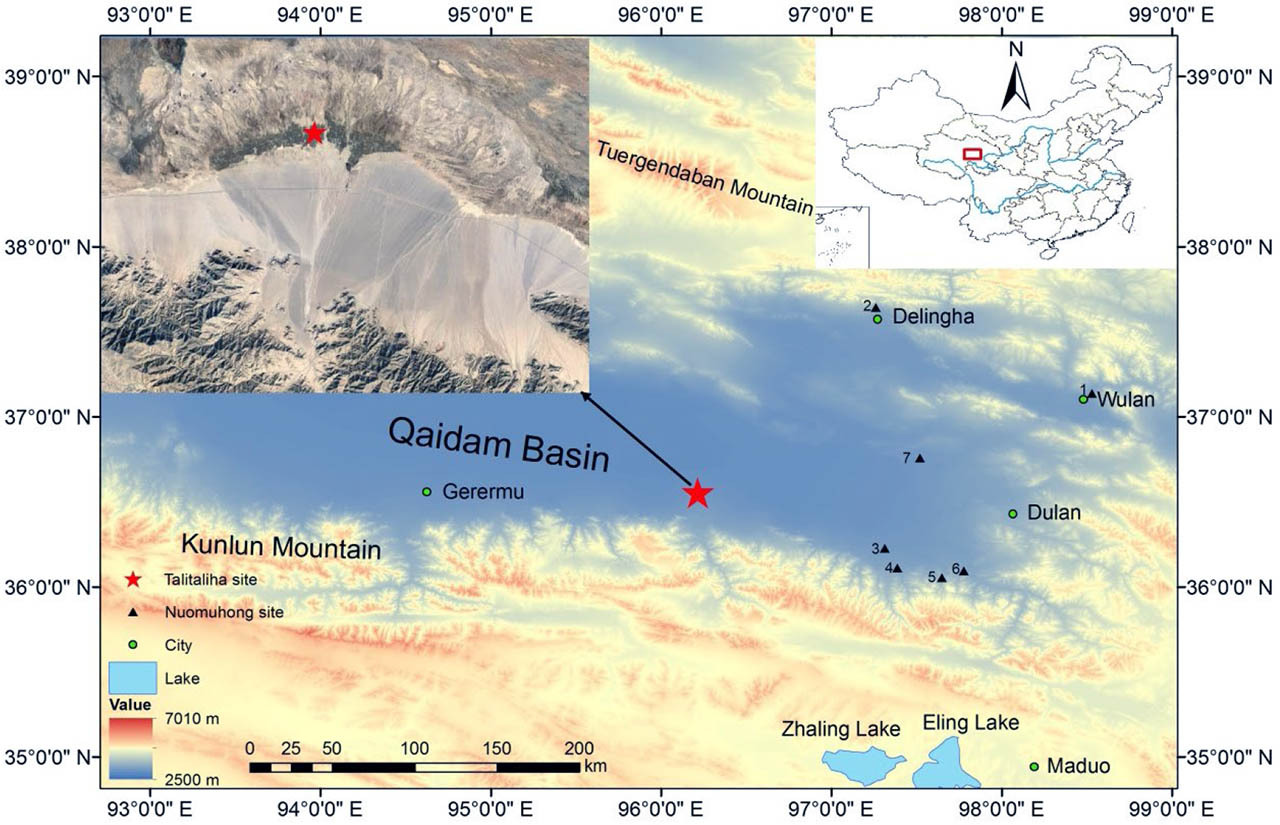
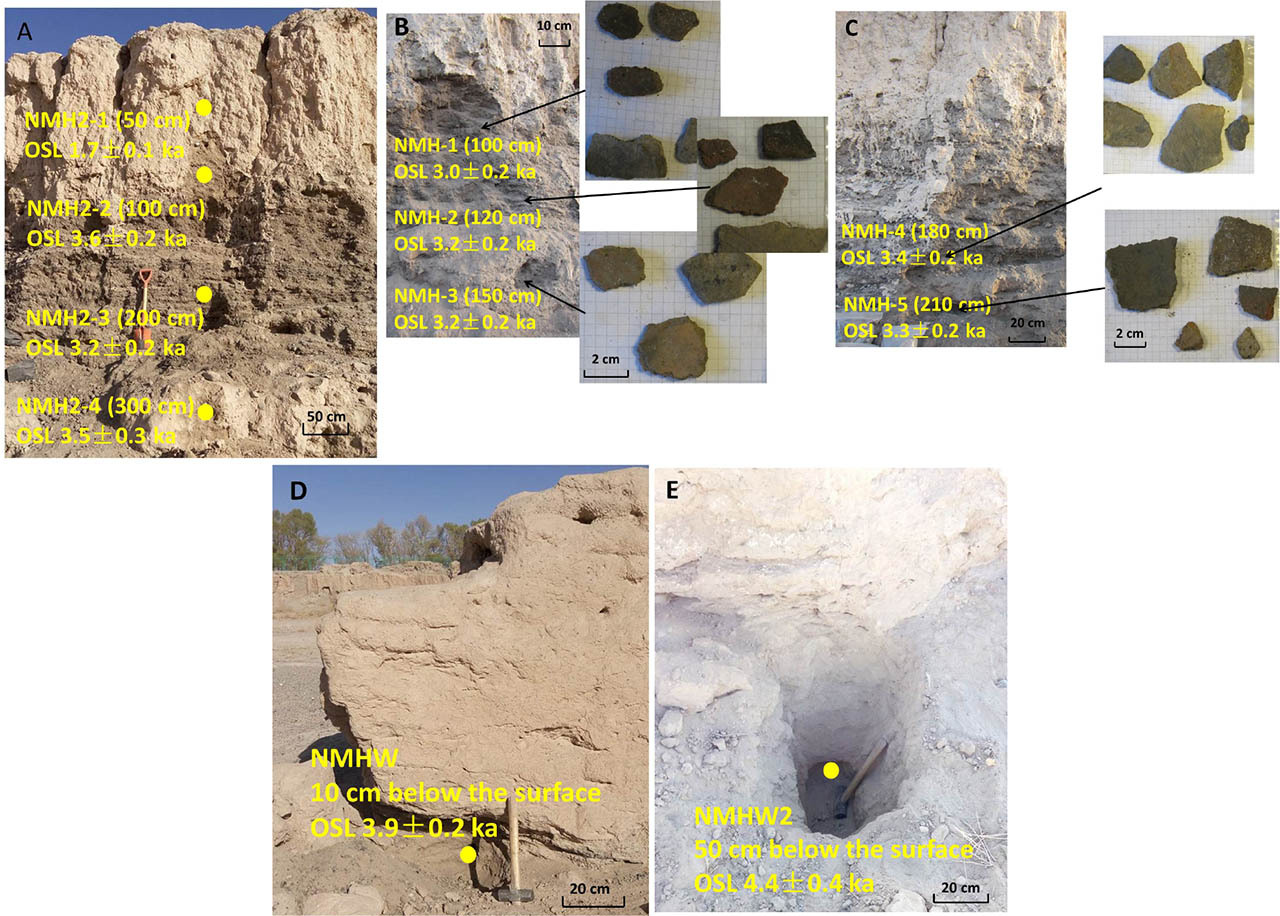
Talitaliha (36°26′17.88″N, 96°23′10.80″E, 2802 m asl) is the most important NMH culture site as it represents the only Bronze Age settlement above 2700 m in the northern QTP (Dong et al., 2016). Talitaliha site is located on a huge proluvial fan at the southeastern edge of the Qaidam Basin (Fig. 1). The site covers an area of about 60,000 m2 and was first excavated by the Institute of Archaeology Chinese Academy of Social Sciences and Qinghai cultural relics administration committee in 1957–1959 (Zhao and Wu, 1960). Many archaeological remains, including ceramics, charred seeds, animal bones and charcoal, were found in the thick cultural layer of the Talitaliha site, which is mantled by c. 1 m of sandy loess and aeolian sand (Fig. 2A). For this study, five groups of ceramics and four sediment samples were collected for OSL dating from a well-exposed section (Fig. 2A, 2B and 2C). Charcoal and bones from the same cultural layer as the ceramics were sampled using tubes for radiocarbon dating to provide a cross-check for the OSL ages. Two OSL samples were also taken from beneath a rammed earth wall in the south of the site, to determine a maximum age for permanent occupation of the site by NMH people (Fig. 2D and 2E).
Fig. 2
Study section and sample locations. (A) Overview of the sampling section at Talitaliha site showing location of four OSL sandy loess samples. (B) and (C) Five groups of sand tempered grey ceramics were sampled for OSL from the thick culture layer. (D) and (E) Two OSL sandy loess samples were taken from below the earth wall, located in the south of the site, to provide a lower dating limit for the Talitaliha site.
. MATERIALS AND METHODS
Sample preparation
The first step in the preparation of the ceramics was to remove 3–5 mm depth from the surface to avoid the effect of any light exposure. The inner material was then lightly crushed with a vice, and a large grain size range of 90–250 μm was separated by sieving in order to maximize suitable dating material. Coarser particles were crushed and re-sieved several times until sufficient material was obtained. For the stratigraphic tube samples, 3–5 cm was removed from each end and reserved for environmental dose rate determination. The coarse-grained (63–90 μm) fraction of the unexposed middle section was obtained by wet-sieving. The coarse fractions from both the ceramics and sediment samples were treated with HCL (10%) and H2O2 (10%) for 20 min. to remove carbonate and organic material, and HF (10%) for 40 minutes to remove heavy minerals. The quartz-rich fraction was then separated from the K-rich feldspar fraction with an aqueous heavy liquid solution (‘Fastfloat’, sodium polytungstate) of density 2.58 g/cm3. The quartz-rich fraction was purified with HF (40%) for 40 minutes to remove the remaining feldspar contamination and the outer alpha-irradiated layer. Fluoride contamination was removed using 10% HCL for 20 min. Samples were washed with deionized water after each step. Finally, the quartz and feldspars grains were spread on 9-mm-diameter stainless steel discs and cups, respectively, using silicone oil. All operations were carried out under subdued red light.
Method and experimental facilities
All OSL measurements were carried out on an automated Risø RL/OSL-DA-20-C/D reader with a calibrated 90Sr/90Y beta source. OSL signals from quartz and infrared stimulated luminescence (IRSL) signals from feldspar were stimulated by blue (λ=470 nm) and IR LEDs (λ=830 nm) with a power density of c. 80 mW cm−2 and c. 135 mW cm−2, respectively. The OSL signal was detected using a 7.5 mm Hoya U-340 glass filter, and the IRSL signal was measured by a blue BG3/BG39 filter combination.
Ceramic quartz OSL measurements used the single-aliquot regenerative (SAR) dose protocol (Murray and Wintle, 2000; Wintle and Murray, 2006). Calculations were based on the first 0.32 s of the signal (first two channels) minus an early background from the following two channels (i.e., 0.32 s to 0.64 s) (Ballarini et al., 2007; Cunningham and Wallinga, 2010). Quartz purity was checked by IR stimulation at 125°C for 40 s followed by blue light stimulation at 125°C for 40 s. The absence of IRSL in the samples indicates that there is negligible contamination of the quartz signal by feldspar. Ceramic feldspar measurements used the post-IR IRSL (pIRIR) SAR protocol, with the second stimulation held at 290°C (pIRIR290) (Thiel et al., 2011). Signals were derived from the integral of the first 10 s of pIRIR stimulation minus a background from the last 50 s. The luminescence ages of the four sediment samples from the cultural layer and the two stratigraphic samples from below the earth wall were etermined by the SAR protocol, with preheat temperatures of 260°C and 220°C, respectively. Details of the quartz and feldspar protocols are shown in Table 1.
Table 1
Sequential steps followed in this study for the measurement of single-aliquot regenerative (SAR) and post-IR IRSL (pIR50IR290).
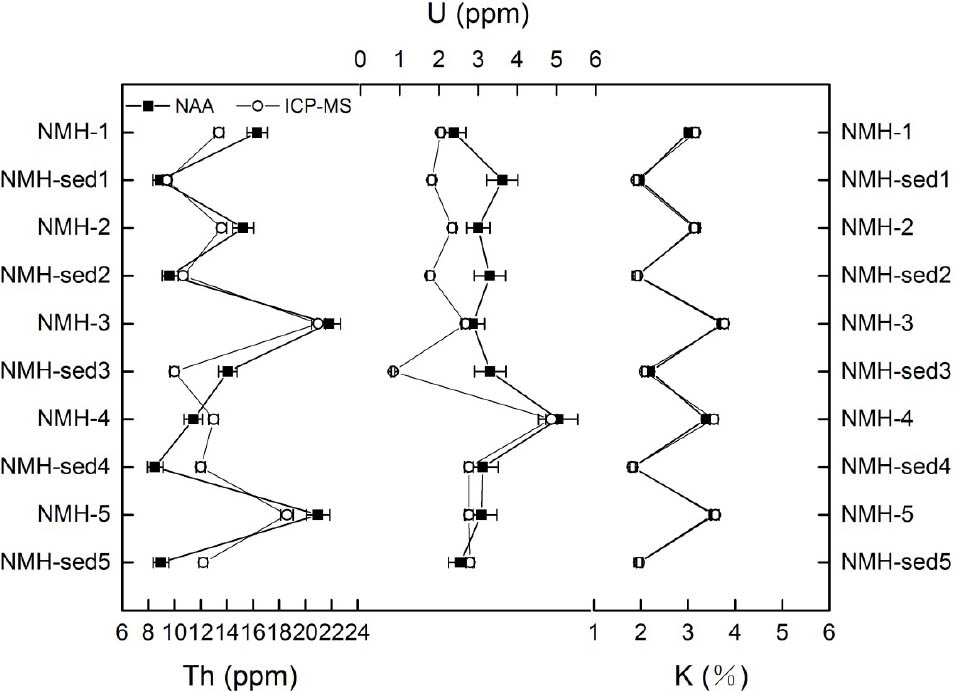
Samples of sediment surrounding the five ceramic samples were collected to estimate the external gamma dose. The 2–5 mm depth of material that was removed from the surface of the five ceramics was crushed in an agate mortar by hand and used to evaluate the internal beta dose. Concentrations of U, Th and K in the ceramic and surrounding sediment samples were measured by both inductively coupled plasma mass spectrometry (ICPMS) and neutron activation analysis (NAA) (Table 2). Concentrations of U, Th and K from the stratigraphic samples were measured by ICP-MS. The beta and gamma dose rate was then calculated (Table 3) using the conversion parameters described in Guérin et al. (2012). Cosmic ray contribution was calculated according to Prescott and Hutton (1994). Considering the extreme aridity of the Qaidam Basin, a water content of 5±4% was assumed for the environmental sediment and ceramics in the burial period. The resulting dose rate was calculated as a function of depth, altitude and geomagnetic latitude.
Table 2
Concentrations of U, Th and K in ceramic, sediment and sandy loess samples.
Table 3
Calculated quartz and feldspar dose rates for ceramics measured by inductively coupled mass spectrometry (ICP-MS) and neutron activation analysis (NAA), and for stratigraphic samples from the culture layer and below the earth wall measured by ICP-MS.
All ceramic samples preparation was undertaken at the Nordic Laboratory for Luminescence Dating, as was quartz OSL measurement. Feldspar IRSL was measured at the Qinghai Provincial Key Laboratory of Physical Geography and Environmental Processes. Stratigraphic samples were prepared and measured in Qinghai Provincial Key Laboratory of Physical Geography and Environmental Processes. Concentrations of U, Th and K in ceramics and sediments were measured by NAA at the China Institute of Atomic Energy in Beijing and by ICPMS at the Geological Survey Center in Xi’an. Charcoal and bone samples were dated by the radiocarbon AMS method at Beta Analytic, Miami, FL, USA. Calibration of 14C dates was performed using the ‘CALIB REV 7.0.2’ program (Stuiver and Reimer, 1993). The 14C ages were converted to calendar years, and 65 years were added to the calibrated 14C age in order to compare them with the OSL ages (to account for the “present” being AD 1950 in the 14C calibration).
. RESULTS AND DISCUSSION
Environmental dose rate
Concentrations of U, Th and K from stratigraphic samples measured by ICP-MS are shown in Table 2, and comparison of radionuclide concentrations obtained by ICP-MS and NAA from ceramics and surrounding sediment are shown in Fig. 3 and Table 2. The concentration of K measured by the two methods is almost consistent, as is the U and Th content of ceramics, but there are some significant differences in concentrations in the sediment and stratigraphic samples. Given that the archaeological site has been disturbed by human activity, the environmental dose rate would be expected to be heterogeneous. Furthermore, only a very small sample size is used for ICP-MS and NAA, and it may not be representative of the entire surrounding sediments. Therefore, it is not surprising that the dose rate of sediments from the cultural layers is variable, but it does highlight the need to take more environmental samples and make samples more homogeneous in future analyses. The variability is much less for the ceramic samples, so we recommend using ICP-MS, which has a smaller sample consumption than NAA, for analysis; we based the age calculation in this study on radionuclide concentration measured by ICPMS.
Luminescence characteristics
The luminescence characteristics of both quartz and K-feldspar were investigated to select an appropriate protocol for analysis of the ceramic samples. Typical dose response and stimulation curves are shown in Fig. 4A.
Fig. 4
Luminescence characteristics of quartz OSL and K-feldspar post-IR IRSL (pIRIR) signals from ceramic, and of the quartz OSL from stratigraphy sample. (A) Best fit growth curve using an exponential function for quartz from sample NMH-1, with a natural stimulation curve inset. (B) Best fit growth curves using an exponential function for coarse-grained K-feldspar from sample NMH-1, with a natural stimulated curve of IRSL and pIRIR290 inset.
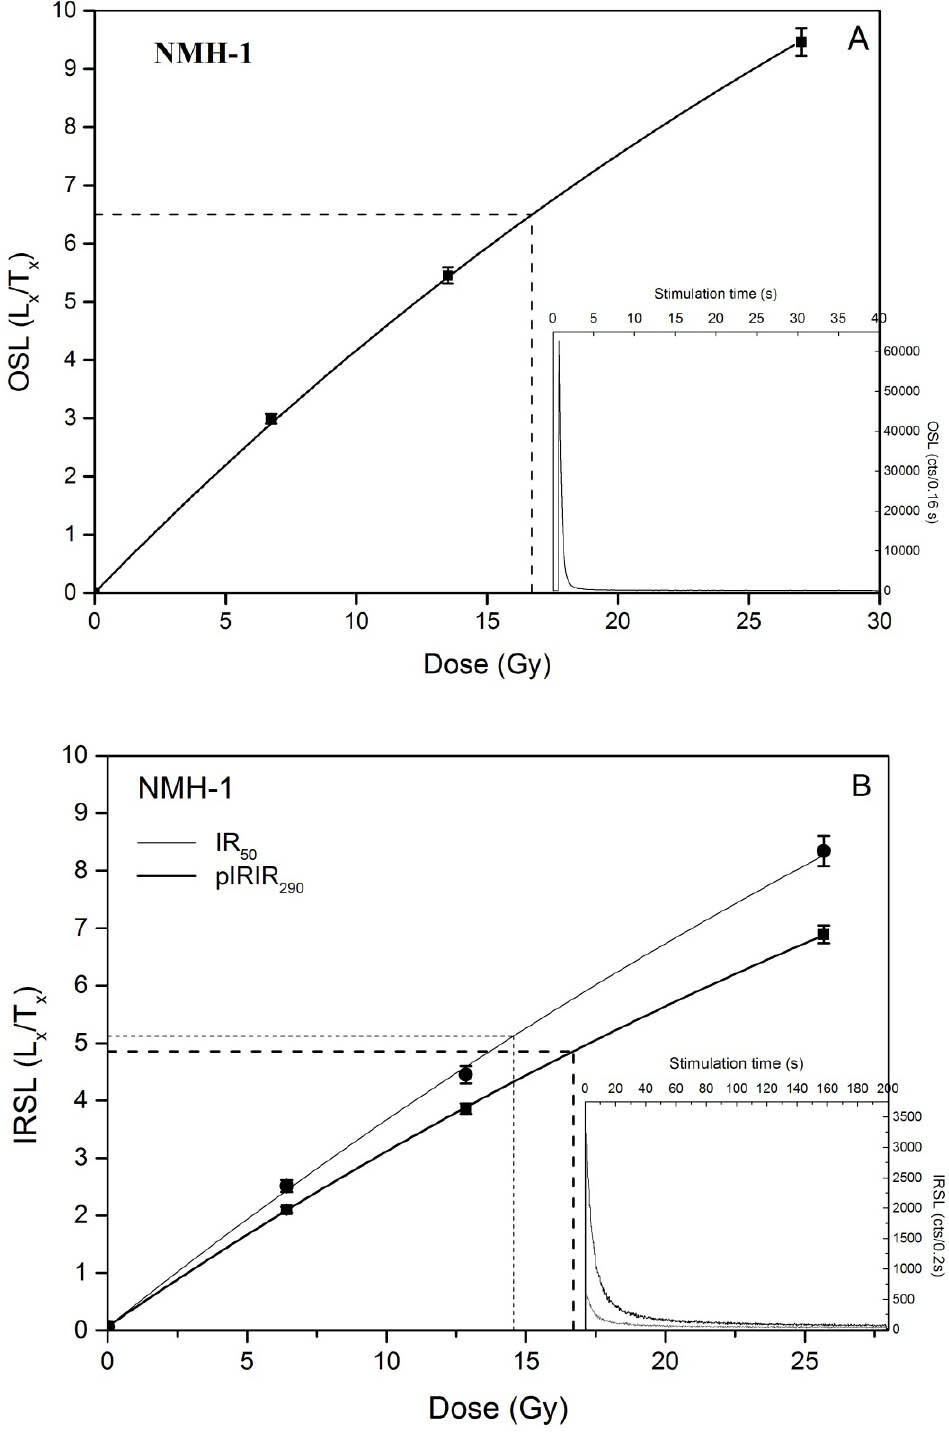
The quartz OSL decay curve represents a bright natural signal that attained 60,000 counts (Fig. 4A). The OSL signal was rapidly bleached to background level within 2 s indicating fast-component domination. In order to choose a suitable preheat temperature for De determination, a preheat plateau test was performed (on ceramic sample NMH-5). Three aliquots were measured at pre-heat temperatures from 160 to 300°C at 20°C increments over intervals of 10 s. A clear plateau was apparent between 160 and 260°C, with a recycling ratio of 0.9–1.1 and recuperation range of −0.003 to 1.26%. Therefore, we chose a preheat and cut-heat temperatures of 200°C and 160°C, respectively, for De determination. The overall average recycling ratio for the five ceramic samples was determined as 0.99 ± 0.01 (n=99 aliquots) and the overall recuperation ratio as −0.3% (n=99), indicating that the SAR protocol adopted is able to correct for any sensitivity changes in the laboratory-regenerated SAR cycles in our samples. To further verify the general suitability of the preheat temperature for the five ceramic samples, dose-recovery tests were carried out (six aliquots of each sample). The average measured to given dose ratio was 1.06 ± 0.02 (n=30 aliquots), suggesting a reliable quartz protocol. Finally, 15 to 21 aliquots of each sample were measured by SAR to obtain average De. The over-dispersion (OD) ratio of De is relatively low, ranging from 6.2 to 17.5% (Table 4).
Table 4
Quartz OSL and K-feldspar pIRIR290 dating results for five ceramic samples and quartz OSL results for six sandy loess samples from Talitaliha site. Samples NMH2-1, NMH2-2, NMH2-3 and NMH2-4 are from the culture layer and samples NMHW and NMHW2 are from the surface layer.
For K-feldspar, a pIRIR protocol with no fading correction was chosen, based on previous studies on a range of sedimentary samples from around the world that confirm the robustness of ages using this approach (Arnold et al., 2015; Buylaert et al., 2012). The pIR50IR290 protocol was selected to minimize fading effects. Twelve cups for each sample were measured by pIRIR290; typical growth and decay curves for ceramics are shown in Fig. 4B. The intensity of the pIRIR290 signal was much greater than that of the IRSL50. The average pIRIR290 recuperation for the ceramic samples was negligible at 0.65±0.04%. Usually, the dependence of De to the first IR stimulation temperature is minimal (Khasawneh et al., 2015; Long et al., 2019), thus, we did not carry out a preheat plateau test. The OD ratio of the feldspar De in ceramic samples was much lower and covered a smaller range than for quartz (Table 4).
Luminescence dating of ceramics assumes that the samples were heated (during firing) to a temperature that was sufficiently high to completely reset the luminescence signal (Khasawneh et al., 2015). Therefore, no residual dose was subtracted in any of our age calculations.
For quartz OSL measurements on the sandy loess stratigraphic samples, 18–30 aliquots were measured by SAR to obtain the average De. The natural OSL signal of quartz (sample NMH2-2) bleached to the background rapidly, showing the rapid composition characteristics of quartz. The OD ratio of the quartz De in the stratigraphic samples was relatively low and concentrated (Table 4).
Luminescence age
The reliability of K-feldspar pIR50IR290 for dating ceramics at the site was verified by comparison with the quartz OSL age obtained for each sample (Fig. 5). The feldspar age of NMH-5 is slightly younger than the others but more consistent with other quartz ages. Overall, K-feldspar pIRIR290 and quartz OSL ages are consistent within one standard error, and the ratio of OSL age to pIRIR290 age is between 0.9–1.1 (Fig. 5). All luminescence dating results are summarized in Table 4 and Fig. 6. Since the luminescence signal of quartz from ceramics is much higher than that of feldspar, the quartz ages were used as the ages of ceramics. The two OSL ages from the cultural layer are consistent with the ceramic ages. The sandy loess layer above the cultural material was dated to 1.7±0.1 ka, indicating enhanced aeolian activity commenced from c. 2 ka. Sandy loess below the cultural layer was dated to 3.5±0.2 ka, which is consistent with the upper cultural layers and ceramics.
Fig. 5
omparison of quartz OSL ages and K-feldspar pIRIR290 ages from Talitaliha. Solid line represents 1:1 and dashed lines represent ±10% deviation.
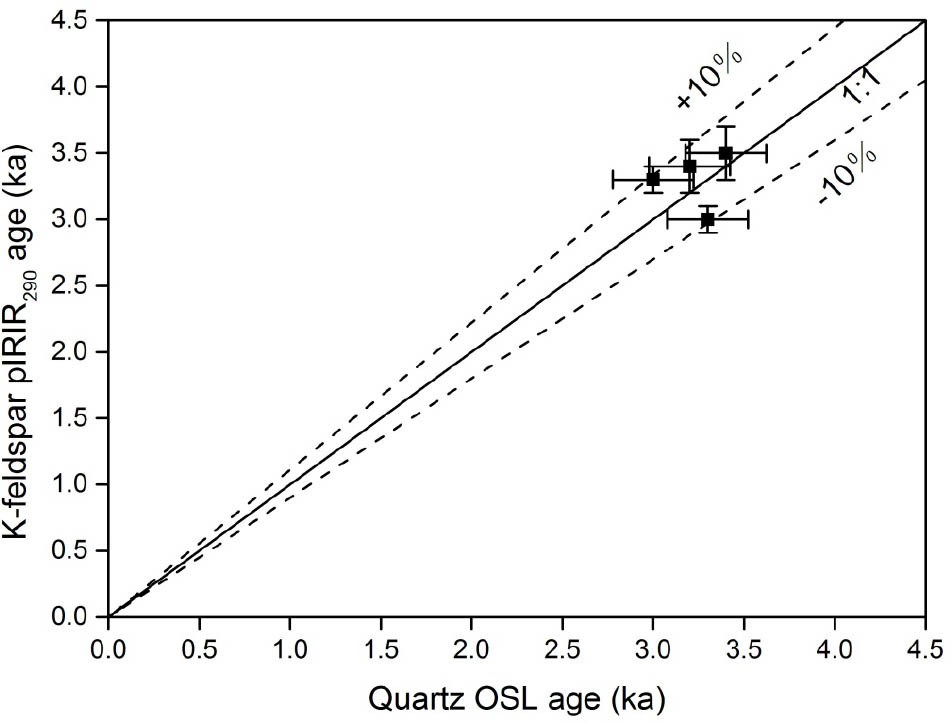
Fig. 6
Comparison of luminescence ages for ceramics and stratigraphy samples with calibrated radiocarbon ages for Talitaliha site. Age determinations from this study are consistent with the 14C age of the towel (the pink line) (IA, CASS 1991). The green line represents the 14C age of the stake, which is influenced by the “old wood” effect (Dong et al., 2014).
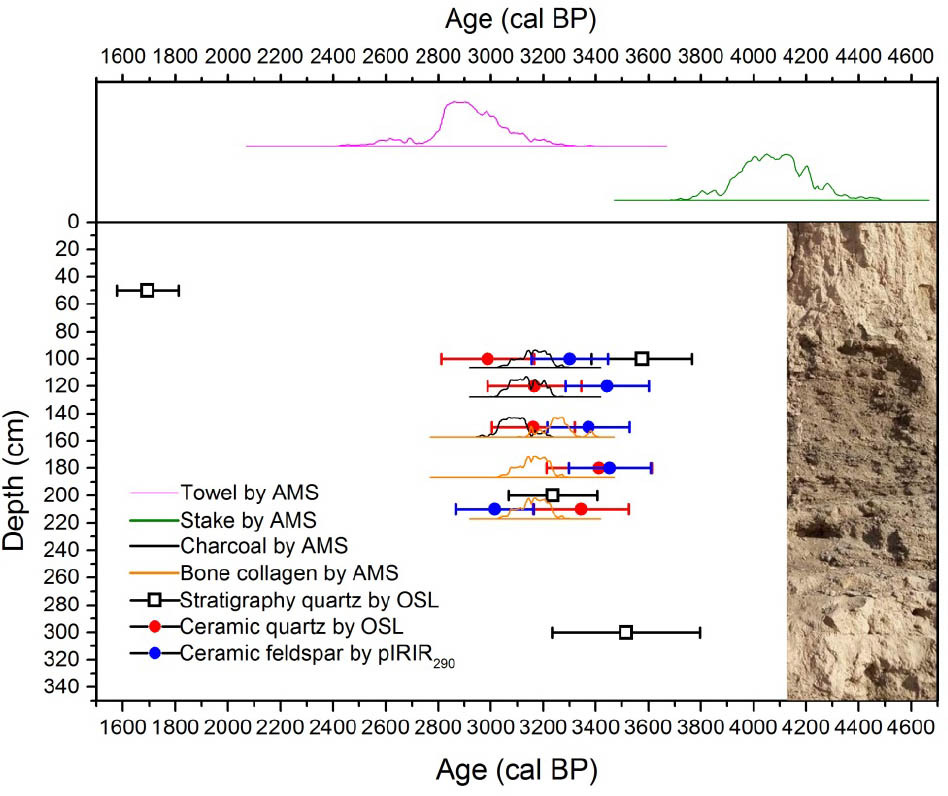
Luminescence dating on the two sandy loess samples from under the earth wall gave ages of 3.9±0.2 and 4.4±0.4 ka, which is slightly older than the cultural layer. When building walls, people routinely clear and dig the ground, but in our results, the age of the sample from 10 cm sediment below the earth wall is very close to that of the remains in the culture layer, with no apparent hiatus between them. This indicates that the underlying stratigraphy was not substantially altered during construction of the earth wall, which seems to have been placed on the original ground, and suggests the purpose of the wall was for livestock management rather than a defence against invasion by other tribes. The large amount of sheep-dung identified at the site supports this deduction (Wu, 1963).
Age of Talitaliha site
Radiocarbon dating of wood/charcoal has been widely used to represent the timing of human activities. However, prehistoric humans preferred to use dead, dry wood which burned easily, and that may result in inaccurate dating due to the “old wood” effect (E et al., 2018). The 14C age obtained from animal bones is likely to be more reliable than that of charcoal; domestic animals such as cattle and sheep were an important food source and were generally short-lived (E et al., 2018). The radiocarbon ages of three charcoal and three bone samples from the cultural layer at Talitaliha are in a good agreement, ranging between 3300–3000 cal BP (Table 5). The radiocarbon results fall within the range of the luminescence ages, indicating that the charcoal samples in this study have no discernable “old wood” effect. Overall, the quartz OSL ages are closer to the 14C ages, with some K-feldspar pIRIR290 ages a little older. Thus, for future ceramic dating applications, quartz OSL dating is recommended.
Table 5
Calibrated radiocarbon dates from Talitaliha site. There is good agreement of ages from charcoal and bone. As explained in the text, when cross-checking with OSL dates from the site, 65 years was added to the calibrated 14C result.
Implications for settlement location and age of the NMH culture
The first dates for prehistoric human activity at altitudes above 3,000 m in the northeastern QTP are in the range 15,000–5,000 cal BP (Brantingham et al., 2007; Dong et al., 2016; Madsen et al., 2006; Rhode et al., 2007; Sun et al., 2010). Sporadic finds of palaeolithic tools have been made at several sites, including Lenghu, Da Qaidam and Xiao Qaidam in the Qaidam Basin (Brantingham et al., 2003; Brantingham and Gao, 2006; Sun et al., 2010; Zhou et al., 2003). The age of these palaeolithic sites is generally believed to be younger than c. 8 ka, not c. 30 ka as once thought (Sun et al., 2010), and they represent seasonal occupation for subsistence hunters and gatherers. Permanent settlement in the Qaidam Basin is thought to have occurred in the Bronze Age, as agropastoralism was developed by the NMH culture (Bureau of National Cultural Relics, 1996; Chen et al., 2015; Dong et al., 2016). In contrast with palaeolithic sites that are associated with lakeside locations, most NMH sites, including Talitaliha, are located on huge proluvial fans. The fans may have provided higher-quality freshwater for the agro-pastoralism of the NMH people, which is vital for human existence in an extremely arid region. The degree of mineralization of the top layer of groundwater increases with runoff length and water quality grades from brine to saltwater and then to freshwater from the salt marsh to the top of the proluvial fan (Wang and Hu, 1998). Therefore, the large proluvial fans provided more stable and less climatically-sensitive locations for a permanent settlement of NMH people than other smaller oases (Jia et al., 2017). Even today, proluvial fans characterized by relatively flat terrain and abundant water are the main habitat of the modern agricultural population.
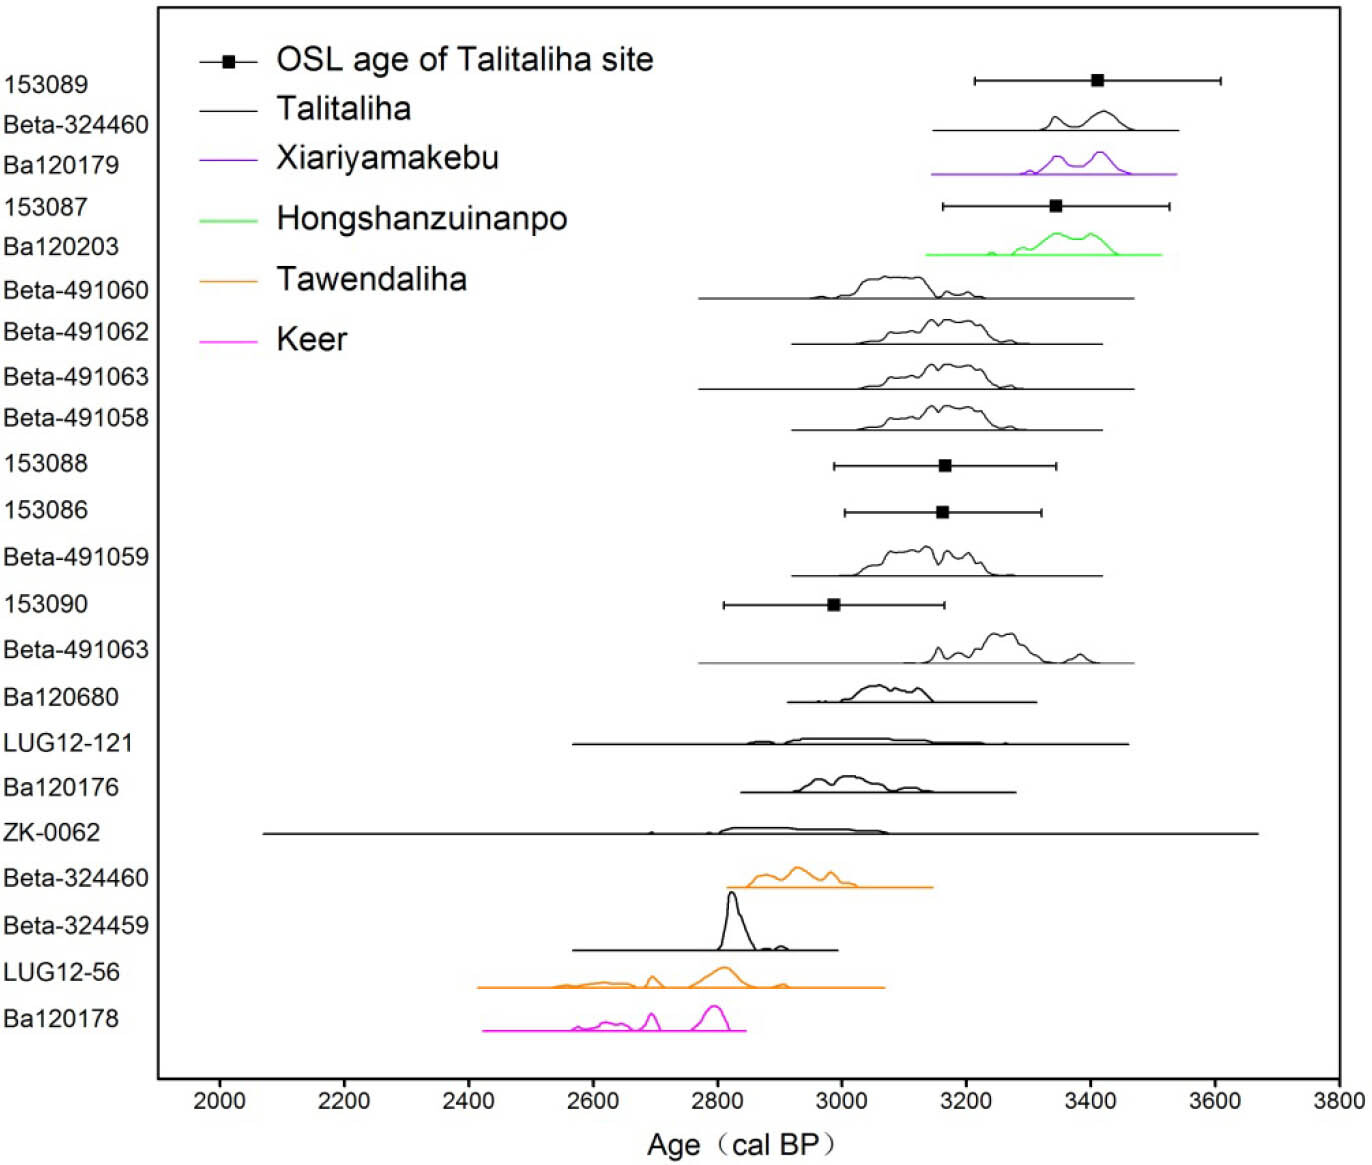
Fig. 7 plots quartz OSL ages from the Talitaliha site with calibrated radiocarbon ages for other NMH settlements in the Qaidam Basin (from Chen et al., 2015; Dong et al., 2016; IA, CASS, 1991). The combined dataset gives an age range for the NMH culture of 3400–2450 cal yr BP (Fig. 7).
Fig. 7
Comparison of quartz OSL ages from this study with calibrated radiocarbon ages from typical Nuomuhong sites in the Qaidam Basin. All ages show good agreement, ranging between 3400–2450 cal yr BP. Note*: Samples Beta-324460 (barley), BA120179 (wheat), BA120203 (barley), Beta-324459 (barley) and BA120178 (barley) are from Chen et al. (2015); samples BA120176 (barley) and LUG12-121 (charcoal) are from Dong et al. (2014); samples LUG12-56 (charcoal), BA120680 (charcoal) and Beta324460 (charcoal) are from Dong et al. (2016); and sample ZK-0062 (charcoal) is from IA, CASS (1991).
. CONCLUSIONS
Quartz OSL and K-feldspar pIRIR290 protocols were used to date ceramic samples from a cultural layer associated with the NMH culture at Talitaliha site, in the Qaidam Basin. The luminescence characteristics of the samples were systematically investigated. The quartz and K-feldspar luminescence ages of five groups of ceramics show good agreement with 14C ages of bone and charcoal, and quartz OSL ages of sediment, from the same cultural layer. The results suggest that OSL dating of ceramics has great potential in future archaeological studies on the QTP. The new ages confirm the age of Talitaliha site as ranging between 3400–2800 cal yr BP, which fits within the timespan of dates for the NMH culture at other sites in the Qaidam Basin of between 3400–2450 cal yr BP.