
. INTRODUCTION
In recent years, substantial progress has been achieved in the discoveries and studies of the Chinese Paleolithic, especially for the Late Pleistocene period (Lu et al., 2011; Sun et al., 2012; Gao, 2013; Liu et al., 2015; Zhang et al., 2018). The fact that numerous open-air Paleolithic sites have recently been found and excavated in south China implies that south China plays a pivotal role in understanding the origin and prehistory of humanity in East Asia (Liu et al., 2008; Zhu et al., 2008). In addition, according to genetic studies (Chu et al., 1998; Piazza 1998; Wang and Li, 2013), south China is also the possible gateway for hominin to migrate into the hinterland of China, and thereby more detailed analyses of Paleolithic sites in south China are of great archaeological significance. However, it is hard to construct their chronological framework, because an intensive chemical weathering of the deposits results in the lack of suitable materials for numerical dating such as radiocarbon dating.
Optically stimulated luminescence (OSL) dating provides an estimate of the time elapsed since luminescent minerals, such as ubiquitous quartz or feldspar, were last exposed to sunlight (Huntley et al., 1985; Aitken and Smith, 1988), and it directly determines the burial ages of sediments. This method has already been extensively applied to Paleolithic archeology (Slimak et al., 2011; Roberts et al., 2015; Li et al., 2017; Hu et al., 2019). Various procedures have been developed to measure equivalent dose (De) of dated materials, including single-aliquot regenerative-dose (SAR) (Murray and Wintle, 2000), sensitivity-corrected multiple-aliquot regenerative dose (SMAR) (Zhou and Shackleton, 2001; Lu et al., 2007) and thermally-transfer SAR (TT-OSL SAR) (Wang et al., 2006) procedures on quartz, and post-infrared infra-red stimulated luminescence (pIRIR) (two-step pIRIR and multi-elevated-temperature pIRIR (MET-pIRIR)) procedures on potassium feldspars (Thomsen et al., 2008; Thiel et al., 2011; Li and Li, 2011, 2012a, 2012b).
In this paper, we used the above procedures on the fine-grained quartz and polymineral fractions of seven samples from the Huxushan Paleolithic site in northern Hunan Province, China. The luminescence ages obtained using the procedures were compared to evaluate their reliability, and the chronology of the site was established.
. GEOMORPHOLOGY, STRATIGRAPHY AND ARCHAEOLOGY
The Paleolithic site of Huxushan (28°56′20″N, 112°17′22″E) is located at the Chishan Island surrounded by the Dongting Lake in the northern part of Hunan Province, China (Fig. 1a). The Dongting Lake, located in the middle reach of the Yangtze River, is the second largest freshwater lake in China. The Lishui, Yuanjiang and Zishui rivers in the study area discharge water into the lake from the northwest, west and south, respectively. The length and width of the island are about 30 and 4 km, respectively. The elevation of the island is between 30 m above sea level (asl) in the north, and 80 m asl in the south. The covering sediments are characterized by the great thickness of red earth. The region is located in the humid subtropical monsoon climate zone, and has an annual mean precipitation of 1322 mm and the mean monthly temperature ranging from 4.3°C (January) to 29.1°C (July).
Fig. 1
(a) Map showing the location of the study site, and (b) photograph of the excavation pit showing the stratigraphy and the positions of OSL samples.
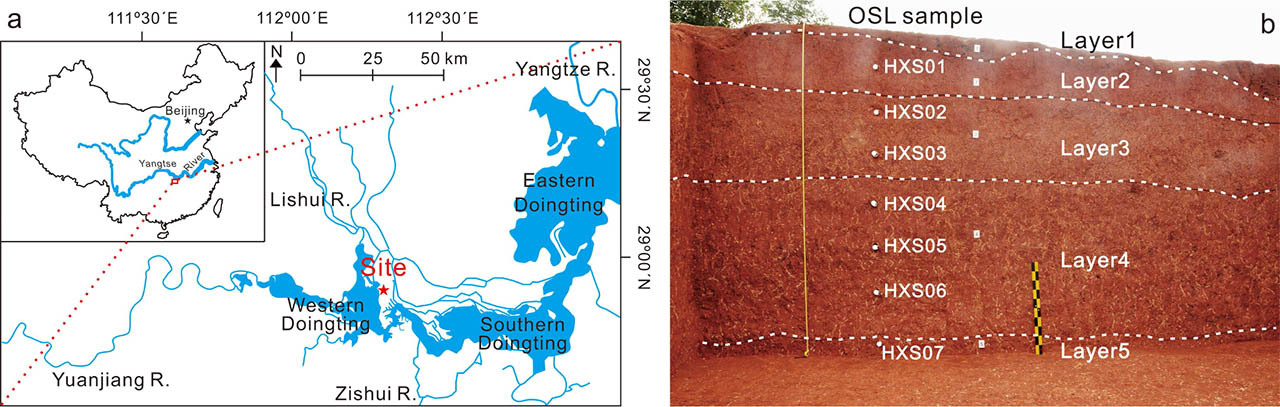
The Huxushan site is situated on the western gentle slope of a hill, and is one of the discoveries in this region during the archeological survey in 2016 led by archeologist Yi-Yuan Li from the Institute of Cultural Relics and Archeology of Hunan Province. The area of 350 m2 of the site has been excavated, and the deposits are divided into five layers numbered 1 to 5, from top to bottom (Fig. 1b). Layer 1 (0.2–0.8 m thick) is topsoil consisting of grey-yellow silty clay disturbed by human activities. Layer 2 (0.8–1.0 m thick) is composed of reddish-brown silty clay. Layers 3–5 comprise mottled red clay with worm- or net-like white stripes. Layer 3 (0.5–1.2 m thick) is reticulate red silty clay that is characterized by light yellow veins and massive Fe-Mn nodules. Layer 4 (2.0–2.5 m thick) consists of dark reddish-brown reticulate silty clay with a few Fe-Mn nodules. Layer 5 (0.4–0.5 m thick) is composed of deep reddish reticulate silty clay with short and thick white veins.
Stone artifacts were unearthed largely from Layer 3 and a few from the lower part of Layer 2 and the upper part of Layer 4. Raw materials in excavated assemblages are mainly comprised of quartz sandstone, quartz, siliceous limestone, quartzite and relatively small quantities of chert. We deduce that the raw materials were from the adjacent rivers because of the consistency in lithological characteristics and sedimentary types between the raw materials and the gravels found in the modern rivers. The stone artifacts include cobbles (manuports), cores, flakes and tools, suggesting a suit of incomplete technological assemblage. The sizes of lithic assemblage primarily have large tools and a few small productions such as flakes and scrapers. The cores are mainly composed of ordinary cores including single, dual or multiplatform and the others are discoidal and multi-faced. The flakes reflect low efficiency in using raw materials. The stone tools include chopping tools, picks, hand axes and heavy scrapers. Of these tools, though heavy tools are dominated, the number of picks and hand axes are relatively few but they are typical. The picks are triangular and tongue-shaped. The hand axes are made of siliceous breccia with delicately bifacial retouching.
. METHODS
Sampling and sample preparation
Seven sediment samples were collected from the stratigraphic profile of the south wall of the excavation pit for luminescence dating at the Luminescence Dating Laboratory of Peking University. The samples were taken by hammering stainless steel tubes (5 cm in diameter and 20 cm in length) horizontally into the vertical wall of freshly cleaned exposures. The tubes were then covered with aluminum foil and sealed with opaque tape.
Sample preparation for De determination was done under subdued red light in the dark room using the procedure described in Zhang and Zhou (2007). Carbonates in the samples were dissolved in 10% HCl acid, and organic matter was oxidized in 30% H2O2. The samples were then separated by wet sieving to attempt to obtain medium-grained (45–63 μm) fractions, but failed to obtain enough amount of the grains for De measurements. The poly-mineral fine (4–11 μm) grains were obtained by settling after Stokes’ Law. To obtain fine-grained quartz, some of the polymineral fine-grained fractions obtained were further purified with silica saturated fluorosilicic acid (H2SiF6) for three days followed by treatment with 10% HCl to remove any fluorides produced. The purity of the quartz extracts was checked by infrared stimulation followed by an OSL measurement. The IRSL signals detected were less than 0.1% of the OSL signal for all seven samples, indicating that feldspar contaminants were completely removed. The fine quartz and polymineral grains were respectively dispersed in acetone and then deposited onto 0.97 cm diameter aluminum discs for De measurements.
Equivalent dose determination
All luminescence measurements were performed in an automated Risø TL/OSL-20 luminescence reader. Irradiations were carried out using a 90Sr/90Y beta source equipped in the reader. Quartz grains were stimulated using blue LEDs (λ = 470 ± 30 nm), and the OSL signal was detected using an EMI 9235QA photomultiplier tube (PMT) with a 7.5 mm Hoya U-340 filter in front. Poly-mineral grains were stimulated using IR diodes (λ = 870 ± 40nm) with the IRSL signal collected through the same PMT with a Schott BG39/Corning 7-59 filter combination in front (Bøtter–Jensen et al., 2003).
Three procedures in Table 1 were employed to determine the equivalent dose of quartz extracts. In the SAR protocol (Murray and Wintle, 2000, 2003), regenerative beta doses include a zero-dose used for monitoring recuperation effects and a repeat of the first regeneration dose used for checking the reproducibility of the sensitivity correction (i.e. recycling ratio). Test doses were irradiated immediately after measuring natural or regenerative-dose OSL signals (Li) to produce the OSL signal (Ti) for correcting sensitivity changes due to preheating/OSL measurements. De value is obtained by projecting the corrected natural OSL intensity (LN/TN) onto the dose-response curve (DRC) constructed using the corrected regenerative-dose OSL intensity (Li/Ti). Preheat of 250°C for 10 s (determined from preheat plateau tests, see the following section) and a cut-heat of 160°C were applied. A 280°C blue LED stimulations for 40 s was conducted at the end of each round of the measurement to reduce recuperation. The SMAR protocol (Zhou and Shackleton, 2001; Lu et al., 2007) was also used for the quartz extracts under the same conditions as in the SAR protocol. Six regeneration doses were performed, and their corrected OSL signals were used to construct DRC. Three aliquots were used for each regeneration dose.
Table 1
Protocols used for De measurements of fine quartz grains.
In order to check the upper age limit of the quartz OSL-SAR and OSL-SMAR methods for our samples, the samples were also measured using the TT-OSL procedure proposed by Wang et al. (2006) (Table 1). The TT-OSL can be separated into two parts, the recuperated OSL (Re-OSL) and basic transferred OSL (BT-OSL). It is shown that the Re-OSL signal continues to grow with increasing dose up to 20, 000 Gy, while this is not the case for the BT-OSL signal. Using the equation LRe-OSL = [LTT-OSL/TTT-OSL] – [LBT-OSL/TBT-OSL], Wang et al. (2006) showed that the ages for loess using both the OSL signal and the Re-OSL signal were consistent from modern to ~ 130 ka, demonstrating that Re-OSL could be used for dating. Here six aliquots were measured to obtain the intensity of natural TT-OSL (LTT-OSL) and basic transferred OSL (LBT-OSL), respectively. Test doses were used immediately to obtain TTT–OSL and TBT–OSL signals in exactly the same way as in the SAR protocol. The Re-OSL De value was then obtained by projecting the corrected natural LRe-OSL intensity to the DRC constructed using the corrected regenerated LRe-OSL intensities. For quartz extracts, the initial 0.64 s signal minus the last 3.2 s integral as a background in the decay curves was used for dose calculation.
Two procedures listed in Table 2 were used to determine the equivalent doses of the polymineral fine grains. In the MET-pIRIR protocol proposed by Li and Li (2011, 2012a), the preheat of 320°C for 60 s was applied after both regenerative and test dose to clear great influence from residual signals from measurements (steps 7 and 14). The regenerative and test dose IRSL signals after preheat were measured for 100 s at stimulated temperatures of 50, 100, 150, 200, 250, 290°C, respectively. A 100 s IR bleaching at 325°C was applied at the end of each cycle to clear recuperation. The two-step pIRIR protocol was also employed to determine the equivalent doses of the fine-grained polymineral fractions (Thomsen et al., 2008; Thiel et al., 2011; Buylaert et al., 2012), in which the polymineral aliquots were preheated at 320°C for 60 s, and IR stimulation time is 200 s. The first IR stimulation temperature was 100°C (IRSL signal) determined by De plateau tests (see the following section for details) (Li and Li, 2012a), and the subsequent IR stimulation temperature was 275°C (post-IR IRSL signal, pIRIR(100, 275)). The IR clean-out at the end of each SAR cycle was carried out at 325°C for 200 s. The first 2 s signal minus a background estimated from the last 50 s in the decay curves was used for dose calculation. It is noted that the experiments for anomalous fading and residual doses were not carried out (see the following section for details).
Table 2
Procedures used for De measurements of fine polymineral grains.
Dose rate measurements
The annual dose estimation was based on U, Th and K concentrations. U and Th concentrations were determined by laser ablation inductively coupled plasma mass spectrometer (ICP–MS), and K concentrations were determined by a Wavelength Dispersive X-Ray Fluorescence spectrometer. Water contents (weight water/dry sediment weight) for all samples were measured in the laboratory, but the experiment results (13–14%) were probably lower than the natural values since the sediment section had been exposed to air for a long time. Therefore, we prefer to use a higher value of 23% obtained by similar samples from the Fengshuzui site (Zhang et al., 2018) close to the studied site. U, Th, K and water contents were assumed to have an uncertainty of 5% to cover analytical errors. The cosmic ray contribution for each sample was calculated as a function of depth, altitude, and geomagnetic latitude (Prescott and Hutton, 1994). The α-efficiency was taken as 0.04 ± 0.02 for quartz and 0.08 ± 0.02 for polymineral grains, respectively (Lai and Brückner, 2008). Finally, annual dose rates and ages were calculated using the DRAC calculator (v1.2) (Durcan et al., 2015).
. RESULTS
Luminescence properties and ages of quartz extracts
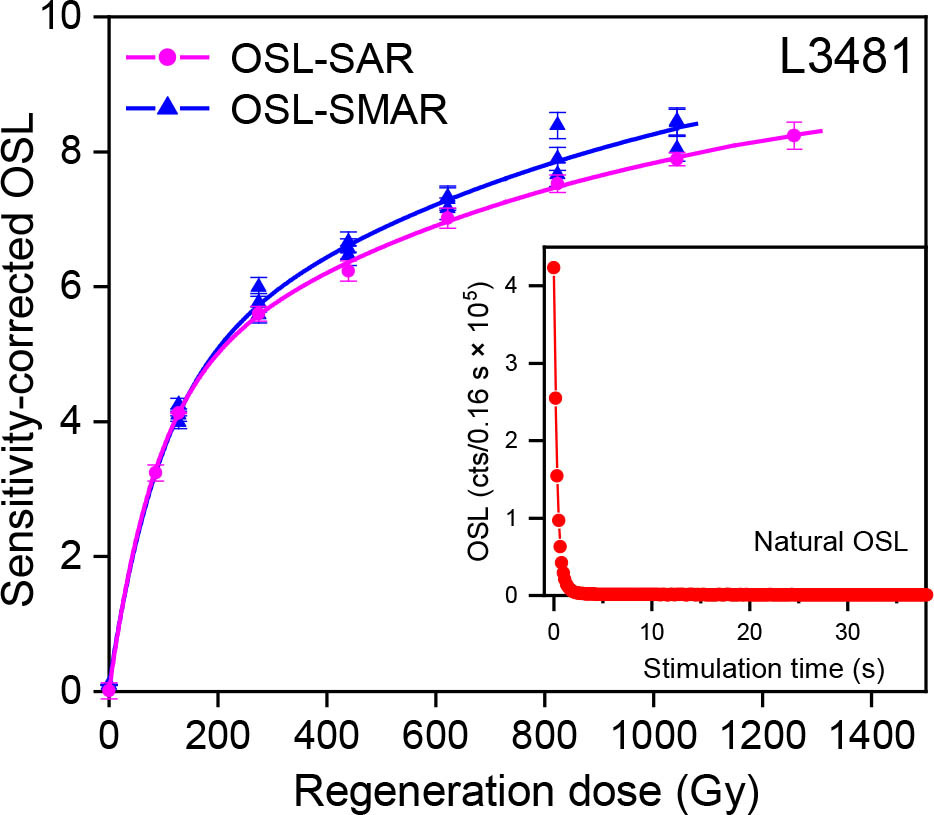
Examples of quartz OSL decay curves and SAR- and SMAR-OSL DRCs for our studied samples are illustrated in Fig. 2. Note that the DRCs for all samples were fitted with a single exponential saturation (SE) or saturating exponential plus linear function (SEPL) using the Risø luminescence Analyst version 4.53 software. The shine-down curve indicates that the quartz natural OSL signal is reduced to 4.3% of its initial intensity after 0.96 s of blue simulation at the sample temperature of 125°C, demonstrating that the quartz grains are very bright, and the OSL signal is dominated by the fast component. The DRCs demonstrate that the OSL signals are not saturated at a dose up to about 1000 Gy, and have the characteristic saturation doses (D01 and D02) of 35 and 464 Gy, if the curve is fitted with a double saturating exponential function. The shapes of the SAR- and SMAR-OSL DRCs are identical when regeneration dose is less than about 400 Gy if errors are considered. The recycling ratios for all samples using the SAR protocol are within the range of 1.0 ± 0.1 and the recuperation less than 5%, suggesting that the sensitivity correction for these samples is successful and thermal transfer negligible.
Fig. 2
Comparison of dose-response curves constructed using the quartz OSL-SAR and OSL-SMAR protocols for sample L3481. The inset shows a natural decay curve for the same aliquot.
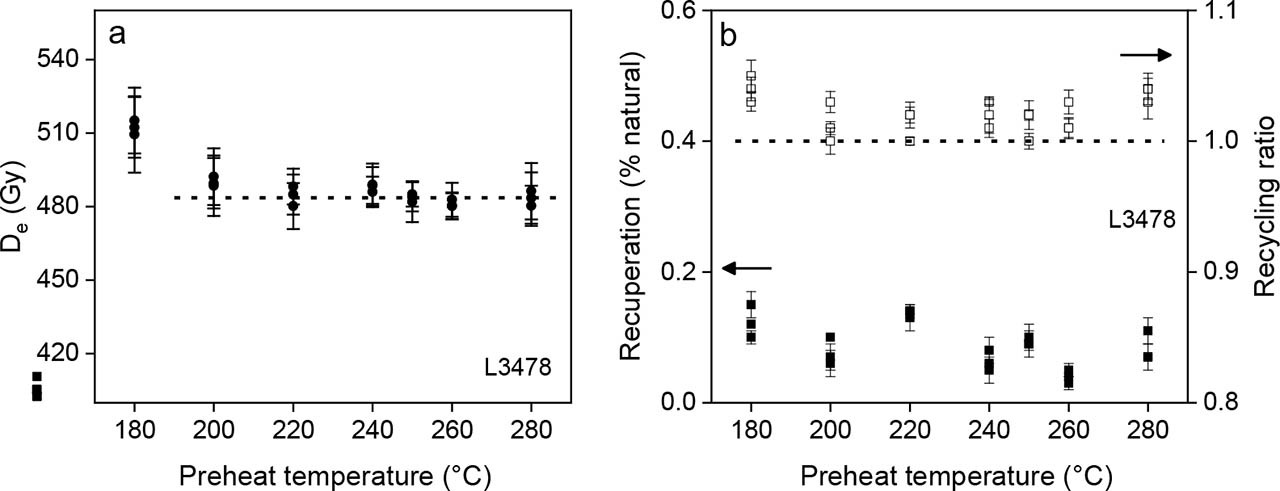
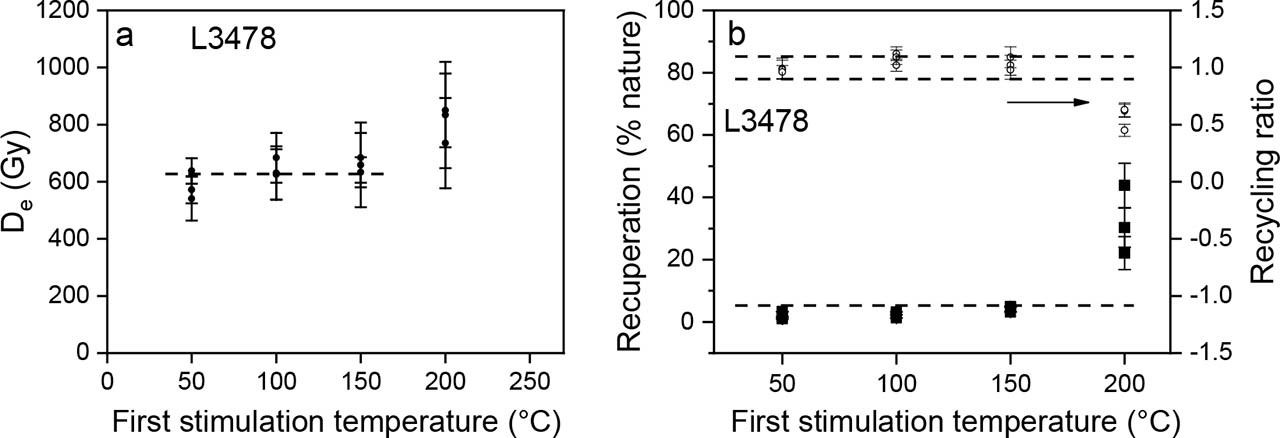
Preheat plateau tests were carried out to determine a suitable preheat temperature for quartz aliquots. The De values of aliquots from sample L3478 were measured using the SAR procedure in Table 1 with different pre-heat temperatures ranging from 180 to 280°C at 20°C increments. Three aliquots were measured at each preheat temperature. The results shown in Fig. 3a indicate that there is no dependency on De values on preheat temperature in the range of 200–280°C. The recycling ratios are within the range of 0.9 to 1.1, and the recuperation is less than 2% for all samples (Fig. 3b), indicating that the preheat temperatures of 200–280°C are suitable for De determination on the quartz aliquots.
Fig. 3
(a) Plot of De values as a function of preheat temperature in the range of 180 and 280°C at 20°C increments for sample L3478, and (b) recycling ratios and recuperation against preheat temperature. Three aliquots were determined at each preheat temperature.
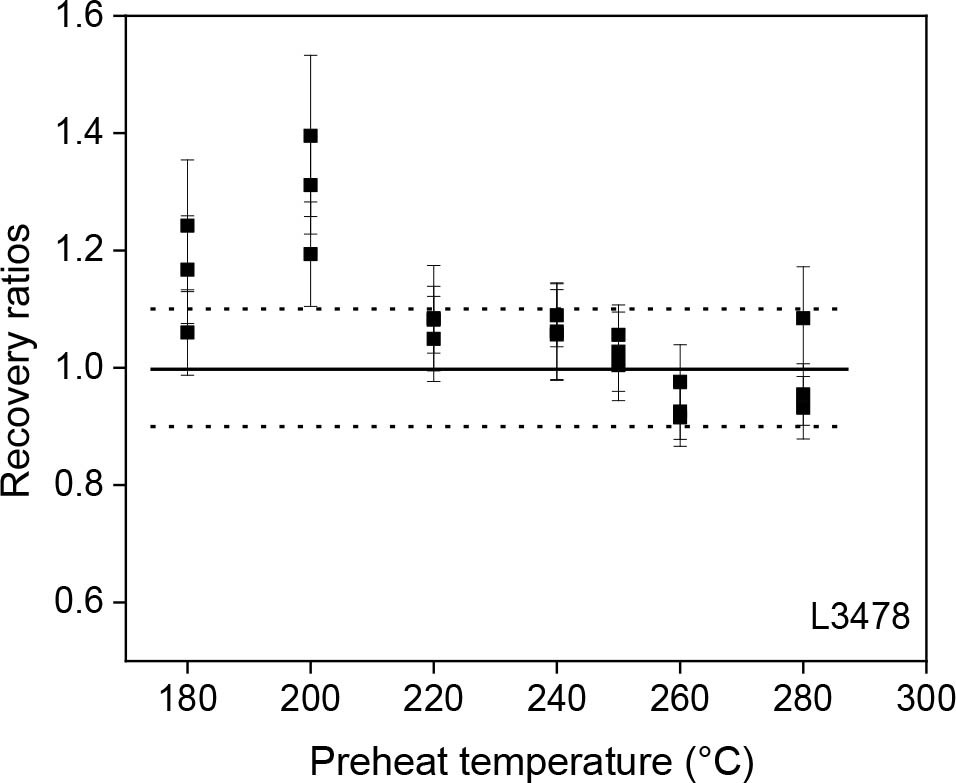
Dose recovery tests were also performed on the same sample as used in the preheat plateau tests to confirm the results of the preheat plateau tests. Prior to irradiating a laboratory dose, the natural OSL signals were removed by two 100 s blue light (blue LED) exposures at room temperature, separated by a 10 ks pause to allow any photo-transferred charge in the 110°C thermoluminescence trap to decay. The bleached aliquots were then irradiated with a given dose approximately equivalent to the De values of the sample, and the irradiated aliquots were measured using the SAR procedure in Table 1. Three aliquots were measured for each preheat temperature, and the results are shown in Fig. 4. It shows that the ratios of measured dose to the given dose (dose recovery ratio) are closest to unity at the preheat temperature of 250°C. Therefore, the preheat of 250°C for 10 s was used in the quartz OSL-SAR, OSL-SMAR and TT-OSL SAR procedures.
Fig. 4
Plot of recovery ratios versus preheat temperature for sample L3478. Three aliquots were tested at each preheat temperature.
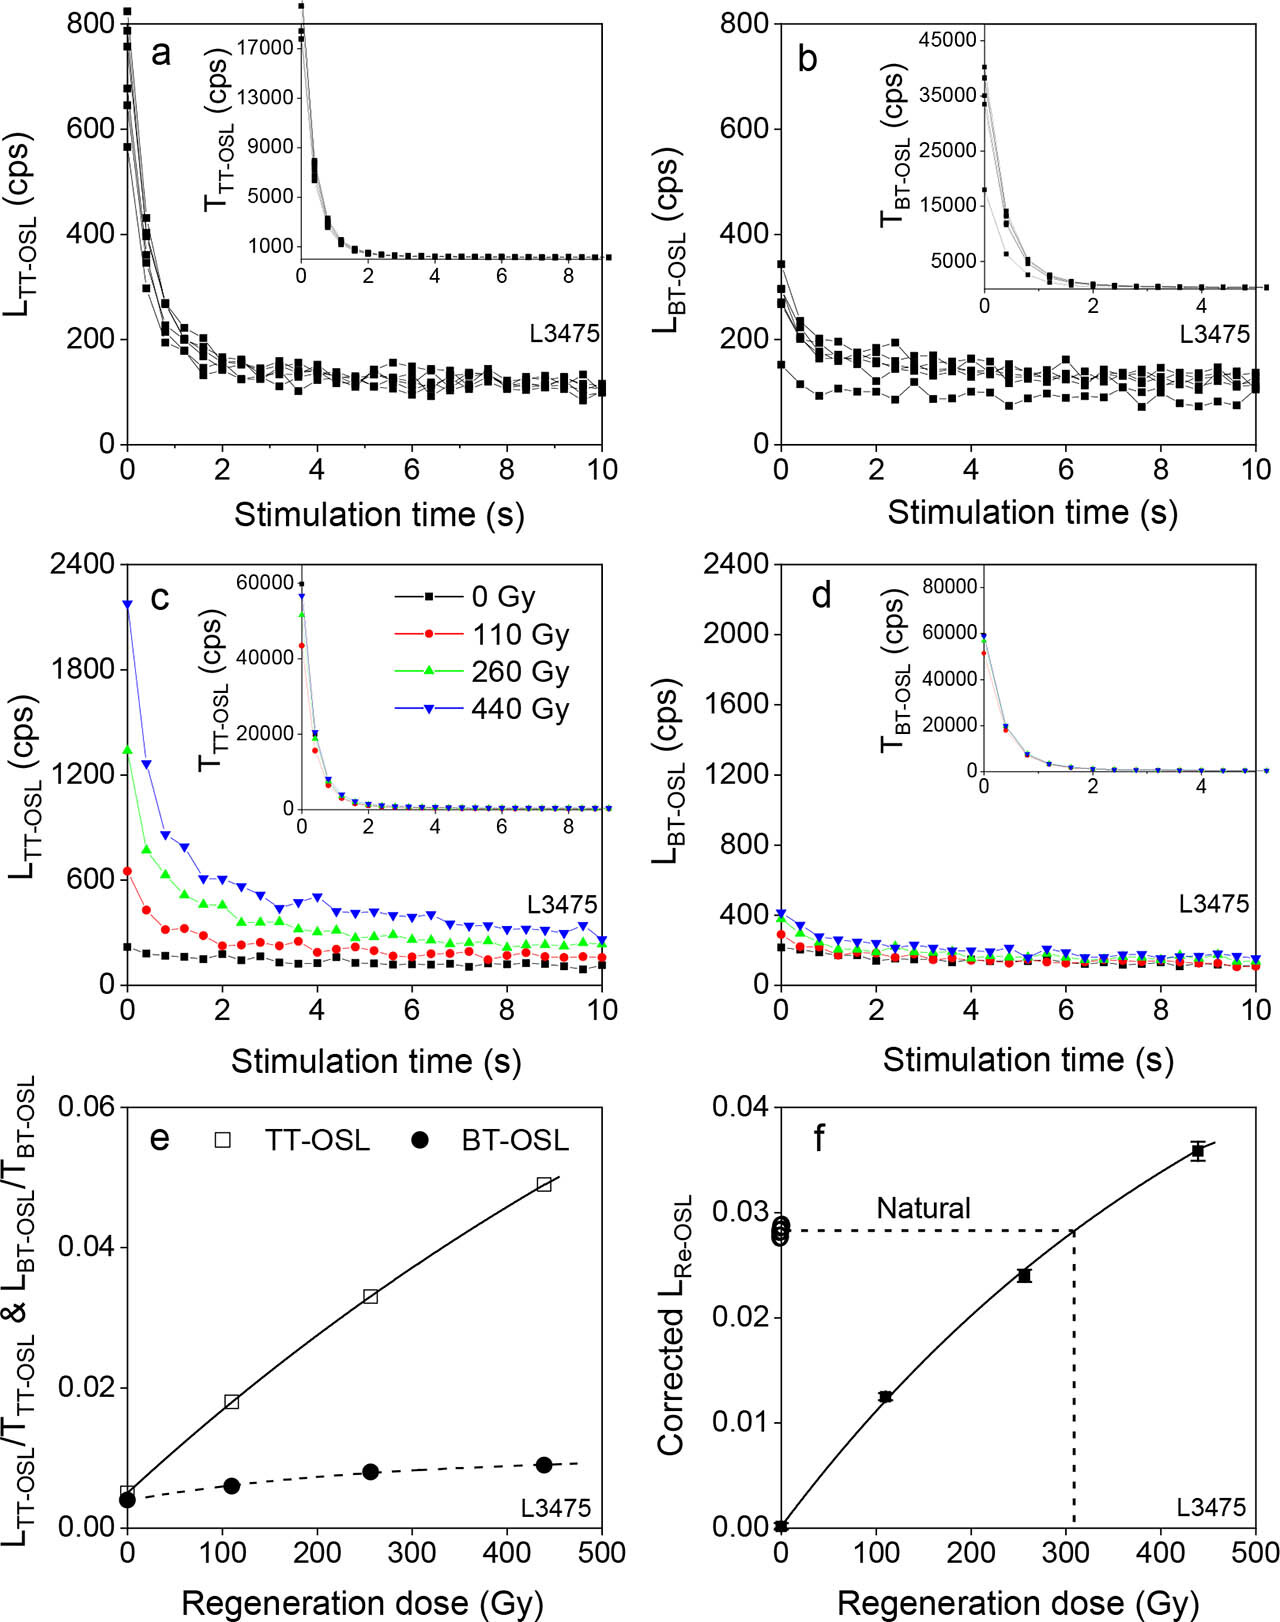
Examples of the decay curves of the natural TT-OSL (Fig. 5a) and BT-OSL (Fig. 5b) signals and the regeneration dose TT-OSL (Fig. 5c) and BT-OSL (Fig. 5d) signals are shown in Fig. 5. It is evident that there was a significant rise in the intensities of LTT-OSL with increasing doses, and this is not the case for LBT-OSL. The corrected recuperated intensity, LRe-OSL, was obtained by the equation (mentioned above). The corresponding DRCs and one of the LRe-OSL signals are shown in Fig. 5e and 5f, respectively, for which the recycling ratios fall into the acceptance range of 0.9–1.1, and recuperation is 1.01 ± 0.03. The DRC in Fig. 5f was fitted with a single saturating exponential, the De value obtained is much less than the D0 value of about 470 Gy for the curve. In order to determine the residual TT-OSL signal of the studied samples, the natural aliquots of sample L3481 were exposed to light from a solar simulator (SOL2, Hönle UVACUBE400) for 1 min, 9 h and 2 days, respectively, and then measured using the TT-OSL procedure in Table 1. Three aliquots were used for each bleaching time. The residual TT-OSL De values of 230.5 ± 10.1 Gy, 70.0 ± 5.7 Gy and 33.4 ± 1.6 Gy were obtained for the three bleaching times, respectively. The dose of 33.4 Gy was taken as a residual TT-OSL dose for subtraction for all samples.
Fig. 5
Decay curves of natural (a) thermally-transferred (TT) and (b) basic-transferred (BT) OSL, regenerative-dose (c) TT-OSL and (d) BT-OSL signals; dose-response curves for the sensitivity-corrected TT-OSL (square) and BT-OSL (solid circle) signals (e) and recuperated OSL (Re-OSL) signals (f). The insets in (a–d) showing the test-dose (18.3 Gy) OSL signals following natural and regenerative-dose OSL measurements.
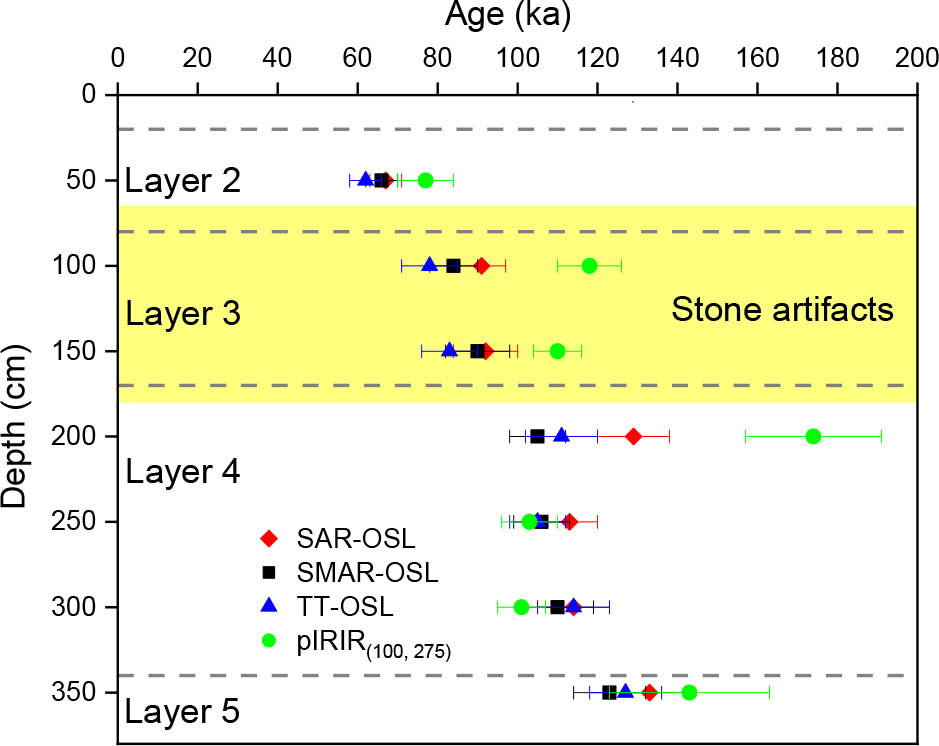
The dose rates and De values obtained using the above three procedures on fine-grained quartz are summarized and listed in Table 3. It shows that the calculated dose rates range from 4.3 to 3.5 Gy/ka, and the De values varying from about 269 to 460 Gy obtained using the three procedures. The ages were obtained by dividing the De values by the dose rates and listed in Table 3 and displayed in Fig. 6. The top sample (sample L3475) was dated to SAR-OSL 67 ± 4 ka, SMAR-OSL 66 ± 4 ka and TT-OSL 62 ± 4 ka, and the bottom sample (sample L3481) to SAR-OSL 133 ± 9 ka, SMAR-OSL 123 ± 9 ka and TT-OSL 127 ± 9 ka. The figure demonstrates that the SAR-OSL, SMAR-OSL and TT-OSL ages for each sample are consistent within errors except for sample L3478, and they are in stratigraphical order.
Table 3
The results of luminescence dating of fine-grained quartz using different procedures and fine polymineral grains using the pIRIR(100, 275) procedure.
| Lab No. | Layer | Depth (cm) | U (ppm) | Th (ppm) | K (%) | Water (%) | Cosmic dose rate (Gy/ka)a | Mineral | Number of Aliquotb | Method | Dose rate (Gy ka−1) | De (Gy) | Age (ka) |
|---|---|---|---|---|---|---|---|---|---|---|---|---|---|
| L3475 | 2 | 50 | 4.1 | 19.7 | 1.8 | 23.0 | 0.20 | Quartz | 9 | OSL-SAR | 4.3 ± 0.3 | 290.8 ± 7.3 | 67 ± 4 |
| 3(6) | OSL-SMAR | 283.1 ± 5.1 | 66 ± 4 | ||||||||||
| 6(6) | TT-OSL SAR | 268.9 ± 8.9 | 62 ± 4 | ||||||||||
| Polymineral | 3 | pIRIR(100, 275) | 5.1 ± 0.3 | 389.5 ± 27.8 | 77 ± 7 | ||||||||
| L3476 | 3 | 100 | 3.7 | 18.0 | 1.7 | 23.0 | 0.18 | Quartz | 9 | OSL-SAR | 4.0 ± 0.2 | 361.8 ± 9.6 | 91 ± 6 |
| 3(6) | OSL-SMAR | 334.7 ± 10.1 | 84 ± 6 | ||||||||||
| 6(6) | TT-OSL SAR | 307.5 ± 21.7 | 78 ± 7 | ||||||||||
| Polymineral | 3 | pIRIR(100, 275) | 4.6 ± 0.3 | 546.3 ± 24.4 | 118 ± 8 | ||||||||
| L3477 | 3 | 150 | 3.7 | 19.0 | 1.7 | 23.0 | 0.17 | Quartz | 9 | OSL-SAR | 4.0 ± 0.2 | 371.4 ± 21.0 | 92 ± 8 |
| 3(6) | OSL-SMAR | 364.4 ± 25.7 | 90 ± 8 | ||||||||||
| 6(6) | TT-OSL SAR | 334.0 ± 21.23 | 83 ± 7 | ||||||||||
| Polymineral | 3 | pIRIR(100, 275) | 4.7 ± 0.3 | 518.3 ± 7.2 | 110 ± 6 | ||||||||
| L3478 | 4 | 200 | 3.2 | 16.5 | 1.6 | 23.0 | 0.16 | Quartz | 9 | OSL-SAR | 3.6 ± 0.2 | 466.2 ± 18.3 | 129 ± 9 |
| 3(6) | OSL-SMAR | 380.4 ± 9.1 | 105 ± 7 | ||||||||||
| 6(6) | TT-OSL SAR | 400.1 ± 24.4 | 111 ± 9 | ||||||||||
| Polymineral | 4 | pIRIR(100, 275) | 4.2 ± 0.2 | 732.4 ± 60.8 | 174 ± 17 | ||||||||
| L3479 | 4 | 250 | 3.8 | 17.5 | 1.5 | 23.0 | 0.15 | Quartz | 9 | OSL-SAR | 3.8 ± 0.2 | 423.9 ± 7.6 | 113 ± 7 |
| 3(6) | OSL-SMAR | 398.1 ± 8.7 | 106 ± 7 | ||||||||||
| 6(6) | TT-OSL SAR | 396.8±5.3 | 105 ± 7 | ||||||||||
| Polymineral | 3 | pIRIR(100, 275) | 4.4 ± 0.3 | 458.0 ± 18.8 | 103 ± 7 | ||||||||
| L3480 | 4 | 300 | 4.0 | 19.3 | 1.4 | 23.0 | 0.14 | Quartz | 9 | OSL-SAR | 3.9 ± 0.3 | 442.3 ± 20.1 | 114 ± 9 |
| 3(6) | OSL-SMAR | 423.9 ± 21.9 | 110 ± 9 | ||||||||||
| 6(6) | TT-OSL SAR | 442.2 ± 20.1 | 114 ± 9 | ||||||||||
| Polymineral | 3 | pIRIR(100, 275) | 4.6 ± 0.3 | 465.2 ± 9.9 | 101 ± 6 | ||||||||
| L3481 | 5 | 350 | 3.6 | 16.7 | 1.3 | 23.0 | 0.13 | Quartz | 9 | OSL-SAR | 3.5 ± 0.2 | 459.6 ± 6.2 | 133 ± 9 |
| 3(6) | OSL-SMAR | 426.9 ± 17.4 | 123 ± 9 | ||||||||||
| 6(6) | TT-OSL SAR | 440.0 ± 9.5 | 127 ± 9 | ||||||||||
| Polymineral | 5 | pIRIR(100, 275) | 4.1 ± 0.2 | 586.6 ± 74.3 | 143 ± 20 | ||||||||
a Cosmic dose rates (Gy/ka) were calculated according to Prescott and Hutton (1994).
pIRIR ages of polymineral grains
All the samples show relatively dim IRSL, pIRIR and MET-pIRIR signals, and their natural intensities decrease as depth increases (Figs. 7–9). Note that the intensity of the natural IRSL signals measured at the sample temperature of 250°C are much larger than at lower temperatures (Fig. 7). Fig. 7 demonstrates that the MET-pIRIR signals are very dim and close to the noise background, and this is especially the case for the test dose (91.5 Gy) signals. The dim MET-pIRIR signals result in very large uncertainties in MET-pIRIR De values. In this case, the MET-pIRIR Des of the samples were not further determined.
Fig. 7
Decay curves of IRSL (50°C) and MET-pIRIR signals measured at different stimulation temperatures for a single polymineral aliquot of sample L3478.
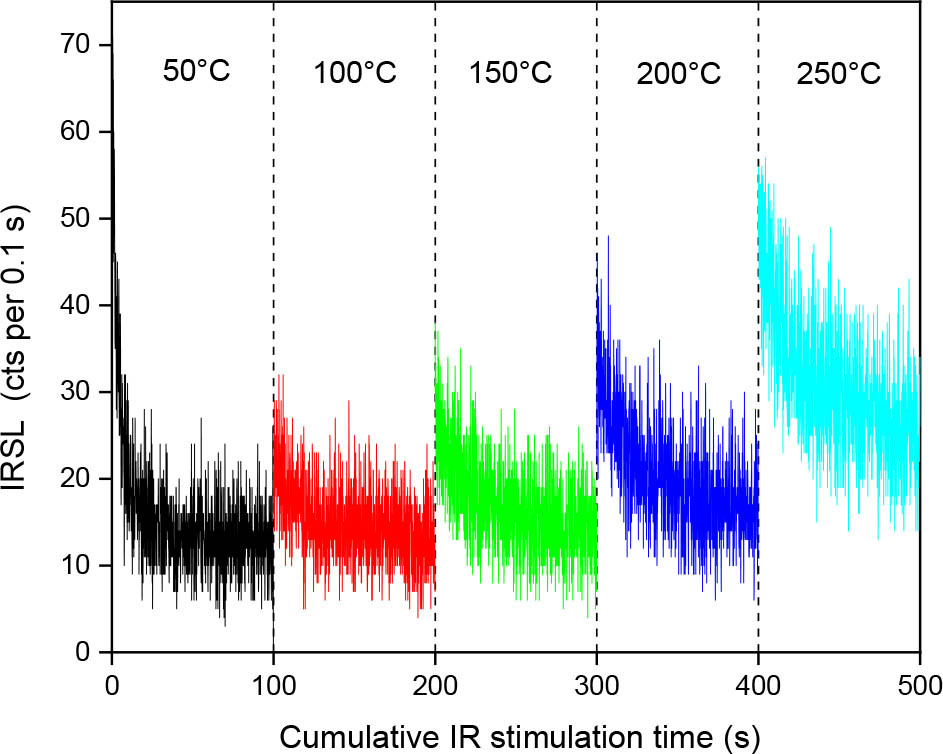
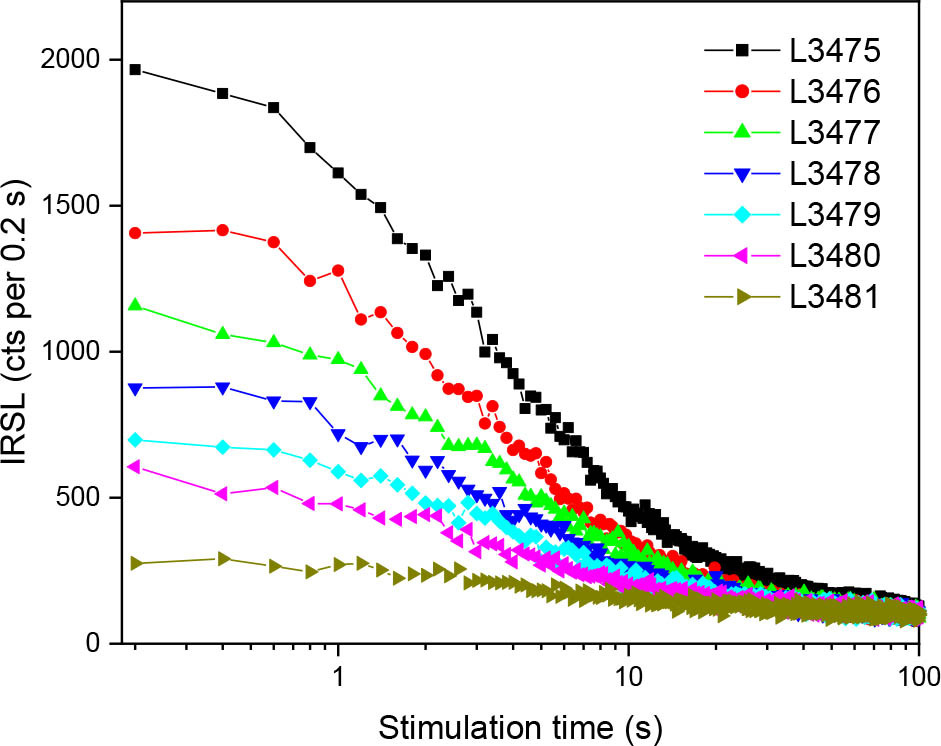
Fig. 9
Dose-response curves of pIRIR(100, 275) signals for single polymineral aliquots of the top sample (L3475, a) and the bottom sample (L3481, b). Insets show the natural decay curves for the two samples.
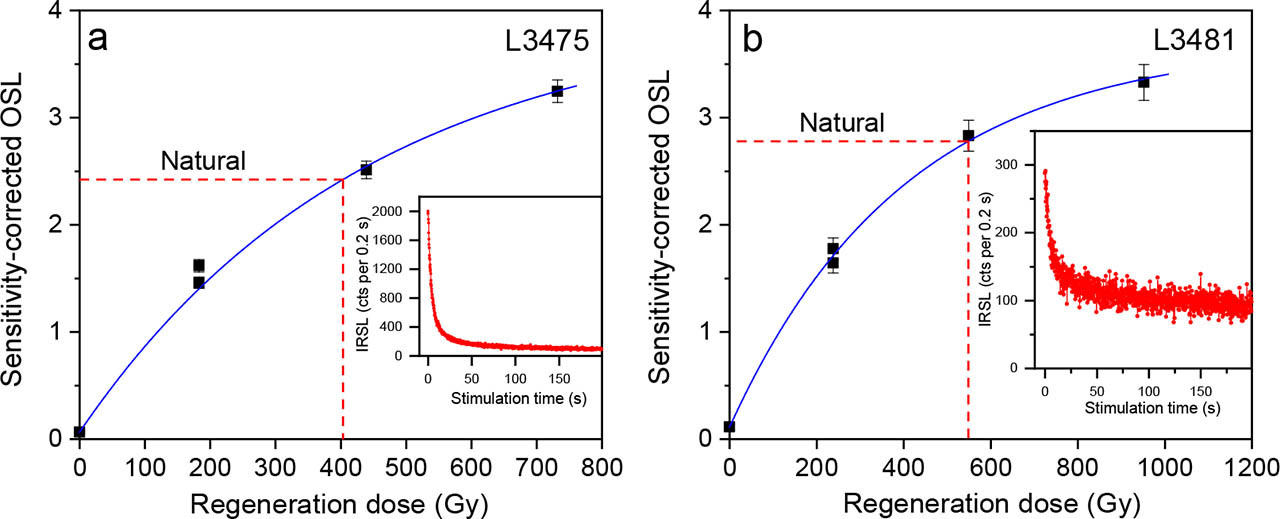
In the two-step pIRIR procedure (Table 2), the effect of the first IR stimulation temperature on pIRIR De values was tested using the temperatures of 50, 100, 150 and 200°C, respectively, and the results shown in Fig. 10 indicate that the pIRIR De values are independent of the first stimulation temperatures between 50 and 150°C, and the recycling ratios are close to unity and the recuperations less than 5%. Therefore, here the sample temperature of 100°C was used for the IRSL signal measurements before measuring the pIRIR signals at 275°C. Two pIRIR(100, 275) DRCs for the top sample (L3475) and the bottom sample (L3481) shown in Fig. 9 demonstrate that the two samples are very far from being naturally saturated as the D0 for samples L3475 and 3481 are 348 Gy and 402 Gy, respectively, and the recycling ratios are scattered but still close to unity. The pIRIR(100, 275) De values and ages obtained are summarized in Table 3 and the ages also shown in Fig. 6. The pIRIR(100, 275) ages obtained range from 77 ± 7 to 174 ± 17 ka, and they are not in strict stratigraphical order. The pIRIR(100, 275) ages of samples L3475, L3479, L3480 and L3481 are in agreement with their quartz OSL (SAR-, SMAR- and TTOSL) ages, if considering 2σ uncertainties. However, the pIRIR(100,275) ages of samples L3476, L3477 and L3478 are much larger than their corresponding quartz OSL ages. It is noted that the analysis of residual pIRIR(100, 275) dose and fading corrections have not been performed for these samples.
. DISCUSSION
The fine quartz extracts from the studied samples demonstrate excellent SAR or SMAR properties such as very bright, fast-dominated component, recycling ratios close to unity, recuperation less than 5% of the corrected natural signal and high saturation dose. The SAR-OSL and SMAR-OSL ages are in stratigraphical order except for the SAR-OSL age of sample L3478 at the depth of 200 cm. Note that although the quartz SAR-OSL De values of all samples are slightly larger than their SMAROSL De values, especially for sample L3478, the SAR- and SMAR-OSL De values are consistent when 2σ errors are considered. The slight difference between the SAR- and SMAR-OSL De values can be explained by the shapes of their DRCs in Fig. 2. This may imply that the quartz SAR-OSL De values of our samples were not underestimated due to the build-up of OSL signal during repeated SAR measurement cycles (Zhou and Shackleton, 2001; Lu et al., 2007). However, the large quartz SAROSL and SMAR-OSL De values ranging from 283 to 466 Gy (Table 3, Fig. 2) in the high dose range of quartz OSL may be problematic, resulting in underestimation of the true burial age (e.g. Lowick et al., 2015; Timar-Gabor et al., 2017), although some samples yielded reliable quartz SAR-OSL ages with the De values of up to 600 Gy, (e.g. Murray et al., 2008; Zhang et al., 2015; Buechi et al., 2017). Here, the reliability of the quartz SAR- and SMAR-OSL ages obtained were tested using the TT-OSL SAR procedure on quartz and the two-step pIRIR and MET-pIRIR procedures on fine polymineral grains, which can potentially extend the age range because TTOSL and pIRIR signals have very high saturation levels (see reviews by Duller and Wintle, 2012, Li et al., 2014, Arnold et al., 2015).
TT-OSL signals were considered to be optically bleached at a much slower rate than the fast component OSL signal (Duller and Wintle, 2012), as demonstrated by the results of bleaching experiments on quartz grains with different origins and the TT-OSL De values of modern analogues (Tsukamoto et al., 2008; Kim et al., 2009; Athanassas and Zacharias, 2010; Hu et al., 2010; Jacobs et al., 2011; Hernandez et al., 2012; Arnold et al., 2019). The bleaching experiment on a sample in this study shows that the TT-OSL signal was reduced to 50% (equivalent to the De value of 230.5 Gy) of its initial value after 1 min bleaching, and 7% (33.4 Gy) after two days of bleaching. Compared with the results of the previous bleaching experiments mentioned above, we considered that the TT-OSL signals from our samples are relatively easily bleached. This is also supported by the fact that the TT-OSL, SAR-OSL and SMAR-OSL De values or ages for each sample are almost identical (Table 3, Fig. 6).
Although residual pIRIR(100, 275) doses have not been determined and fading corrections have not been done, their influence on pIRIR(100, 275) De values for these old samples are negligible (Li et al., 2014). The stratigraphic inconsistency of the pIRIR(100, 275) ages and the relationship between polymineral pIRIR(100, 275) and quartz OSL ages imply that the pIRIR(100, 275) ages may generally be problematic, this is especially the case for samples L3479 at 250 cm depth and L3480 at 300 cm depth, whose pIRIR(100, 275) ages are younger than the overlying samples (L3476, L3477 and L3478). This may be due to the lower samples are too old (>400 Gy), resulting in underestimation of the pIRIR age (Li and Li, 2012b). Relatively, sample L3476, L3477 and L3478 yielded much larger pIRIR(100, 275) ages compared to the corresponding quartz OSL ages. This is similar to the situation for the samples from the nearby Fengshuzui site (Zhang et al., 2018), where the dim feldspar signal due to the chemical weathering of the sediments was shown to yield 35–55% older ages than those based on the quartz SAR protocol (Huang et al., 2019). In this case, we deduce that the true burial ages of the upper samples (L3475–3478) are between the quartz OSL ages and the feldspar pIRIR(100, 275) ages.
As stated above, the stone artefacts were mainly excavated mainly from deposits between the lower part of Layer 2 and the upper part of Layer 4 (Figs. 1b and 6), from which samples L3476 and L3477 were collected and optically dated. Their SAR-, SMAR- and TT-OSL ages are indistinguishable when errors are considered, and their average value is 86 ± 9 ka, while the average of the two pIRIR(100, 275) ages is 114 ± 10 ka. These dates bracket the age of the cultural layers. This indicates that this region was occupied by hominins during the marine isotope stage 5.
. CONCLUSIONS
The Huxushan Paleolithic site in south China was optically dated using various methods, including OSL-SAR, OSL-SMAR and TT-OSL SAR procedures on fine quartz grains and two-step pIRIR(100, 275) and MET-pIRIR procedures on fine polymineral fractions of seven samples from the site. The fine-grained quartz demonstrated excellent luminescence properties, and the SAR-OSL, SMAR-OSL and TT-OSL ages of the studied samples agree with each other and are in stratigraphical order except for one sample. This good internal consistency would indicate that the quartz OSL ages obtained for the samples are reliable. However, the fine polymineral fractions which exhibited dim pIRIR and MET-pIRIR signals yielded older ages for the layer with stone tools. The MET-pIRIR signals are too weak to yield De values with useful precision. Although the pIRIR(100, 275) ages obtained for the studied samples are stratigraphically inconsistent, the older ages for the two samples from the cultural layer compared to those derived from quartz SAR OSL protocol are considered to represent the upper age limit of the stone tools. The quartz OSL ages obtained using different procedures for the two samples range from 78 to 92 ka, they are considered as the minimum age of the cultural layer. The site was deduced to be occupied by hominins during the marine isotope stage 5.