
. INTRODUCTION
Feldspar infrared-stimulated luminescence (IRSL) and post-IR IRSL (pIRIR) are widely used for burial or depositional dating, in addition to quartz optically stimulated luminescence (OSL) (Thomsen et al., 2008; Buylaert et al., 2009, 2012). The dating protocols for feldspars are generally more complicated than those for quartz, but due to their higher level of signal saturation, they are applicable to older deposits than quartz OSL dating. Feldspars are also used as a dosimeter in cases where quartz OSL has properties unfavourable for dating (e.g., Preusser et al., 2014).
The prominent disadvantage of feldspar IRSL and pIRIR is, as well as anomalous fading (Li et al., 2014), the lower rate of sunlight bleaching compared to quartz, which likely results in residual dose and age overestimations. The residual dose tends to be higher at higher measurement temperature and after higher preheat (Madsen et al., 2011; Reimann and Tsukamoto, 2012; Fu and Li, 2013) and varies among samples (Li et al., 2013) and sedimentary environments. Estimation of the residual dose is crucial for accurate feldspar dating and has been attempted by means of measurements of modern samples (e.g., Buylaert et al., 2011; Brill et al., 2018; Li et al., 2018a), comparisons with other age estimates such as radiocarbon dating and quartz OSL (e.g., Li et al., 2018b), and measurements of artificially bleached samples (e.g., Buylaert et al., 2013). Case studies of such estimates are, however, limited compared with the variations of depositional environments that may greatly affect the residual dose, hindering the reliable application of feldspar IRSL and pIRIR dating.
Late Quaternary shallow-marine deposits are important components of continental margin geology. Glacial sea-level cycles have resulted in depositional sequences that provide archives of long-term environmental changes and tectonic histories (e.g., Murray-Wallace, 2002). Absolute dating of Middle to Late Pleistocene siliciclastic depositional systems is highly reliant on feldspar pIRIR dating because these deposits contain no material suitable for U/Th dating, and in many cases, are older than the applicable range of quartz OSL and radio-carbon dating. However, bleaching of luminescence signals in shallow-marine environments does not always occur because seawater strongly absorbs the ultraviolet component of sunlight (e.g., Rink and Pieper, 2001). Some previous studies of modern and Holocene sediments have empirically determined the degree of bleaching or the residual dose of quartz and feldspar luminescence in coastal shallow-marine settings (e.g., Roberts and Plater, 2007; Sugisaki et al., 2015; Chamberlain et al., 2017; Li et al., 2018b; Nian et al., 2018), but further efforts should be made to understand the variations related to a range of coastal systems.
We report the residual dose of IRSL and pIRIR at different temperatures observed for K-feldspar sand from the beach and shoreface on the Kujukuri coast, eastern Japan. Both modern and Holocene samples, which are compared with radiocarbon dating, were used to quantify the residual dose and examine the variation and trend within the coastal system. These results are useful for assessing the potential age overestimation from K-feldspar dating and for selecting the best signal to date Holocene and Pleistocene sediments, which especially promotes accurate dating of a thick forearc basin fill that accumulated since the Middle Pleistocene in the region.
. STUDY AREA
The Kujukuri coast is part of the Pacific coast of the Boso Peninsula, eastern Japan (Fig. 1A). The area is a microtidal and open-ocean coast characterized by an arcuate 60-km-long sandy beach, shoreface, and shelf, bounded by headlands of Plio-Pleistocene sedimentary rocks to the northeast and southwest (Tamura et al., 2008a). The tidal range is, on average, 107 cm, with a maximum value of 178 cm during the spring tide (Tamura et al., 2008b). The mean significant wave height at the central Kujukuri coast is 1.0 m, with a wave period of 7.9 s (Nagai, 2002). During storm conditions, which occur several times per year, the hourly significant wave height exceeds 4 m and the typical wave period is 12 s (Tamura et al., 2008a). The shoreface has multiple longshore bars at water depths of 0–6 m, and its average gradient is 1/150 at 0–5 m deep and 1/200 at 5–15 m deep.
Fig. 1
A) Location map of the study area and plate boundaries between the Eurasian (EUR), Okhotsk (OKH), Philippine Sea (PHS), and Pacific Ocean (PAC) plates. B) Morpho-sedimentary map of the Kujukuri beach-ridge plain and offshore showing the locations of modern samples and drill cores (modified from Tamura et al., 2008b). Five modern samples (Katakai, BS9, 10, 23, and 34) and two drill cores (GS-QYH-1 and GS-QAS-2) were used for the analysis. The red line shows the location of the cross section in Fig. 2. The definition of beach-ridge groups I–III is after Moriwaki (1979) and their formative durations were determined based on radiocarbon chronology in a cross section near the Makame and Sakuta rivers (Masuda et al., 2001b; Tamura et al., 2007).
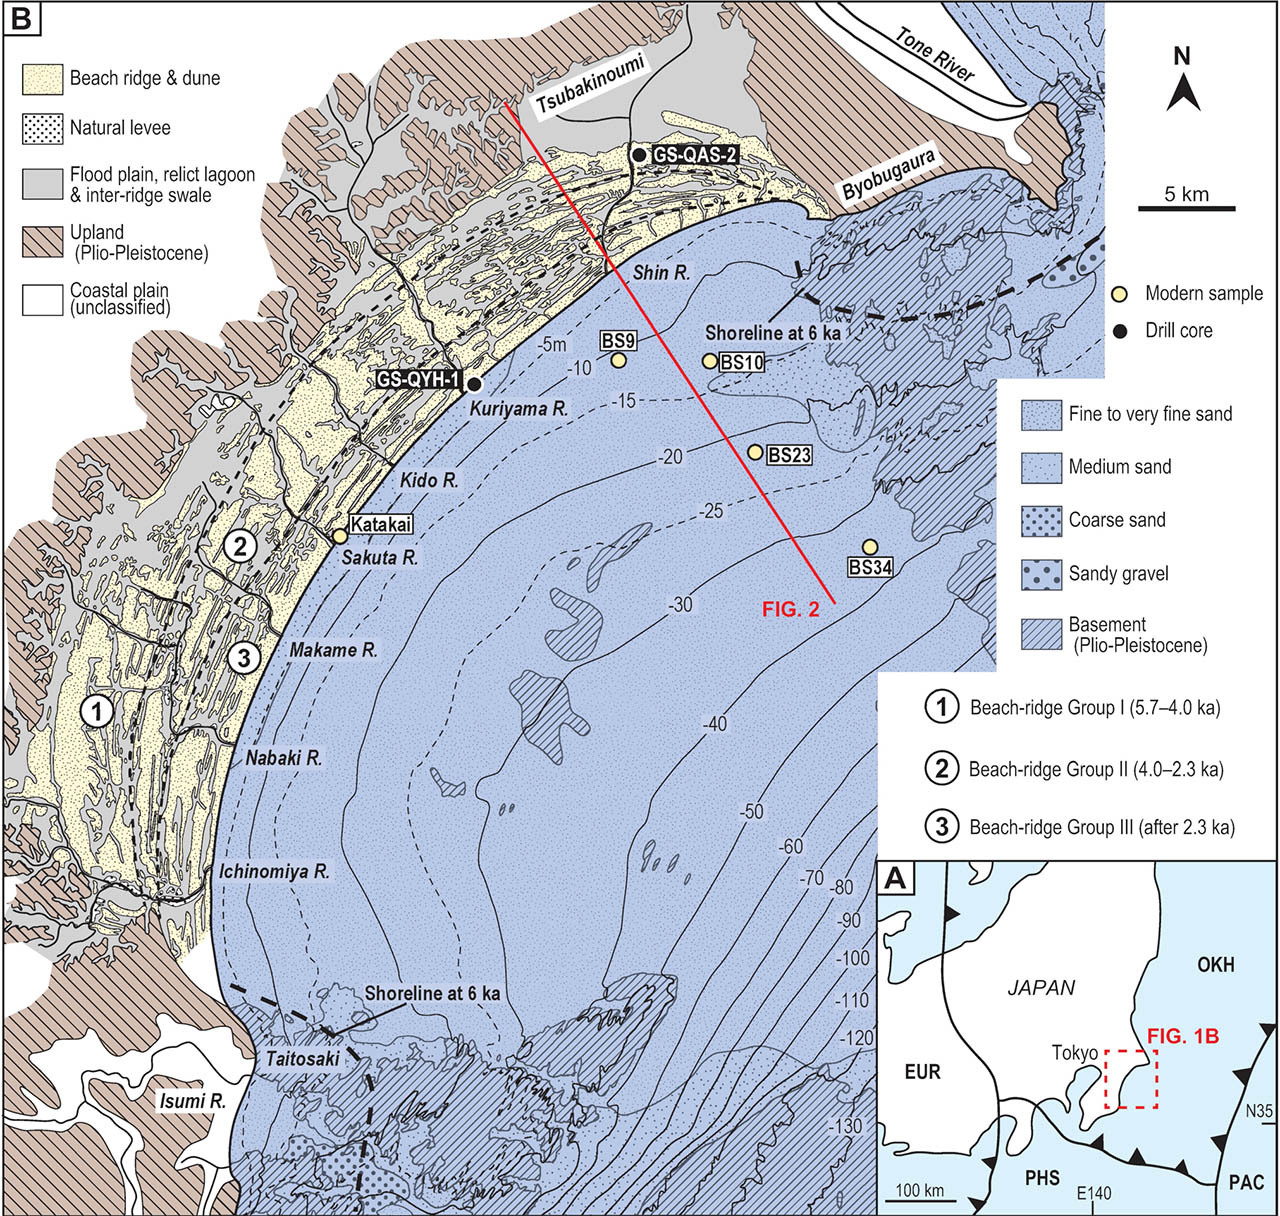
An extensive beach-ridge plain is developed behind the Kujukuri coast. The landward margin of this plain is defined by plateaus and hills 30–120 m above sea level, and the surface of the plateaus corresponds to a raised marine terrace of the Last Interglacial Period (Figs. 1B and 2; Unozawa et al., 1983). The margin of the plain coincided with the shoreline at ca. 6 ka (Moriwaki, 1979; Masuda et al., 2001a) when the post-glacial transgression culminated (Fig. 2). Since then, the shoreline has pro-graded, producing the present sequence of beach ridges that are 10 km wide at their widest point. Seven small rivers discharge into the sea through the beach-ridge plain but supply a limited amount of sediment to the coast. Instead, the rapid retreat of headlands at Byobugaura and Taitosaki (Fig. 1B) has created the sediment supply for the coastal progradation (Uda, 1989). Three beach-ridge assemblages are defined, which are referred to as groups I to III from land to sea. Detailed radiocarbon dating of the beach deposits clarified that beach-ridge groups I, II, and III formed at 5.7–4.0, 4.0–2.3, and after 2.3 ka, respectively (Masuda et al., 2001b). At the northern end of the beach-ridge plain, a 10-km-wide relict lagoon forms a depression between the innermost beach ridge and the plateau (Fig. 1B).
Fig. 2
Cross section across the Kujukuri beach-ridge plain and offshore area (see location in Fig. 1b). The positions of the two drill cores and five modern sediment samples analyzed herein were projected onto a single section. Six samples were taken for analysis from each drill core. Radiocarbon dates of molluscan shells and a plant fragment are shown beside the columns of the cores. Dashed lines indicate the isochrones of the beach-ridge group boundary. The stratigraphic outline was defined on the basis of drill cores and compilations of previous studies in the central part of the plain (e.g., Tamura et al., 2003, 2007, 2008a, 2008b). FS: foreshore and backshore facies; US: upper shoreface facies; LS: lower shoreface facies; T.P.: Tokyo Peil, the standard datum for elevation measurements in Japan.
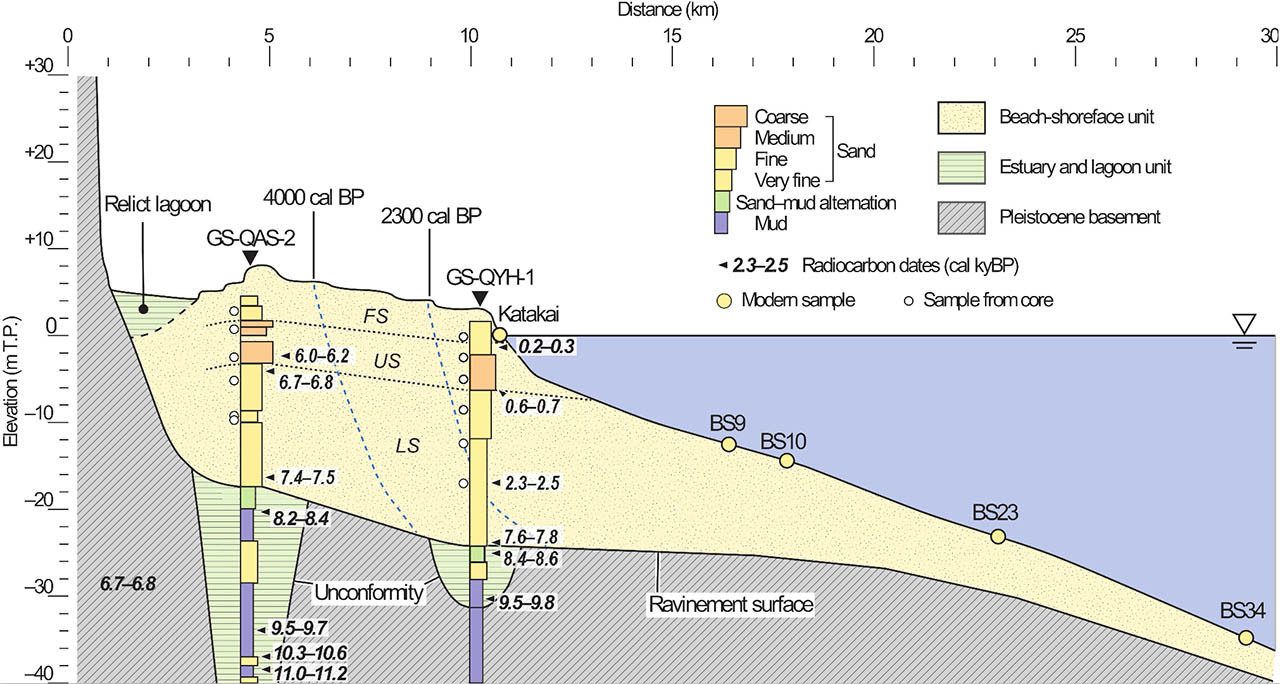
The subsurface stratigraphy of the central part of the beach-ridge plain is constrained by a series of sediment cores and radiocarbon chronology; a 20-m-thick sandy body was deposited as part of the progradation of the beach–shoreface system, as can be observed in the present nearshore area, since 6 ka (Tamura et al., 2003, 2007, 2008a, 2008b). The presence of a raised Pleistocene marine terrace nearby demonstrates that the Kujukuri coast has been uplifted. Masuda et al. (2001b) recognized a total sea-level fall of 5 m since 5.7 ka on the basis of the elevations of foreshore facies in the central coast; this sea-level fall was induced by a combination of tectonic uplift and hydro-isostasy (Nakada et al., 1991). The longshore variation of the foreshore facies elevation indicates an increase in the uplift rate towards the southern end of the coast (Tamura et al., 2010).
. SAMPLES AND METHODS
Modern samples
Sand samples for luminescence measurements were collected from the modern and Holocene beach and shoreface of the Kujukuri coast (Fig. 1B; Tables 1 and 2). A modern foreshore sample (gsj15160) was taken from the 5-cm-thick surface layer at Katakai, in the central part of the coast, using a light-tight plastic tube (Table 1). Four modern shoreface samples (gsj17282, 17283, 17284, and 17273) were scooped by the Smith–McIntyre sediment grab during a research cruise in August and September 2014 (Nishida et al., 2019). Plastic tubes >5 cm thick were hammered into the bulk sediment in the grab to collect light-unexposed sediments, which were transported to the laboratory.
Table 1
Details of modern samples. Equivalent doses (De) were determined from IR50, pIRIR150, and pIRIR290.
Table 2
Details of Holocene samples taken from drill cores: sample level, water, U, Th, K, and Rb contents, estimated dose rates, and expected ages from radiocarbon dates. The internal dose rate was estimated to be 0.738±0.123 Gy/ka for all samples.
Holocene samples
Two sediment cores (GS-QAS-2 and GS-QYH-1) were drilled in the northeastern part of the Kujukuri beach-ridge plain in 2015 (Table 2; Komatsubara, 2019). Cores GS-QAS-2 and GS-QYH-1 contained subsurface sediment successions representative of the landward and seaward parts of the prograded beach-ridge plains, respectively; both cores include the lower unit, consisting of the transgressive estuary and lagoon deposits in an incised valley, and the upper unit, containing regressive beach–shoreface deposits.
The upper unit of core GS-QAS-2 overlies and exhibits a gradual boundary with the incised-valley deposits at approximately 22.5 m depth and contains a succession of lower shoreface, upper shoreface, and foreshore and backshore facies, in ascending order. The lower shoreface facies occurs in the depth interval 8.2–22.5 m and consists of horizontally to low-angle cross-laminated very fine to fine sand. The upper shoreface facies is high-angle cross-laminated fine to very coarse sand in the depth range of 3.3–8.2 m. The foreshore and backshore facies is observed at 1.7–3.3 m depth and is characterized by horizontally laminated fine to medium sand with concentrations of heavy minerals. The upper unit of core GS-QYH-1, similarly to GS-QAS-2, consists of the lower shoreface (8.4–26.1 m depth), upper shoreface (3.0–8.4 m depth), and foreshore and backshore facies (0.5–3.0 m depth).
Six sand samples were taken from the upper units of each of the cores GS-QAS-2 and GS-QYH-1 (Table 2), yielding a total of 12 samples for OSL dating. Shell-rich layers were avoided in sampling to minimize the potential inaccuracy in dose-rate determination caused by the heterogeneous distribution of radionuclides in the sediment (e.g., Cunningham et al., 2019).
Radiocarbon dating
Accelerator mass spectrometry radiocarbon dating of shells and plant fragments from the sediment cores was performed by the Institute of Accelerator Analysis Ltd. (Kawasaki City, Japan) to establish an independent chronology for comparison with the OSL dating results (Table 3). Six intact shells and one plant fragment sample were dated for core GS-QAS-2, and six intact shells were analyzed for core GS-QYH-1. The ages obtained were converted into calendar ages by the program CALIB rev. 7.1.0 (Stuiver and Reimer, 1993) using the data set MARINE13 with a delta R of 0 years for the shell samples and INTCAL13 for the plant fragment sample (Reimer et al., 2013).
Table 3
Radiocarbon dating results for drill core samples.
The radiocarbon ages are consistent with the stratigraphy in both cores (Figs. 2 and 3). In the lower unit of core GS-QAS-2, four samples were dated between 10,878–10,933 cal BP and 8,224–8,388 cal BP, supporting the interpretation of transgressive deposition. Likewise, two radiocarbon ages from the lower unit of GS-QYH-1 indicate the occurrence of transgressive deposition. Three ages from the upper unit of GS-QAS-2 range from 7,411–7,540 to 6,019–6,239 cal BP, corresponding to the initial regressive phase. The upper unit of GS-QYH-1 was dated as Late Holocene. Cores GS-QAS-2 and GS-QYH-1 thus represent the middle and late Holocene regressive succession of a prograding beach–shoreface deposit (Fig. 2).
Fig. 3
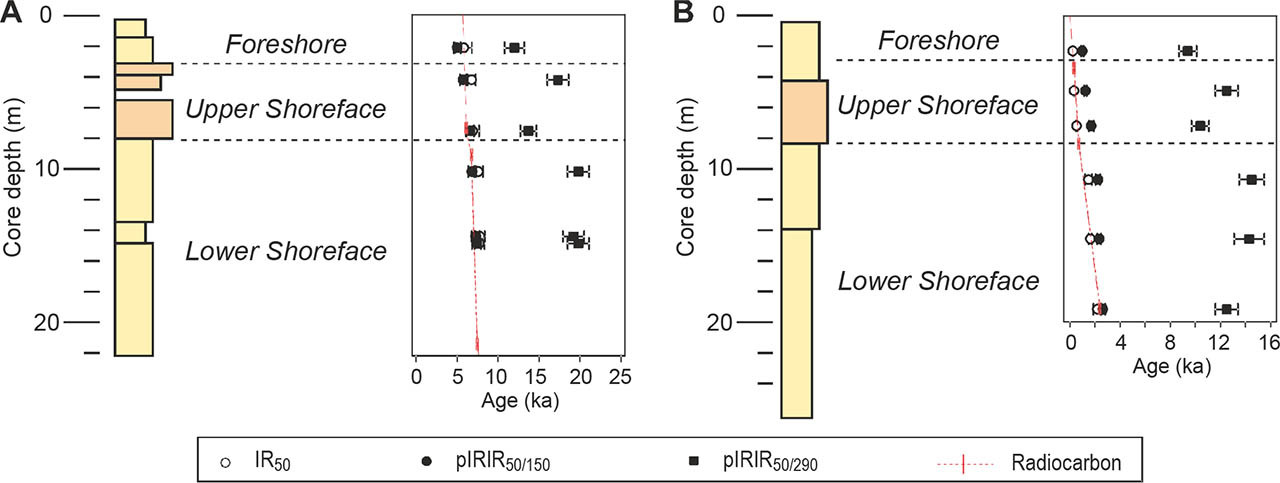
Fading-corrected final luminescence age estimates of samples taken from (A) core GS-QAS-2 and (B) core GS-QYH-1. Radiocarbon ages of molluscan shells are also shown for comparison. Radiocarbon ages at the ground surface were assumed to be 5.7 ka and 0 ka for cores GS-QAS-2 and GS-QYH-1, respectively, to define the expected ages (red lines).
Radiocarbon ages were used to define the expected ages of the Holocene samples taken from the cores (Table 2). The expected age of an OSL sample was obtained by linear interpolation of the intercepts of 2σ radiocarbon ages just above and below the sample and was associated with the mean uncertainties of the 2σ radio-carbon ages. For interpolation above the uppermost radiocarbon age, the dates of the tops of cores GS-QAS-2 and QYH-1 were assumed to be 5.7 ka and 0 ka, respectively.
Luminescence dating
Sample preparation and luminescence measurements were performed at the luminescence laboratory of the Geological Survey of Japan. Samples taken from drill cores were split into two, with one part used for luminescence measurements and the other for dosimetry; the modern samples were exclusively used for luminescence measurements. Samples for luminescence measurements were processed under subdued red light to avoid depletion of the luminescence signal. They were dried, sieved to extract grains 180–250 μm in diameter, and then treated with hydrochloric acid and hydrogen peroxide to remove carbonate and organic matter. Quartz and feldspar grains were then separated using sodium polytungstate liquids of densities 2.70, 2.58, and 2.53 g/cm3. The 2.53–2.58 g/cm3 fraction was taken as K-feldspar. Quartz samples were purified by etching the 2.58–2.70 g/cm3 fraction in 40% hydrofluoric acid for 1 h, followed by hydrochloric acid treatment for 1 h. Grains were mounted on stainless steel disks to form large (6 mm diameter) aliquots for luminescence measurement. Measurements were performed with a TL-DA-20 automated Risø TL/OSL reader equipped with blue and infrared LEDs centred on wavelengths of 470 and 970 nm, respectively, for stimulation and a 90Sr/90Y beta source for laboratory irradiation. For stimulation by blue and infrared LEDs, emitted luminescence through a Hoya U-340 filter and a combination of Schott BG3 (3 mm thick), BG39 (2 mm), and GG400 (3 mm) filters was measured with a photo-multiplier tube. Preliminary measurements showed that natural quartz OSL signals are dominated by the medium component and not appropriate for dating, as is also the case for other quartz sands in Japan (e.g., Tsukamoto et al., 2003; Tokuyasu et al., 2010; Tamura et al., 2015, 2017; Riedsel et al., 2018); therefore, only the IRSL and pIRIR signals of the K-feldspar grains were further investigated.
The modified single-aliquot regenerative dose protocols of pIRIR measured at 150°C and 290°C after a prior IRSL at 50°C (referred to here as pIRIR150 and pIRIR290, respectively; Table 4; Thomsen et al., 2008; Buylaert et al., 2009, 2012; Reimann and Tsukamoto, 2012) were applied to the K-feldspar grains. The prior IRSL signal in the pIRIR150 protocol was also investigated and is referred to here as IR50. In the pIRIR150 protocol, the IR50 and pIRIR150 signals were sampled every 0.1 s for 100 s, and the net signal was derived from the integral of the first 2.0 s of the signal after subtracting the background estimated from the last 20 s of the signal. The pIRIR290 signal was sampled every 0.1 s for 200 s with signal and subtraction integration intervals of the first 2.0 s and last 20 s, respectively. Preheat temperatures were fixed at 180°C for 60 s for pIRIR150 and 320°C for 60 s for pIRIR290. Bleaching experiments and dose recovery tests were practised for sample gsj15151. Six aliquots for each protocol were exposed to artificial sunlight for 4 h in a UVACUBE 400 chamber (Hönle) with an SOL 500 lamp module. After bleaching, three aliquots were dosed by 24 Gy for pIRIR150 and by 72 Gy for pIRIR290, and then used for a dose recovery test; the remaining aliquots were used to estimate the residual dose. Dose recovery was assessed after subtracting the residual dose from the recovered dose. IR50, pIRIR150, and pIRIR290 yielded recovery ratios of 0.97±0.01, 0.96±0.02, and 1.17±0.08, respectively. The residual doses observed in the bleaching test were 0.31±0.09, 1.51±0.17, and 13.66±1.10 Gy for IR50, pIRIR150, and pIRIR290, respectively. The mean value of the equivalent dose was determined from measurements of six replicates per sample by applying the Central Age Model of Galbraith et al. (1999). For all samples except gsj15151, 15155, 15157, and 15158, fading tests were also performed on aliquots after equivalent dose measurement to determine fading rates (expressed as the g2days-value) following the method of Auclair et al. (2003).
Table 4
Summaries of the IR50, pIRIR150, and pIRIR290 single-aliquot regenerative dose protocols used in this study.
For drill core samples, the environmental dose rate was determined using the DRAC program of Durcan et al. (2015) based on the contributions of both natural radioisotopes and cosmic radiation (Table 2). The concentrations of K and U were measured by inductively coupled plasma optical emission spectrometry and those of Th and Rb by inductively coupled plasma mass spectrometry; both sets of results were converted to dose rates by applying to the conversion factors of Adamiec and Aitken (1998). The attenuation factors used for beta and alpha rays were based on Mejdahl (1979) and Bell (1980), respectively. We used an a-value of 0.15±0.05 (Balescu and Lamothe, 1994). The a-values for IRSL and pIRIR signals are generally considered variable (e.g., Kreutzer et al., 2014); however, potential uncertainties in total dose rate related to the a-value are not significant (less than a few per cent), and thus we assume an identical a-value for IRSL and pIRIR. The internal K content of K-feldspar was assumed to be 12.5±0.5% (Huntley and Baril, 1997). The water content was also considered for the dose rate determination based on the measured value with an error of 5%. The cosmic dose rate was estimated based on Prescott and Hutton (1994) assuming overburden with a density of 1.8 g/cm3. The mean equivalent dose values were divided by the environmental dose rate to obtain fading-uncorrected ages. Mean g-values determined from six aliquots per sample and their standard errors for each signal were used for fading corrections of uncorrected ages based on Huntley and Lamothe (2001) and using the R Luminescence Package (Kreutzer et al., 2012; Fuchs et al., 2015). For correction of the four samples on which no fading test was performed, the average of the rest of the samples was applied. All dates are expressed relative to AD 2015.
. RESULTS
Modern samples
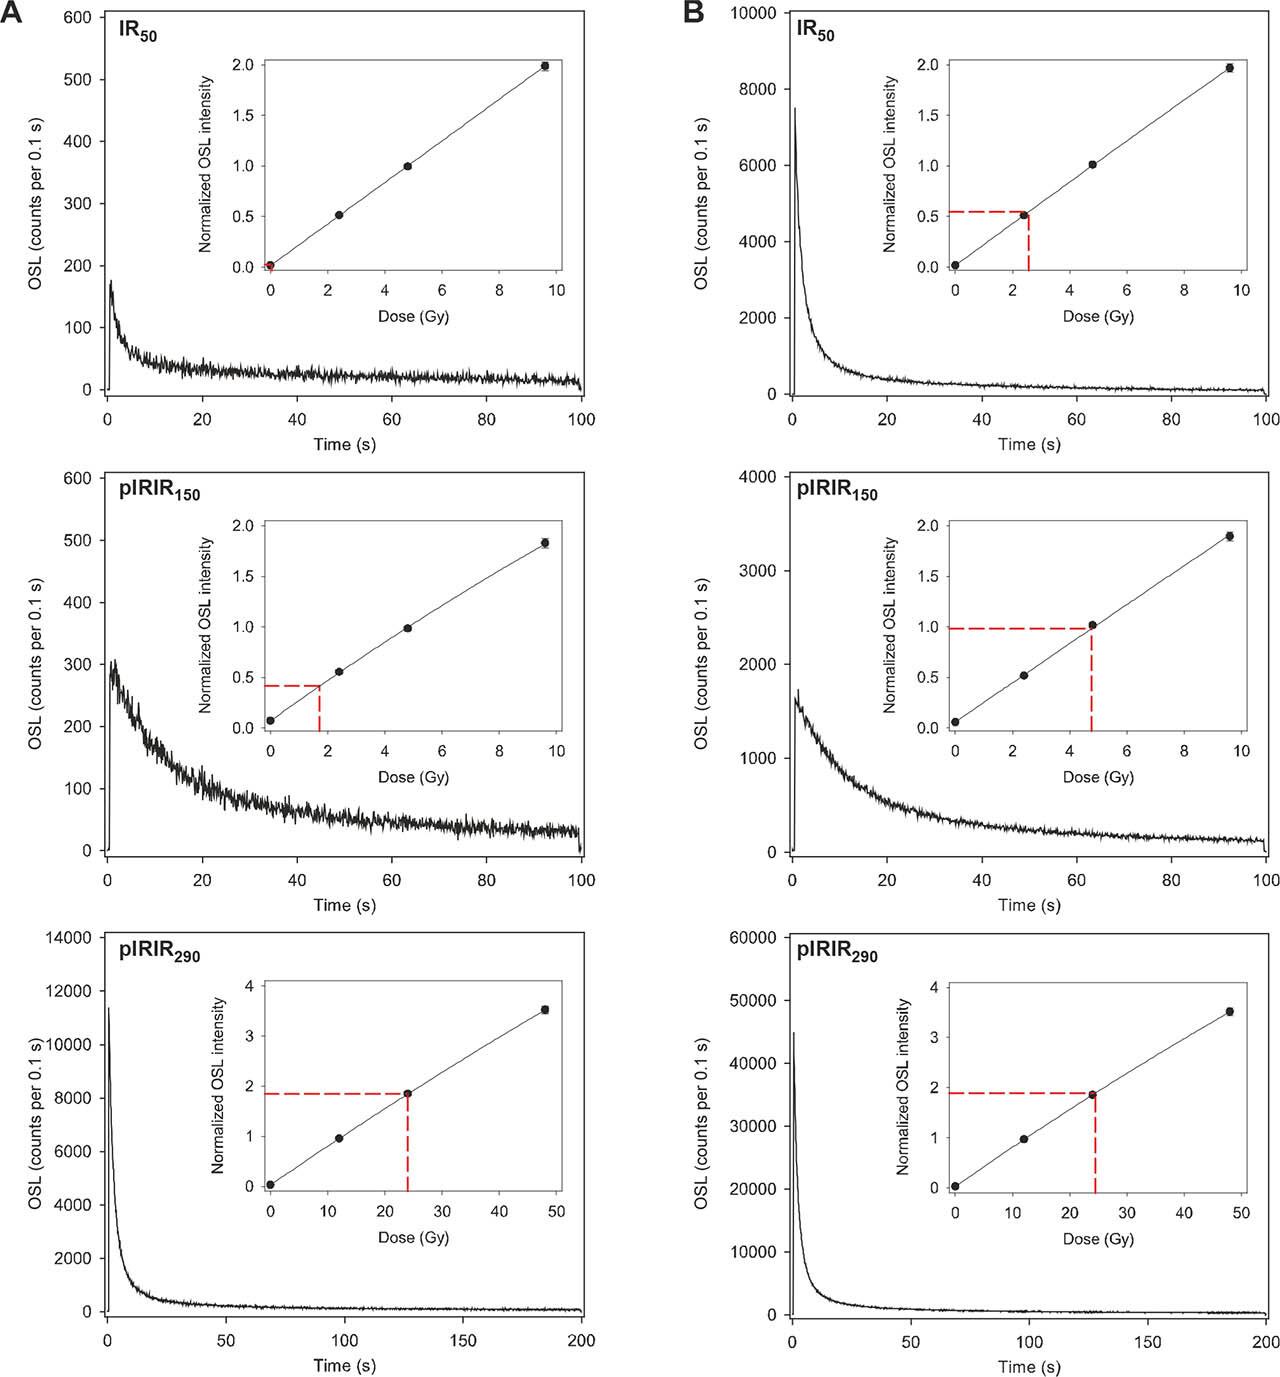
In all modern samples, a bright natural pIRIR290 signal was observed, whereas the IR50 and pIRIR150 signals were generally weak compared to the pIRIR290 signal (Fig. 4A). Nevertheless, a dose–response curve was well defined for each signal, from which the equivalent dose was estimated. Equivalent doses of IR50 were <0.1 Gy except for sample gsj17284, taken at a water depth of 23 m, which retains a residual dose of 0.18±0.01 Gy. The pIRIR150 signal yielded higher residual doses than the IR50, ranging from 0.93 to 3.25 Gy. The residual doses of pIRIR290 were much higher than pIRIR150: they were 11.93±1.66 Gy for the foreshore sample (gsj15160) at Katakai and 23–30 Gy for other subtidal samples.
Equivalent dose and burial age estimate of Holocene samples
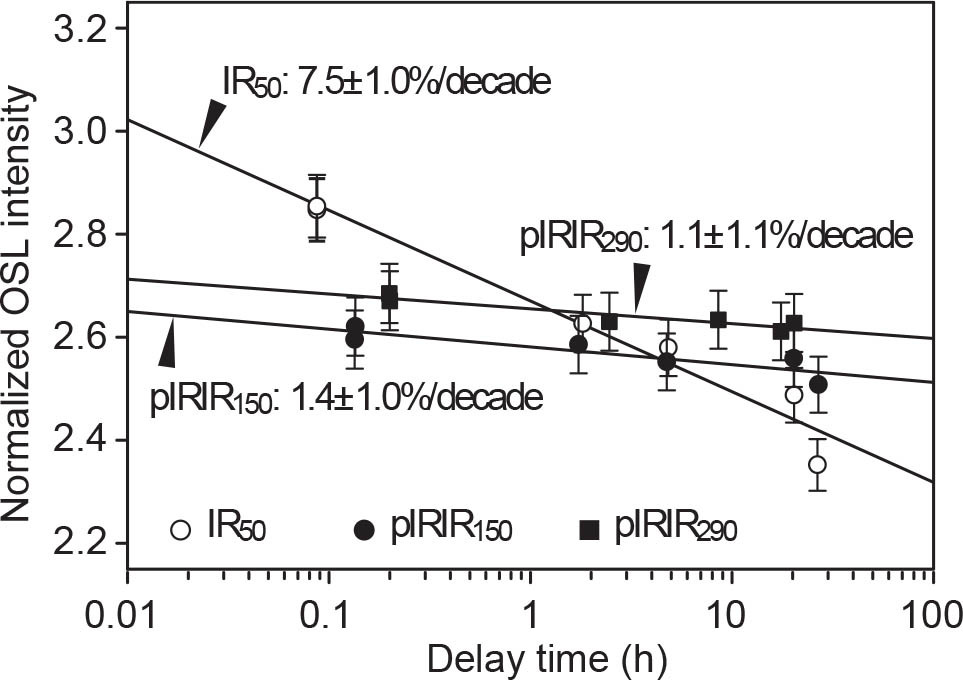
Bright natural IR50 and pIRIR150 signals, as well as bright pIRIR290 signal, were observed for Holocene samples (Fig. 4B). Equivalent doses were estimated from well-defined dose–response curves. Equivalent doses of IR50 decrease upwards in both cores, ranging from 5.25 to 8.10 Gy in core GS-QAS-2 and from 0.28 to 2.49 Gy in GS-QYH-1 (Table 5). Equivalent doses of pIRIR150 also decrease upwards, and are higher than the equivalent doses of IR50 in all samples. In contrast, the pIRIR290 signal yields much higher equivalent doses than pIRIR150, and does not show systematic trends in either core. Average g-values of IR50 were high (7.96±0.15%/decade), whereas those of pIRIR150 and pIRIR290 were as low as 1.21±0.11%/decade and 1.28±0.09%/decade, respectively (Fig. 5).
Table 5
Equivalent dose (De), uncorrected age, g-value, corrected age, offset from expected age, and De offset from expected for IR50 signals of Holocene samples.
Fig. 5
Fading test results of IR50, pIRIR150, and pIRIR290 signals measured for sample gsj15258. A regression line was defined for each signal based on the least-squares method and then applied to estimate the g-value.
In both cores, fading-corrected burial age estimates from IR50 and pIRIR150 display consistent trends with the stratigraphy, whereas those from pIRIR290 exhibit remarkable reversals (Tables 5–7, Fig. 3). Estimated dose rates were consistent, characterized by a small range of 2.07–2.30 Gy/ka. Fading-corrected ages of IR50 show vertical sequences from 7.7 to 5.8 ka in core GS-QAS and from 2.2 to 0.24 ka in core QYH-1, consistent with the stratigraphy (Fig. 3). The pIRIR150 results also exhibited stratigraphically consistent trends of fading-corrected ages, but their ages are generally older than those of IR50 by up to 1,200 years in core GS-QYH-1. In core GSQAS-2, the pIRIR150 ages are, although overlapping within error, generally younger than the IR50 ages. As expected from the equivalent dose, the fading-corrected ages of pIRIR290 were inconsistent with the stratigraphy and older than 9 ka. However, it is noteworthy that the corrected pIRIR290 ages in core GS-QAS-2 are generally older than those in core GS-QYH1 by several thousand years.
Table 6
Equivalent dose (De), uncorrected age, g-value, corrected age, offset from expected age, and De offset from expected for pIRIR150 signals of Holocene samples.
Table 7
Equivalent dose (De), uncorrected age, g-value, corrected age, offset from expected age, and De offset from expected for pIRIR150 signals of Holocene samples.
. DISCUSSION
Residual dose characterization
As the five modern samples are supposed to have burial ages of 0 years, their equivalent doses are equal to the residual dose. The residual doses of IR50 observed in the modern samples are less than 0.2 Gy, equivalent to only several decades for the given dose rate (Table 2). In contrast, pIRIR50/150 retains residual doses of 1–3 Gy, equivalent to 400–1,300 years.
Characterization of residual doses for Holocene samples requires comparison with the expected ages obtained from radiocarbon dating. In core GS-QYH-2, fading-corrected IR50 ages are consistent with radiocarbon ages. The radiocarbon ages of marine shells are likely older than the depositional ages as shells are not always buried immediately after their death; however, previous attempts confirmed that selective dating of intact shells results in consistent and precise chronology (Tamura et al., 2003, 2007) and thus minimizes the potential age overestimation. In core GS-QAS-2, which comprises early to middle Holocene deposits, the IR50 ages appear to be generally older than the expected ages derived from radiocarbon dating. The g-values determined here are higher than those of the majority of K-feldspar samples from other regions (Li et al., 2014), which may have resulted in a slight inaccuracy of the ages in core GS-QAS-2. The opposite trend is identified for pIRIR150 ages: the ages are older than the expected ages in core GS-QYH-1 and consistent with the expected ages in core GS-QAS-2. This finding suggests two possibilities: that either slight under-correction of the pIRIR150 ages was caused by an underestimation of the g-value, which cancels residual doses, or the residual doses were negligible compared with the accuracy of ages determined for the early to middle Holocene deposits. Despite these slight discrepancies, these results show that the fading-corrected IR50 and pIRIR150 ages in the present study provide a consistent chronology that is at least as accurate as radiocarbon dating. This finding is regionally important because it demonstrates that for dating young sediments, the IR50 and pIRIR150 of K-feldspar can be an effective alternative for quartz OSL, which many studies have shown to be inappropriate for dating in the Japanese archipelago (e.g., Tsukamoto et al., 2003; Tokuyasu et al., 2010; Tamura et al., 2015, 2017; Riedsel et al., 2018).
Appreciable residual doses were observed for the pIRIR290 signal of modern samples up to 30 Gy (Table 1). Holocene samples also show much older age estimates of pIRIR290 than expected, which is attributed to the residual dose. The residual dose of Holocene samples, Dresidual, is defined as:
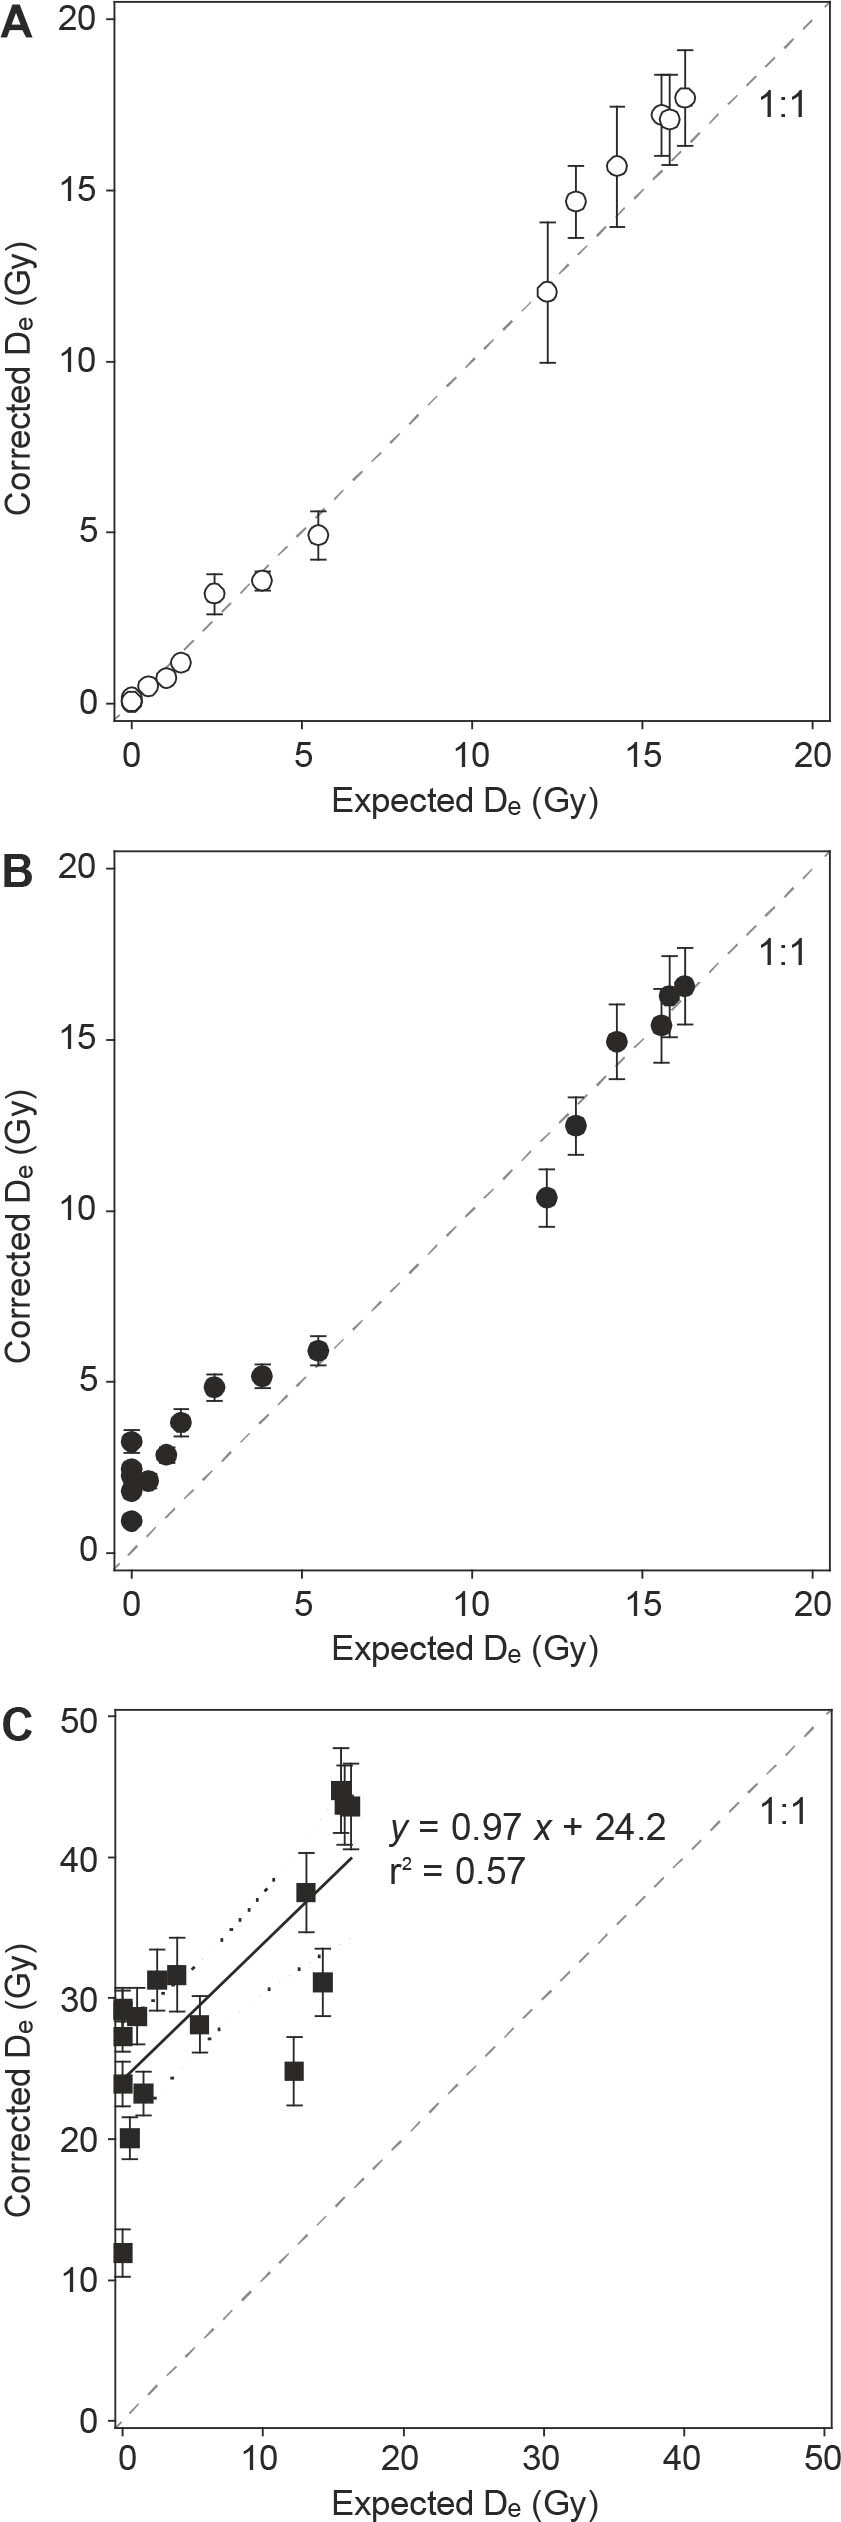
where Tosl is the fading-corrected age estimate from pIRIR or IR50, Texpected is the expected age, and Ḋ is the dose rate. Residual doses are provided in Tables 5–7 for each signal. The Holocene samples yielded residual doses of pIRIR290 that were similar to those of modern samples, ranging from 20 to 29 Gy (Table 7).Plots of fading-corrected equivalent doses De (= Tosl×Ḋ) against expected De (= Texpected×Ḋ) visualize the residual dose as a departure from the 1:1 line (Fig. 6). Although pIRIR290 shows a larger scatter, its trend is distinct from that of the 1:1 line, and the y-intercept of the regression line of these plots indicates the average residual dose (e.g., Sohbati et al., 2011), which is 24.2 Gy (Fig. 6C). In contrast, as expected from the age results, the corrected De values of pIRIR150 are consistent with the expected values, and only modern and late Holocene samples show identifiable departures from the 1:1 line (Fig. 6B). The departure of the IR50 De from the 1:1 line is only identified for early Holocene samples and possibly results from over-correction (Fig. 6A).
Fig. 6
Plots of fading-corrected De derived from (A) IR50, (B) pIRIR150, and (C) pIRIR290 against expected De. The y-intercept of the regression line for pIRIR290 represents the average residual dose, which is estimated as 24.2 Gy. Dotted lines indicate the 95% confidence interval.
The average residual doses of pIRIR290 are equivalent to an overestimate of 11,000 years, assuming an average dose rate of 2.2 Gy/ka. This overestimate leads to significant inaccuracy in dating Holocene sediments and possibly causes considerable overestimation even for deposits formed during the Last Interglacial Periods if the residual dose is not taken into account appropriately. No appreciable difference in the average g-value was identified between pIRIR150 and pIRIR290. If these g-values also apply for Late Pleistocene sediments, the lower residual dose of pIRIR150 is an obvious advantage. However, an underestimated g-value of pIRIR150 is also inferred from the apparent consistency of the pIRIR150 ages with the expected ages for lower Holocene deposits in core GS-QAS-2, despite the influence of the residual dose. This possible inaccuracy in fading correction likely leads to large errors in dating older sediments. In selecting an optimal signal for feldspar dating, the g-value should also be carefully examined.
Correlation of residual dose with water depth
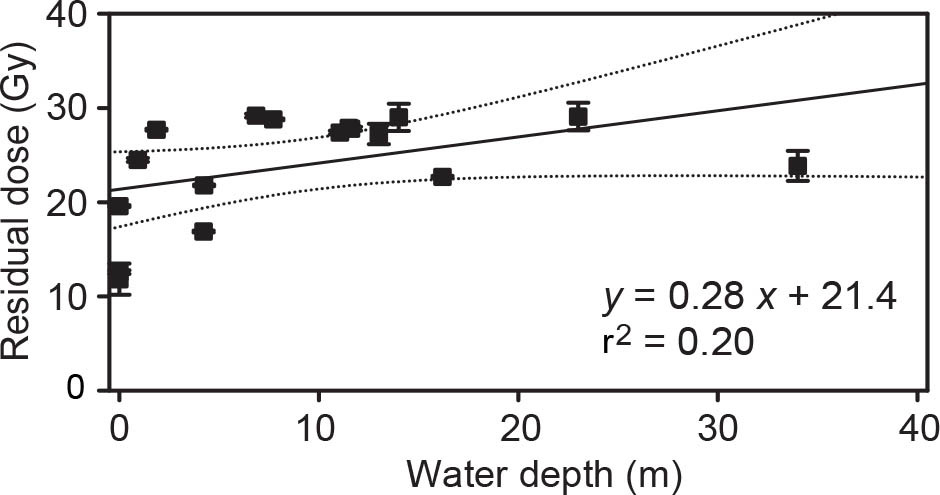
Saltwater absorbs the ultraviolet component of sunlight; thus, in shallow-marine environments, the bleachability of the luminescence signal is expected to rapidly drop as the water depth increases. However, the residual doses of IR50 and pIRIR150 in five modern samples show no obvious correlation with water depth. The depositional water depth of the Holocene samples is estimated from the difference between the bases of the foreshore and backshore facies, equivalent to the mean low-tide level at the time of deposition (Tamura et al., 2008a), and the sample level. The relationships of the residual dose of pIRIR290 in modern and Holocene samples with water depth exhibit no obvious trend (Fig. 7), but a few samples deposited in water depths shallower than 5 m show obviously lower residual doses of pIRIR290. Along the Kujukuri coast, the upper shoreface, i.e., the area shallower than 5–6 m, is characterized by frequent changes in topography caused by migration of longshore bars and troughs associated with an exchange of sand between the surf zone and the beachface (e.g., Lee et al., 1998; Kuriyama, 2002; Tamura et al., 2007). Samples from the foreshore and upper shoreface are likely to have been exposed to sunlight for a relatively long time, which may have bleached the difficult-to-bleach component of pIRIR290. In the bleaching test on sample gsj15151, the residual dose of pIRIR290 was depleted as low as 13.66±1.10 Gy after 4 h of exposure to artificial sunlight. Exposure to artificial sunlight for more than 4 h is known to further deplete pIRIR signals (e.g., Murray et al., 2012). Therefore, in the beach–shoreface system at Kujukuri, sunlight bleaching of pIRIR290 was incomplete for most of the samples; the degree of bleaching varies from sample to sample but is likely minimized in water depths <5 m.
Fig. 7
Plots of residual dose estimated for pIRIR290 against depositional water depth of the sample. The regression line exhibits only a very weak correlation; however, a few samples taken from less than 5 m water depth exhibit slightly lower residual doses than others. Dotted lines indicate the 95% confidence interval.
Comparisons with other coastal systems
Examination of the bleachability of luminescence signals has generally been limited to underwater environments of coastal systems, except for river deltas. Roberts and Plater (2007) quantified the residual dose of OSL in two quartz sand samples from the modern subtidal near-shore of the Dungeness Foreland, southern England, as equivalent to 15 and 40 years. Most efforts to quantify the residual dose of coastal sediments have been made in the intertidal zone and have generally reported residual doses of quartz OSL equivalent to less than a few tens of years (e.g., Banerjee et al., 2001; Ballarini et al., 2003; Madsen et al., 2005; Armitage et al., 2006; Madsen and Murray, 2009; Brill et al., 2017). Davids et al. (2010) reported that the K-feldspar IR50 of modern beach sands in New England, USA, retains a residual dose corresponding to 40 years, and similar results were obtained for tidal-flat sediments on the western coast of the Korean Peninsula (Hong et al., 2003). Although the quartz OSL was not investigated here, the IR50 of Kujukuri sands is shown to have a comparable residual dose to the quartz OSL, and feldspar IRSL observed in other coastal sands.
Applications of OSL dating to deltaic systems are not limited to intertidal and supratidal sediments (e.g., Giosan et al., 2006; Tamura et al., 2012a, 2012b; Chamberlain et al., 2018); the method can also be implemented in offshore and distributary sediments (e.g., Sugisaki et al., 2015; Chamberlain et al., 2017). Sugisaki et al. (2015) sampled suspended silts from turbid river water 300 km upstream of the Yangtze River estuary, southern China, and estimated the residual doses of quartz OSL, polymineral IR50, and polymineral pIRIR160 as 0.2, 1.4, and 7.4 Gy, respectively. In contrast, OSL and pIRIR160 yielded almost identical equivalent doses for most of the samples in Holocene sediment cores collected in an offshore prodelta at 40 m water depth, which is a good indication of complete bleaching (Murray et al., 2012). Thus, Sugisaki et al. (2015) concluded that delta sediments are well bleached by sunlight before they reach the prodelta. Chamberlain et al. (2017) examined the bleachability of sediments in distributaries of the Ganges–Brahmaputra–Meghna delta, Bangladesh, and reported that the OSL of fine quartz grains is generally well-bleached, whereas the pIRIR of fine polymineralic sediments is poorly bleached. They additionally observed slightly lower residual doses in grains that had been tidally reworked upstream relative to grains obtained around the river mouth and attributed this to the longer transport path and additional sunlight exposure. Gao et al. (2017) found nearly consistent quartz OSL and polymineralic pIRIR ages for fine sediments in a 40-m-thick Holocene subaqueous delta succession in the northern Yangtze delta plain, giving a good indication that the bleaching was sufficient. Nian et al. (2018) also reported consistent and precise age estimates in the Holocene Yangtze delta sediments from OSL dating of coarse-grained quartz; results from quartz appeared to be much better than radiocarbon dating, which showed many age reversals. These studies show that quartz OSL in subaqueous deltaic environments is generally well bleached and retains residual doses that are negligible in terms of millennial-scale chronology. This conclusion is also supported in other deltaic systems (Kim et al., 2015; Li et al., 2018b). Although quartz can be well bleached in a deltaic system, quartz grains from the Kujukuri coast are not suitable for OSL dating due to their unfavourable OSL properties. For the feldspar signal, based on comparisons with quartz OSL, Li et al. (2018b) estimated the residual doses of pIRIR150 and pIRIR225 as <5.5 Gy and 2–11 Gy, respectively, for fine polymineralic sediments from a Holocene subaqueous delta in the Bohai Sea, northeastern China. As in the Kujukuri coast, such results can be applied to clarify the possible overestimate of the pIRIR ages of Pleistocene sedimentary sequences, providing practical grounds for selecting robust feldspar signals for dating.
. CONCLUSIONS
We quantified the residual doses of IR50, pIRIR150, and pIRIR290 for K-feldspar sands from the modern and Holocene beach–shoreface system at Kujukuri, Pacific coast of eastern Japan. IR50, defined here as the prior IRSL during pIRIR150 measurement, of modern samples showed very low residual doses; however, pIRIR150 retains appreciable but limited residual doses of 1–3 Gy, equivalent to 400 to 1,300 years. Generally, fading-corrected ages of IR50 and pIRIR150 are reasonably consistent with radiocarbon dating in this region, whereas quartz OSL exhibits inappropriate properties for dating. Residual doses of pIRIR290 are equivalent to >10,000 years on average, an order of magnitude greater than those of pIRIR150, possibly leading to significant overestimation in dating Late Pleistocene sediments. Although the residual doses of pIRIR290 show a very weak correlation with water depth, a few samples taken from the upper shoreface and foreshore are characterized by much lower residuals than the average, probably as a result of longer sunlight exposure compared to deeper environments. Empirical assessments of pIRIR residual dose in coastal sedimentary systems, as practised here at Kujukuri, are still limited, and such efforts help to improve the accuracy of pIRIR dating of late Quaternary coastal sedimentary sequences.