. Introduction
Cathodoluminescence (CL) is an effective method for detection of various types of emission centers (lattice defects and trace elements), and CL observation of several minerals has been applied in many geoscientific fields, e.g., observation of growth structure, interpretation of diagenesis and studies of sediments, evaluation of metamorphic and metasomatic processes in several minerals (e.g., Marshall, 1988; Götze et al., 2001; Gaft et al., 2005). In the case of zircon, emission centers are attributable to rare earth elements (REEs) and structural defects, of which combination results in a variety of luminescence color (e.g., Marshall, 1988; Blanc et al., 2000; Nasdala et al., 2003). Therefore, the CL spectra show complicated features due to an overlap of each emission component. The luminescence spectra of most natural zircon have a broad emission band in a yellow region, of which appearance is closely related to a radiation-induced damage in its structure and/or a luminescent activation of (UO2)2+ (e.g., Götze et al., 1999; Nasdala et al., 2003). Radiation damages of natural zircon are derived from α-rays (α particles and α recoil) from the radionuclides 238U and 232Th as a self-radiation exposure (e.g., Weber et al., 1981). In a synthetic zircon, a blue emission band, composed of multiply overlapped peaks, has been assigned to “intrinsic” defect centers formed during its crystallization (Cesbron et al., 1995). Therefore, CL emissions in zircon are attributable to two-types of radiation-induced and intrinsic defects in addition to impurity centers. Recently, luminescent features of radiation damages by simulating the α and β particles in natural and/or synthetic minerals such as quartz, feldspar and zircon have been characterized by a spectroscopic method to assign individual emission centers (e.g., Finch et al., 2004; Okumura et al., 2008; Kayama et al., 2011; Tsuchiya et al., 2014), which suggests an evaluation of dose dependence on luminescence intensity related to radiation-induced defects (King et al., 2011; Kayama et al., 2014). Furthermore, a process of metamictization in radioactive minerals (e.g., zircon) has been estimated by luminescence methods for ion-implanted samples as a simulation of radiation-induced damage on minerals (e.g., Weber et al., 1994; Lian et al., 2003; Ewing et al., 2003; Finch et al., 2004; Nasdala et al., 2011). Annealing effects on the CL derived from radiation-induced defect in zircon have been investigated in detail by Raman and CL spectroscopies, and CL color imaging (e.g., Nasdala et al., 2002; Tsuchiya et al., 2015).
The CL emission component related to radiation-induced damage during metamictization in zircon has not been identified as a specified emission peak separated from the spectra overlapped with multiple emission peaks. In this study, we carried out 4.0 MeV He+ ion-implantation experiments for undoped synthetic zircon 4.0 MeV is similar to the energy of α particles emitted from 238U and 232Th. The CL data obtained from the implanted zircon have been analyzed using a spectral deconvolution method to clarify a relationship between the CL emission component and metamictization by comparing with those obtained from natural zircon.
. Samples and Methods
CL analysis was carried out for unimplanted and He+-ion implanted samples of synthetic zircon (termed SZ) with colorless and transparent euhedral crystals of ~0.2 mm size. This SZ was made from pure crystal powders of ZrO2 and Li2SiO3 (99.9 wt. % in purity) with a molar ratio of 15.77 mol % : 8.46 mol % by a fusion method using a Li-Mo Flux powders (Wako Pure Chemical Industries, Ltd) under atmosphere based on the procedure reported in Hanchar et al. (2001). The crystallinity and chemical homogeneity with impurity contents of <5 ppm except for Hf were checked by X-ray diffraction, Raman spectroscopy and electron probe microanalyzer, although SZ has the inclusion of Li-Mo. Unpolished mirror surface of SZ parallel to (100) surface was employed for CL measurements.
He+ ion implantation was conducted perpendicular to the (100) surface using a 3M-tandem ion accelerator at Takasaki Research Center of the Japan Atomic Energy Research Institute. The ion-beam was set to achieve 4.0 MeV at the time of implantation, corresponding to the energy of α particles from 238U and 232Th decays. Specific dose density was set in the range from 2.23×10⁻⁵ C/cm2 to 2.14×10⁻³ C/cm2. In this case, the dose of 2.5×10⁻⁵ C/cm2 corresponds to the exposed dose estimated from the radiation of uranium of 1000 ppm in natural zircon for 1.0×10⁶ y. Detailed information on the He+ ion implantation experiment and sample preparation has been reported in Okumura et al. (2008) and Kayama et al. (2011).
Color CL images of the samples were obtained by a cold-cathode microscope (Luminoscope: Nuclide ELM–3R), which is composed of an optical microscope, an electron gun, and a cooled charge–coupled device (CCD) camera. The instrument was operated at an accelerating voltage of 7.5 kV and a beam current of 0.5 mA with a 0.5 s exposure.
A scanning electron microscopy-cathodoluminescence (SEM–CL) measurement was carried out using a JEOL: JSM–5410 SEM combined with a grating monochromator (Oxford: Mono CL2). All CL spectra obtained in the range from 300 nm to 800 nm with 1 nm steps were corrected for the total instrumental response, which was determined using a calibrated standard lamp. The operating conditions were set as follows: an accelerating voltage of 15 kV and a beam current of 0.1 nA in scanning mode with a 220×185 μm scanning area.
. Results and Discussion
CL of synthetic zircon
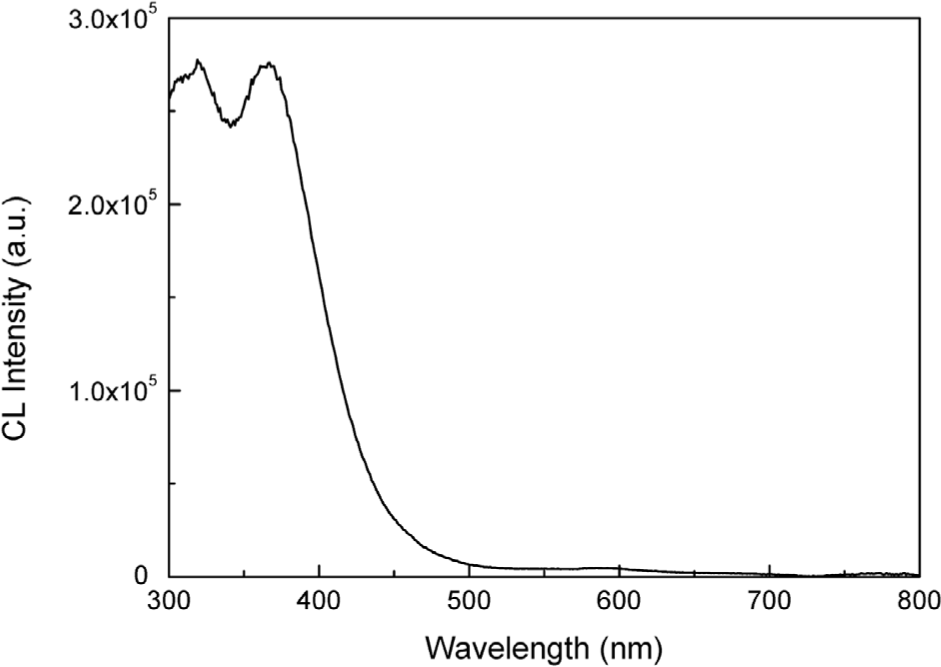
Color CL images of unimplanted SZ shows a bright blue CL emission with homogeneous features by an examination using Luminoscope, without any growth zoning (oscillatory and/or sector zoning) commonly found in magmatic zircon. CL spectrum of the SZ obtained with an SEM–CL is characterized by enhanced emission bands centered at ~310 nm and ~380 nm in a UV-blue region (Fig. 1), consistent with its CL color. Furthermore, the CL spectrum has a very weak emission band at 500 nm to 650 nm in a yellow-red region.
Figure 1
CL spectrum of synthetic zircon (SZ) after total instrumental correction operated at 0.1 nA in a scanning mode.
In general, CL spectra of natural minerals are composed of multiple emission peaks derived from a variety of impurity and defect centers. Therefore, a spectral deconvolution should be required for the characterization of constituent emission components in zircon CL. Recently, Tsuchiya et al. (2015) have demonstrated that a spectral deconvolution of natural zircon CL can be successfully carried out using a Gaussian function in energy units by the peak-fitting method proposed by Stevens-Kalceff (2009) and Kayama et al. (2010). We deconvolute the CL spectra of unimplanted and He+-ion implanted samples with initial peak energies determined by Tsuchiya et al. (2015) using the peak-fitting software (Peak Analyzer) implemented in Origin Pro 8.1J SR2.
The peak positions in the range of 300 nm to 400 nm as reported by Cesbron et al. (1995) were employed as initial values for spectra analysis. The result of the deconvolution for CL spectrum of unimplanted sample reveals that the CL-spectral peaks in a blue region (at energy > 3.0 eV) are composed of four emission components at 4.10 eV, 3.81 eV, 3.38 eV, and 3.28 eV (Fig. 2). These components can be assigned to the “intrinsic” defect centers of a3, a4, a5 and a6, respectively, as was proposed by Cesbron et al. (1995). The same emission centers were recognized in annealed natural zircon with various degree of metamictization (Tsuchiya et al., 2015). According to Cesbron et al. (1995) and Rémond et al. (1995), the emission centers of a1 to a6 obtained in synthetic zircon are closely related to the structural defects in a host lattice associated with specified atomic-bonding formed during crystallization, so termed “intrinsic” defects. The intrinsic center of a1 is corresponding to Si-O bond, a2 and a3 to Zr-O bond, a4 to O-O bond of edge shared between a SiO4 tetrahedra and ZrO8 decahedron or between two dodecahedra, a5 to O-O bond of unshared edge in a tetrahedron or a dodecahedron, and a6 to O-O bond of unshared edge in a dodecahedron (Hazen and Finger, 1979).
Figure 2
Deconvolution of the CL spectra in energy units obtained from SZ by using a Gaussian curve fitting. Measured spectrum shown by a black solid line; deconvoluted components by broken lines of blue one in the blue region and orange one in the yellow region; sum of the components by the red dotted line.
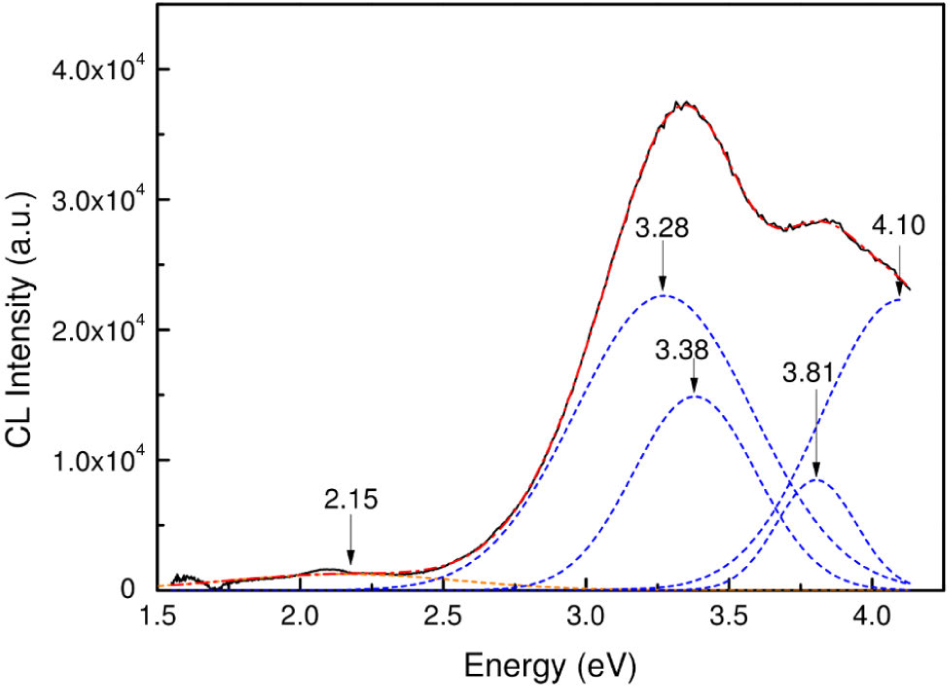
A faint signal of yellow emission is detected as an emission component centered at 2.15 eV (Fig. 2), that is too weak to be recognized in its color image. Yellow emission has been extensively reported in various types of natural zircon, and assigned to radiation-induced defects by the disintegration of U and Th or to impurity activation of (UO2)+2 (Götze et al., 1999; Nasdala et al., 2002; Gaft et al., 2002; Tsuchiya et al., 2015). According to Tsuchiya et al. (2014), young natural zircon extracted from the Takidani granodiorite aged at ~1.4 Ma does not have an obvious emission bands in a yellow region possibly due to very low radiation damage in its structure. However, the present zircon (SZ) without U and Th has a small but discernible emission component in a yellow region. Rémond et al. (1995) also reported a yellow emission in color CL images of undoped synthetic zircon. Furthermore, Gaft et al. (1998) assigned the yellow emission as an intrinsic emission and/or defect centers belonging to and/or the SiOmn- groups in a host structure. Similar yellow emission has been reported in the quartz CL as derived from the defect related to oxygen deficiency in the SiO4 tetrahedra (Krbetschek et al., 1998). Recently, Götze et al. (2015) detected a yellow emission in quartz by CL spectral deconvolution, and suggested the emission center is attributable to oxygen deficiency and local structural disorder in the structure. Therefore, the yellow emission in SZ might be due to oxygen defects and local structural disorder in the zircon structure generated during a synthesis process.
CL of He+ ion-implanted synthetic zircon
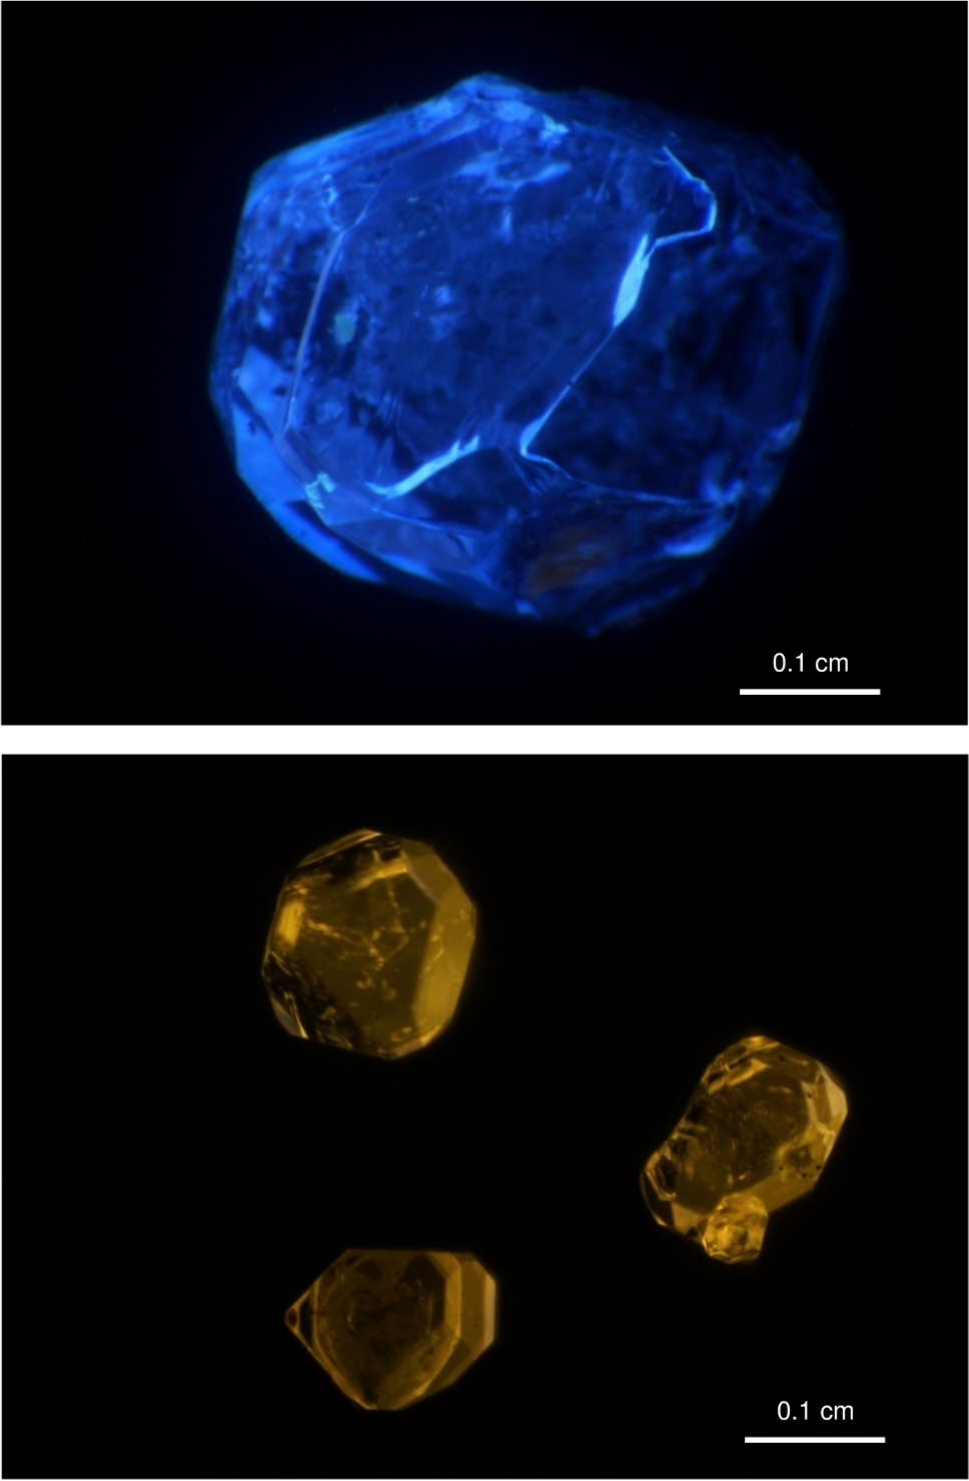
Color CL images of unimplanted and an example of He+ ion-implanted (2.14×10⁻³ C/cm2) samples are shown in Fig. 3. The implanted sample exhibits yellow CL, whereas unimplanted sample emits bright blue. The difference in CL color between them agrees with the results of similar implanted experiments on natural and synthetic zircon by Nasdala et al. (2011). Therefore, the yellow emission observed in the implanted SZ may be derived from the radiation-induced defect caused by He+ ion implantation equivalent to emission centers formed by disintegration of the radionuclides (U and Th) in natural zircon.
Figure 3
Color CL images of unimplanted (top) and He+ ion-implanted (bottom) SZ samples at 2.14×10⁻³ C/cm2.
CL spectra of unimplanted and He+ ion implanted (2.23×10⁻⁵ C/cm2 to 2.14×10⁻³ C/cm2) samples are indicated in Fig. 4. The CL emissions in a UV-blue region decrease with an increase in dose density, whereas yellow emission first increase but then is reduced by increasing radiation dose, explaining their CL color well. Nasdala et al. (2002) reported that CL spectra of highly metamictstate N17 zircon annealed at 1100°C to 1400°C have a similar UV-blue emission, attributed to these intrinsic centers, with intensities higher than that of untreated ones. In this case, a restitution crystalline state was achieved by the recovery from the metamict state by an annealing. Therefore, He+ ion implantation in zircon results in distortion and destruction of the crystal structure, which reduces blue CL emission.
Figure 4
CL spectra of unimplanted and He+ ion-implanted SZ samples at 2.23×10⁻⁵ C/cm2 to 2.14×10⁻³ C/cm2.
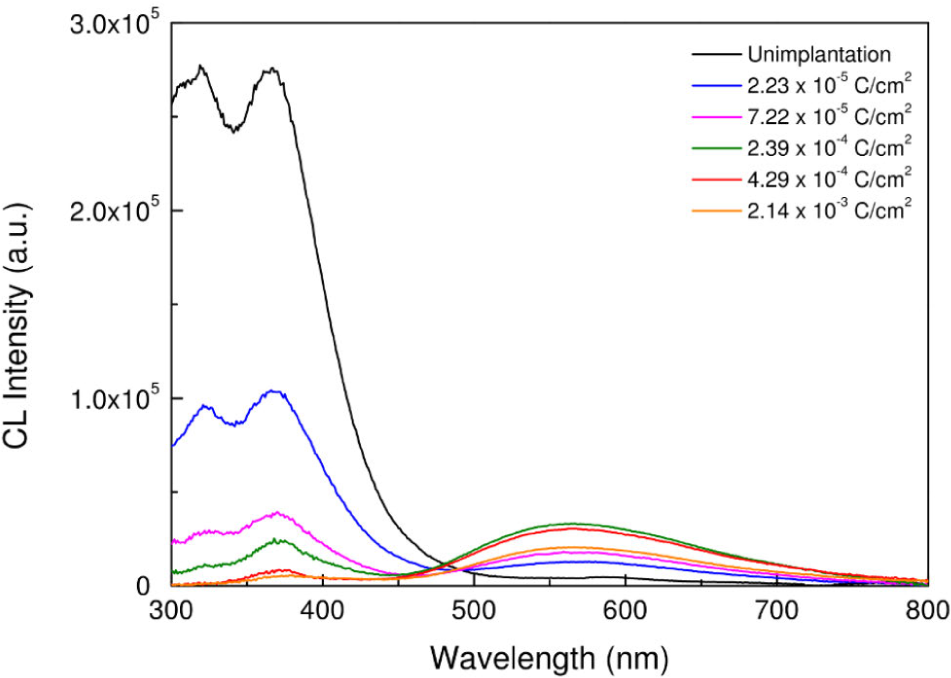
In a yellow region, CL intensity shows an increase with increasing in radiation dose up to 2.39×10⁻⁴ C/cm2 (Fig. 4), whereas a higher radiation dose than 4.29×10⁻⁴ C/cm2 deceases the yellow emission intensity. According to Finch et al. (2004), the ionoluminescence (IL) by H+, N+, and He+ ions in synthetic zircon doped with REEs and natural zircon enhance the IL intensity in a yellow region. Nasdala et al. (2011) reported that photoluminescence (PL) intensity of the yellow emission in the synthetic zircon samples implanted by He2+ increases with increasing radiation dose up to 1×10¹⁶ ions/cm2, but a decrease with radiation dose of 5×10¹⁶ ions/cm2. The response of zircon luminescence to the dose of the He-ion implantation has a similar relationship between CL and PL. Nasdala et al. (2011) inferred the suppression of the yellow emission at higher defect concentrations and an absence of this band in irradiated samples of natural zircon.
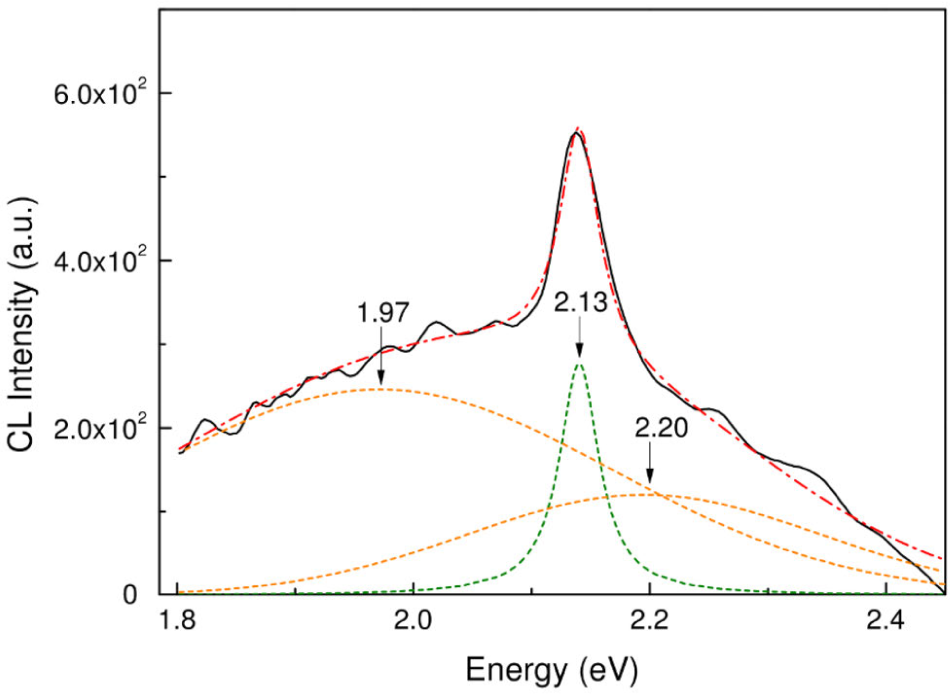
CL spectra of the samples implanted at 2.23×10⁻⁵ C/cm2 and 2.14×10⁻³ C/cm2 were converted into energy units, which were decomposed using a Gaussian curve to clarify the emission components for the yellow CL related to the radiation-induced defects (Figs. 5a and 5b). An emission component at 3.26 eV (a6, 380 nm) in the UV-blue region was detected in both samples, whereas other emission components of a3, a4, and a5 defects were extinguished at a high dose of ion implantation (Fig. 5). On the other hand, two components in yellow region are recognized at 1.96 eV (633 nm) and 2.16 eV (574 nm), the latter of which was recognized in unimplanted samples and attributable to the oxygen defects (e.g., Frenkel-type and SiOmn– groups defects). The emission component at 1.96 eV was found only in He+ ion-implanted samples. This might be attributed to structural defect centers related to radiation-induced damage. According to Gaft et al. (1998) and Finch et al. (2004), the luminescence centers detected from IL and PL in a yellow region are assigned to structural defects referred from the SiOmn– groups and Frenkel-type defects, which were also confirmed by Tsuchiya et al. (2015). The natural zircon (U: 241 ppm and Th: 177 ppm) from Malawi has two emission components at 1.97 eV and 2.20 eV in the yellow region (Tsuchiya et al., 2015), which are obtained by the deconvolution of remaining CL-spectral data after deduction of the emission components derived from the REEs such as Dy (Fig. 6). In this case, a Lorenz curve fitting has been used for the deduction of spectral peaks from rare-earth activation due to low Huang-Rhys factor (S), while a Gaussian curve fitting has been adapted to deconvolute the spectral peaks of defect centers with relatively high S (e.g., Yacobi and Holt, 1990). According to Tsuchiya et al. (2015), an annealing of the Malawi zircon up to 700°C decreases the intensity of yellow emission, suggesting that the emission component at around 2.20 eV should be attributable to radiation-induced defect centers.
Figure 5
Spectral deconvolution of the CL spectra in energy units obtained from implanted samples at (a) He+ ion-implanted at 2.23×10⁻⁵ C/cm2 and (b) at 2.14×10⁻³ C/cm2 by using a Gaussian curve fitting. Measured spectrum shown by a black solid line; deconvoluted components by broken lines of blue one in the blue region and orange one in the yellow region; sum of the components by the red dotted line.
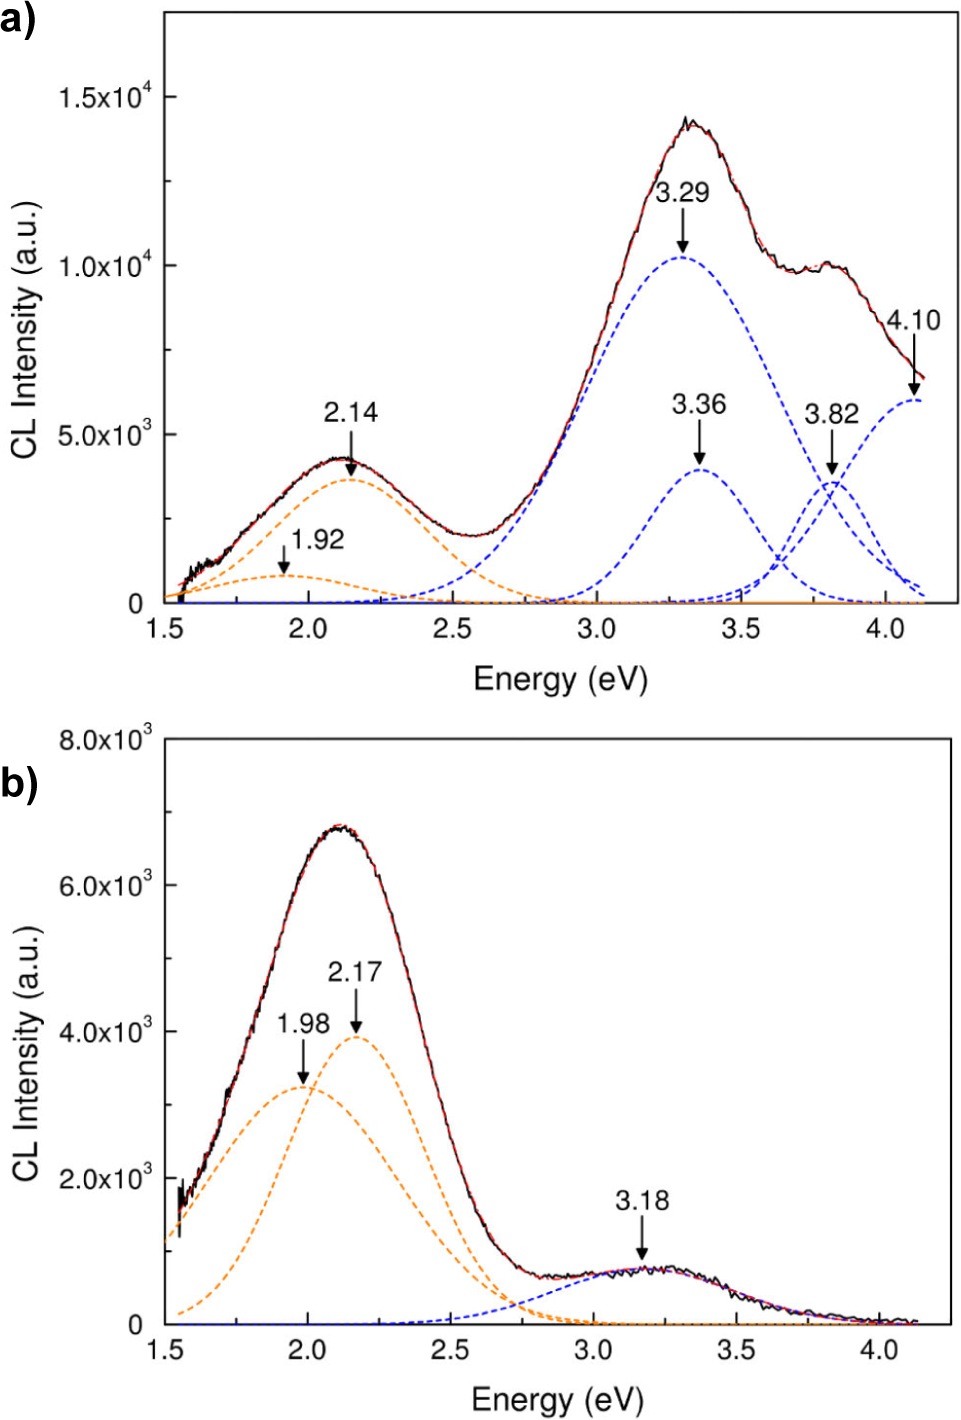
Figure 6
Spectral deconvolution of the CL spectra in energy units from Malawi zircon by using a Gaussian curve fitting. Measured spectrum shown by a black solid line; deconvoluted components by broken lines of green one for REE activations and orange one in the yellow region; sum of the components by the red dotted line.
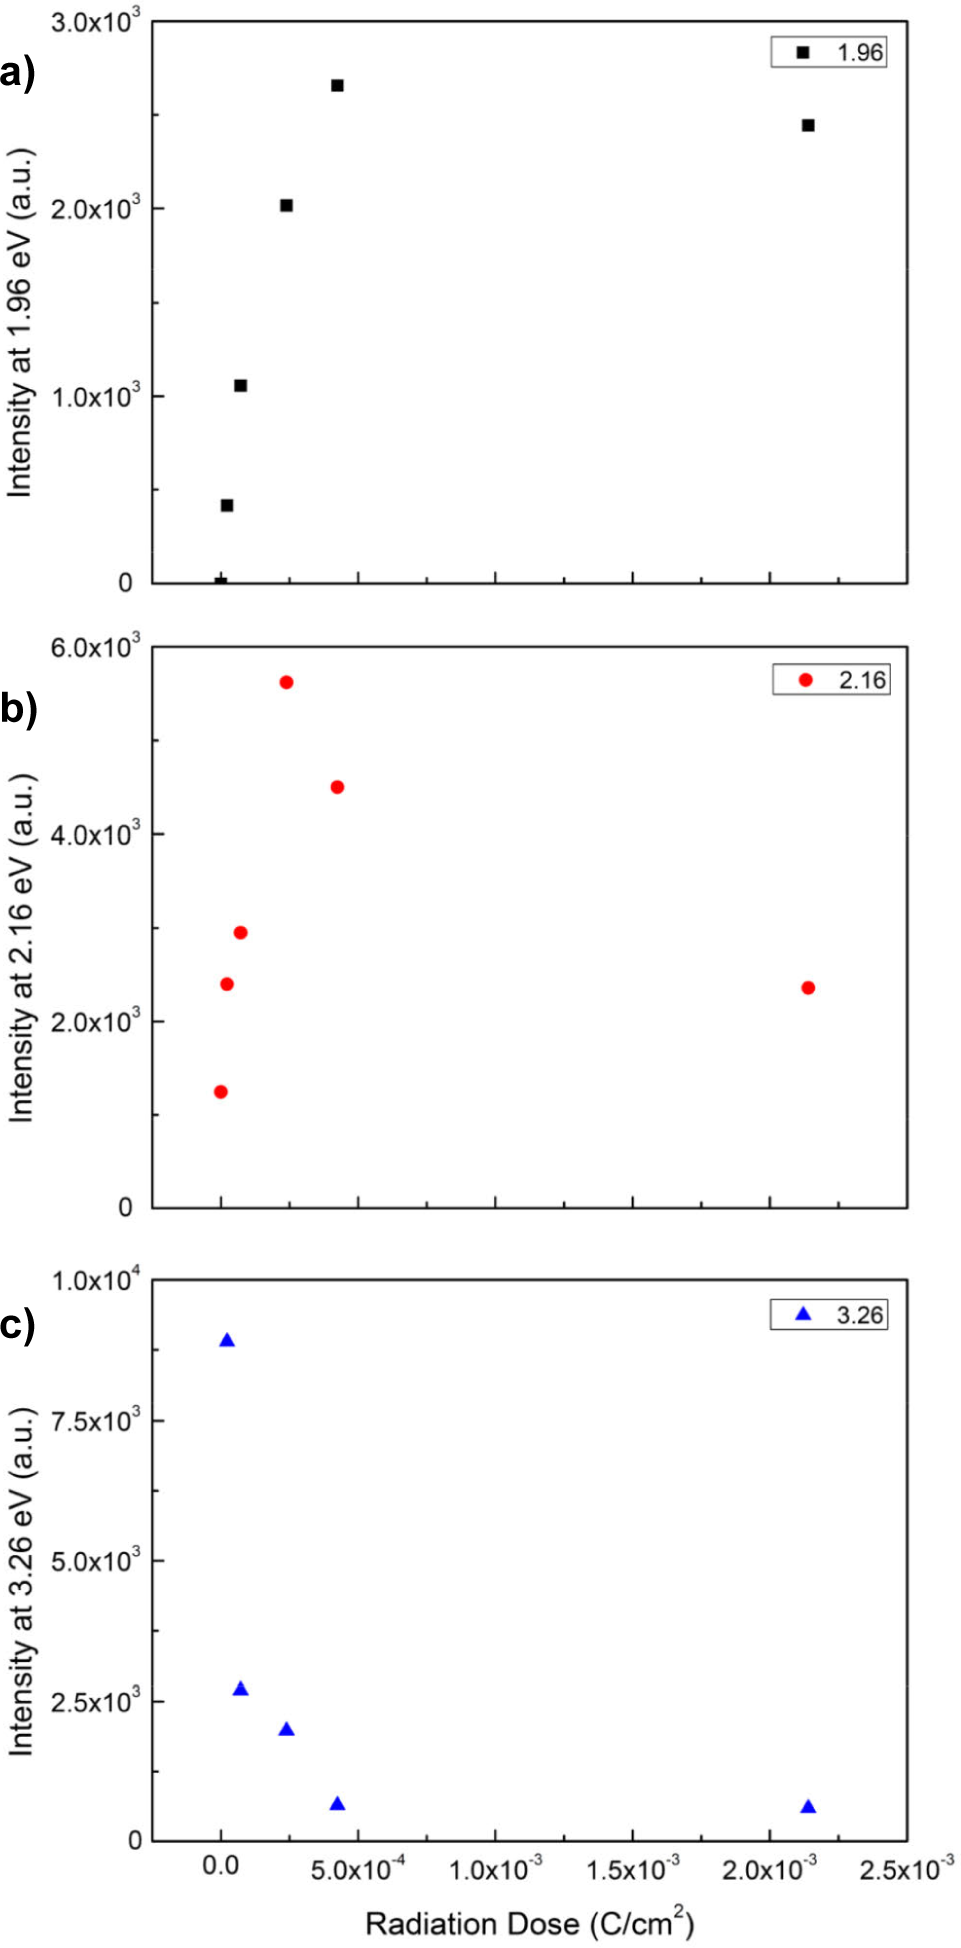
Furthermore, Götze et al. (2015) revealed that emission components in quartz are attributed to non-bridge oxygen hole centers (NBOHC) at 1.91 eV and oxygen deficiency and local structural disorder at 2.17 eV, which comparatively correspond to two components at 1.96 eV and 2.16 eV observed in the present samples. Therefore, the emission component of 1.96 eV may be presumed to be due to radiation damage by α particles. The responses of the emission components at 1.96 eV, 2.16 eV, and 3.26 eV to radiation dose are represented using an integrated intensity of each Gaussian curve corresponding to the components in Figs. 7a, 7b, and 7c. The intensity of the emission component at 1.96 eV gives a good correlation with an increase in radiation doses. It might saturate at a higher dose above 4.25×10⁻⁴ C/cm2. In the case of the emission component at 2.16 eV, the correlation behaves similarly to that in the emission component at 1.96 eV, but with an abrupt change of the response above 4.25×10⁻⁴ C/cm2. As previously described, the high radiation dose suppresses the yellow emission due to structural destruction. The UV-blue emission at 3.26 eV negatively relates to the radiation dose (Fig. 7c). Conclusively, the dose responses of the emission components at 1.96 eV and 3.26 eV are appraisable for the evaluation of the radiation damage, i.e., metamictization on zircon, especially in the range of low-dose radiation, which is difficult to be detected by the XRD and Raman methods. It leads us to propose application of the CL emissions in the yellow region as a geodosimeter using the CL of zircon.