
. INTRODUCTION
The loess of the Chinese Loess Plateau (CLP) potentially provide an important source of information about history of continental aridity, uplift of the Tibetan Plateau, global atmospheric circulation and are closely related to the evolution of the polar ice sheets (e.g. Pye, 1995; Ding et al., 1999; An et al., 2001; Guo et al., 2002; Lu et al., 2004; Song et al., 2007; Hao et al., 2012). In China, loess sediments not only deposit on the Loess Plateau but also accumulate in other arid, semi-arid and semi-humid areas. In recent years, increasing interest has been focused on the loess outside the CLP in order to derive more local to global palaeoenvironmental information from a wider area (e.g. Fang et al., 1999; Hao et al., 2010; Lai et al., 2001; Yang et al., 2014; Yi et al., 2017).
To the east of the CLP, loess sediments widely distributed in Central Shandong Mountains (CSM) are significant terrestrial palaeoclimatic archives in the semi-humid region of eastern China. It is also sensitive records of East Asian monsoon changes for situating in a key region connected to the Eurasian Plate and the Pacific Ocean. However, compared with the detailed work on the loess sediments from the CLP, loess sediments in CSM region have not been well investigated. In recent years, the relatively unified understanding of the loess sedimentation on CSM mainly focused on its genesis and provenance: (1) the loess of CSM was characterized by typical aeolian based on the field stratigraphic characteristics and grain size analysis (Liu et al., 2000; Zhang et al., 2004; Peng et al., 2007); (2) the provenance of loess in the CSM region are relatively stable based on systematic sedimentology, geochemistry and mineralogy studies (Zhang et al., 2005; Peng et al., 2007, 2016; Xu et al., 2015, 2017). However, research into the stratigraphy and palaeoclimatology in the CSM region are limited due to the controversy of chronology. Zheng et al. (1994) obtained the boundary Thermoluminescence (TL) ages between the last interglacial palaeosol and last glacial loess at Zibo section is 143 ± 11 ka. Peng et al. (2011) put forward that the quartz optically stimulated luminescence (OSL) age of the bottom of the last glacial loess at Qingzhou section is 74.8 ± 4.6 ka. While the latter chronology seems to be more reasonable on the basis of the correlation with established loess-palaeosol sequences in the CLP and marine isotope records, there is a lack of robust justification at other loess sections in the CSM region. In addition, a detailed numerical chronology for this region is still rare and younger than ∼39 ka (Xu et al., 2014). Long-term reconstruction of climatic changes in CSM is scarce (Peng et al., 2011; Zheng et al., 1994), mainly due to the lack of an accurate and high-resolution chronology for long-term loess-palaeosol sequences.
Rapid developments in OSL dating have proved to be very successful for the signal of dating loess bleached by sunlight before sedimentation (e.g. Buylaert et al., 2008; Lai, 2010; Yi et al., 2016; Stevens et al., 2018). While the quartz OSL signal saturated at relatively low doses (∼150 Gy) corresponding upper age limit at ∼50 ka using a dose rate of 3–4 Gy/ka (e.g. Chapot et al., 2012, Wang et al., 2018) prevents its use for dating older samples (Wintle and Murry, 2006). The infrared stimulation luminescence (IRSL) signal from feldspar has a much higher saturated dose compared to the quartz signal. However, IRSL tends to age underestimation due to anomalous fading (Wintle, 1973). In order to effectively decrease the anomalous fading impact of feldspar, the stable IRSL signal have been isolated from a higher temperature infrared stimulation signal measured after a lower temperature infrared stimulation (Post-IR IRSL protocols) (Thomsen et al., 2008; Buylaert et al., 2009, 2012; Thiel et al., 2011; Li and Li, 2011, 2012). The improvement of post-IR IRSL protocols have indicated that pIRIR can be successfully utilized to date both younger (<10 ka, e.g. Fu and Li, 2013) and older (>75 ka e.g. Buylaert et al., 2012; Li and Li, 2011, 2012; Chen et al., 2015) samples of loess sediments, providing a basis that the K-feldspar pIRIR dating protocol can compensate the limits of quartz SAR-OSL and has the potential to establish chronologies on loess-palaeosol sequences in this semi-humid zone.
In this study, 20 samples were taken from a 7.5 m loess-palaeosol sequence in CSM region. The objective of this study is two-fold; first, to establish a firm and high-resolution chronology of HS loess using quartz OSL and K-feldspar post-IR IRSL dating over the last interglacial period, which provides a relatively detailed and long-term chronological basis for palaeoenvironmental researches in the study region. The second aim is to investigate the potential of the pIRIR200IR290 protocol in CSM loess dating during 10–75 ka. The quartz OSL and feldspar pIR200IR290 ages are compared with the loess-palaeosol stratigraphy to determine the applicability of the method for the loess sediments in this semi-humid region.
. SITE DESCRIPTION AND SAMPLING
CSM region is located in the lower reaches of the Yellow River (Fig. 1a, 1b). The geomorphology of the CSM region is characterized by a serious of low mountains and hills (Mao, 1993), with elevations ranging from 200 to 1545 m above sea level (Peng et al., 2016). The region has a warm and semi-humid monsoon climate, which is characterized by obvious seasonal changes in temperature, precipitation and wind direction. The mean annual temperature is 12.6–14.5°C and the mean annual precipitation vary between 550 mm and 950 mm, but most rainfall (60∼70%) occurs in summer from June to August. In winter, the climate is controlled by the Siberia High, and the prevailing wind is northwesterly, and southeasterly winds in summer.
Fig. 1
(a) Location of the study region of the Central Shandong Mountains. (b) Location of the sampled loess section (HS) in the Central Shandong Mountains.
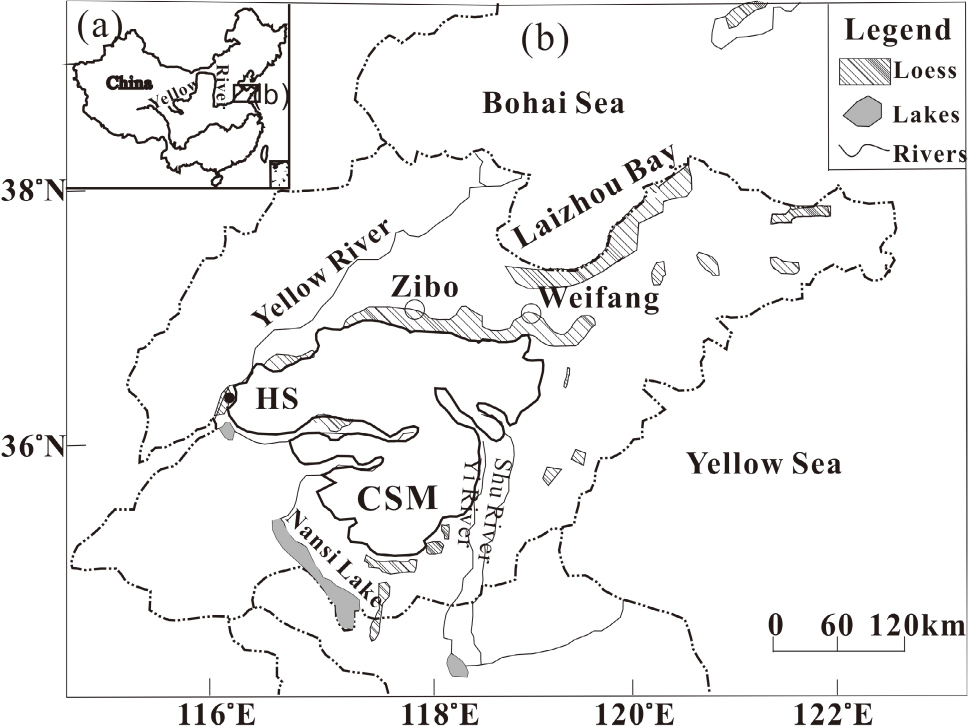
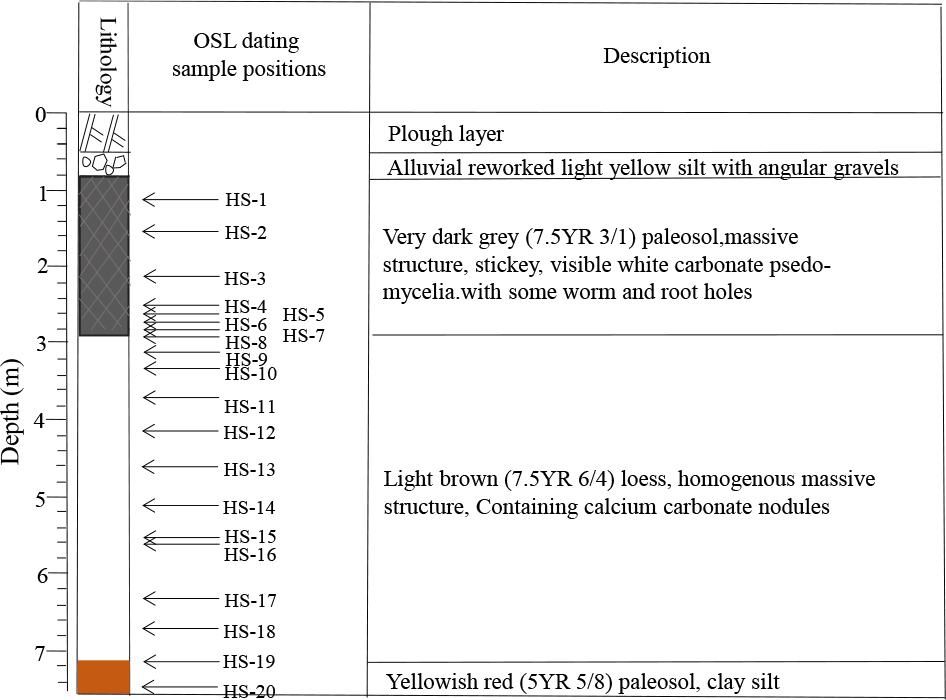
The new Heishan (HS) loess section (36°10.05′N, 116°20.63′E) sampled from the south bank of lower reaches of Yellow River is in the southwest of CSM (Fig. 1b). The section has a thickness of 7.5 m, with yellow plough horizon (0–1.0 m), greyish black Holocene soil (1.0–2.9 m), Malan loess (2.9–7.1 m) and the last interglacial palaeosol (7.1–7.5 m). Detailed lithological characteristics of each unit are shown in Fig. 2.
Twenty samples were collected using light-tight steel tubes (diameter 5 cm, length 20 cm) from a freshly prepared vertical section. The tubes were fully filled with sediments to prevent mixing during transportation. The tubes were then wrapped with aluminium foil at both ends to prevent light exposure and moisture loss for OSL measurement.
. METHODS
Luminescence sample preparation
Samples were opened under subdued red light conditions, and the outer 3–4 cm layers at the ends of each tube were removed for water content and dose rate analysis. The remaining material at the middle part of the tube was then pretreated using the standard procedures, including treatment with 10% hydrochloric acid (HCl) and 10% hydrogen peroxide (H2O2) to remove carbonates and organic matter, respectively. After wet sieving, grains in the range of 63–90 μm were extracted. This coarse fraction was treated with 10% hydrofluoric acid (HF) for 20 min, to remove coatings and the outer alpha-irradiated layer, and then rinsed in 10% HCl for 20 min to remove precipitated fluorides. Subsequently, the remaining grains were separated by heavy liquid to extract quartz grains (2.58 < ρ < 2.70 g/cm−3) and K-feldspar grains (ρ < 2.58 g/cm−3). Quartz extracts were etched in 40% HF for 1 h and rinsed for 1h in 10% HCl. The purity of quartz was checked by IR depletion ratio method (Duller, 2003) and 110°C TL peak (Li et al., 2002).
Experimental details and protocols
Quartz and K-feldspar measurements were performed on a Risø TL/OSL-DA-20 reader (Bøtter-Jensen et al., 2010) equipped with blue LEDs (470 nm, ∼80 mW cm−2) and infrared LEDs (875 nm,∼135 mW cm−2) for stimulation in the luminescence dating laboratory of Taishan University. Quartz OSL signals were detected through a 7.5 mm Hoya U-340 glass filter, and K-feldspar post-IR IRSL signals were detected through a combination of Corning 7–59 and Schott BG-39 glass filters, respectively. The 90Sr/90Y beta source was calibrated for both discs and cups by 180–250 μm calibration quartz samples (Hansen et al., 2015). Quartz and K-feldspar grains were mounted on stainless steel discs (5 mm) and cups (3 mm) respectively using silicone oil as adhesive. The stimulation power was set at 90% of the maximum value, and the heating rate is 5°C/s in all thermal treatment.
For quartz OSL, a standard single-aliquot regenerative dose (SAR) protocol (Murray and Wintle, 2000, 2003) was applied for luminescence measurements. The thermal treatment was set as preheat at 260°C and cut-heat at 220°C with blue stimulation at 125°C. The measurement of preheat temperature is described in Section 4. The single aliquot quartz OSL signals were derived from the summation of the initial 0.64 s of stimulation, less an early background of the following 0.64 s of stimulation to minimize a contribution from medium and slow components (Ballarini et al., 2007; Cunningham and Wallinga, 2010). Only De estimates with a relative uncertainty of the natural test dose signal less than 10% were accepted. In addition, dose estimates were accepted only if (i) the OSL IR depletion and recycling ratios lay between 0.9 and 1.1 and (ii) sensitivity corrected recuperation signals were consistent with zero at 2σ (Murray and Wintle, 2000, 2003; Wintle and Murray, 2006). These criteria led to the rejection of ∼4% of the measured aliquots because the sensitivity corrected natural signal was in or above saturation of the laboratory dose-response curve.
For K-feldspar, the SAR pIRIR290 protocol (Thiel et al., 2011; Buylaert et al., 2012; Li and Li, 2012) was applied to measure the De. Samples were stimulated by infrared light at 290°C after stimulation at 200°C. Feldspar (post-IR) IRSL signals were derived from the integral of the first 2 s of post-IR IRSL stimulation, less a background based on the last 50 s.
Dose rate determination
The environmental dose rate was determined from the U and Th concentrations and K contents, measured by neutron activation analysis (NAA) method in the Chinese Atomic Energy Institute. Calculation of the cosmic ray contribution was assessed according to Prescott and Hutton (1994). Measured water content from the HS section varied between 10% and 17%. Based on the water content from previous CSM loess researches (Peng et al., 2011; Kong et al., 2017) and the measured in the lab, water content of 15 ± 5% was used in all dose rate calculations. For quartz, an internal dose rate of 0.06 ± 0.03 Gy/ka was assumed after Mejdahl (1987). For the K-feldspar dose rate, a K concentration of 12.5 ± 0.5% and Rb content of 400 ± 100 ppm was assumed (Huntley and Baril, 1997). A summary of the uranium, thorium and potassium concentrations and the resulting dose rates of quartz and K-feldspar grains are given in Table 1.
Table 1
Summary of the burial depth, radionuclide concentrations, calculated dose rate, quartz and feldspar De values and luminescence ages. The water content is assumed to be 15 ± 5%. A residual dose of 6.2 ± 0.4 Gy was subtracted from the measured feldspar pIRIR290 De values. (n) represents the number of aliquots contributing to the De, 1 represents quartz and 2 is feldspar. Uncertainties represent one standard error.
. RESULTS AND DISCUSSION
Quartz luminescence characteristics and resulting ages
To select appropriate preheat temperatures for quartz De determination, preheat temperature plateau tests were used to assess the De dependence on preheat temperature for representative samples HS-4 and HS-16 (Fig. 3b). Preheat temperatures varied between 200°C and 300°C in increments of 20°C were tested. These results suggest that a 260°C preheat and 220°C cut-heat was suitable for quartz De determination. The suitability of SAR procedures for De determination was further checked by two dose-recovery tests. The dose recovery ratios are 1.01 ± 0.01 (given dose = 36 Gy, n = 10) and 1.01 ± 0.02 (given dose = 120 Gy, n = 9), respectively.
Fig. 3
Coarse-grain quartz luminescence characteristics. (a) Representative small aliquot dose-response curve (preheat 260°C for 10 s, cut heat 220°C) for sample HS-14 showing recycling and recuperation (open symbols) and the interpolation of the sensitivity-corrected natural signal onto the dose response curve. Inset shows the natural decay curve. (b) Preheat plateau tests of samples HS-4 and HS-16. Three aliquots were measured at each temperature, and error bars represent one standard error. The dashed line is drawn at the average De over the 200–300°C interval.
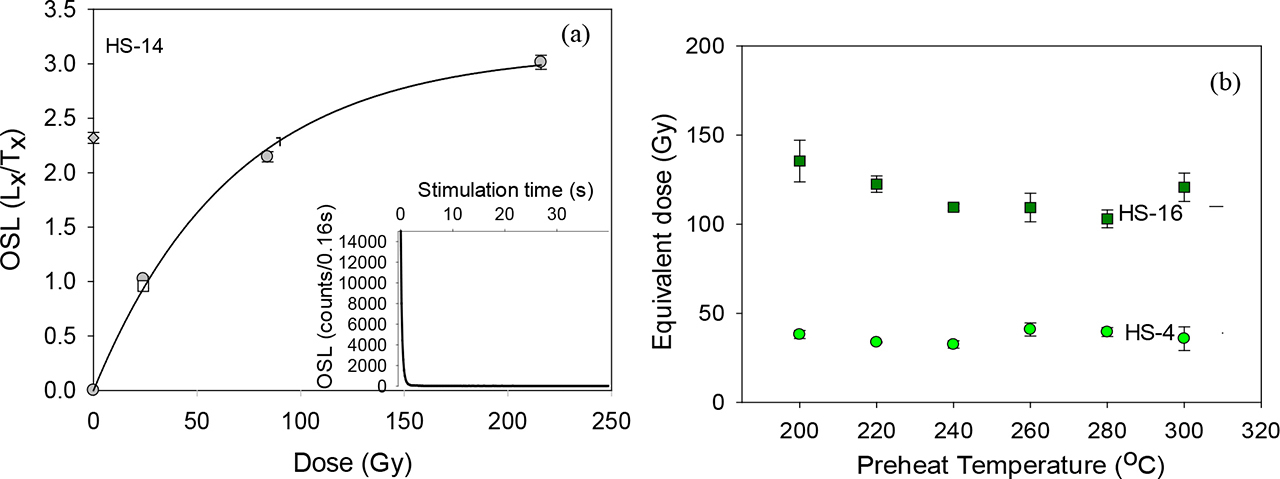
Typical dose-response curve and decay curve of quartz are shown in Fig. 3a. The blue-light stimulated OSL signals of HS-14 decrease very quickly during the first second of stimulation, indicating that the signal is dominated by the fast component (Jain et al., 2003). The dose-response curves of all the samples were fitted by one single saturating exponential function. The De obtained using the SAR protocol for all 20 quartz samples range from 26.9 ± 1.2 Gy to 188.6 ± 26.2 Gy (Table 1). The quartz age increases with depth from 8.5 ± 0.4 ka to 66.7 ± 3.9 ka.
K-feldspar luminescence characteristics and ages
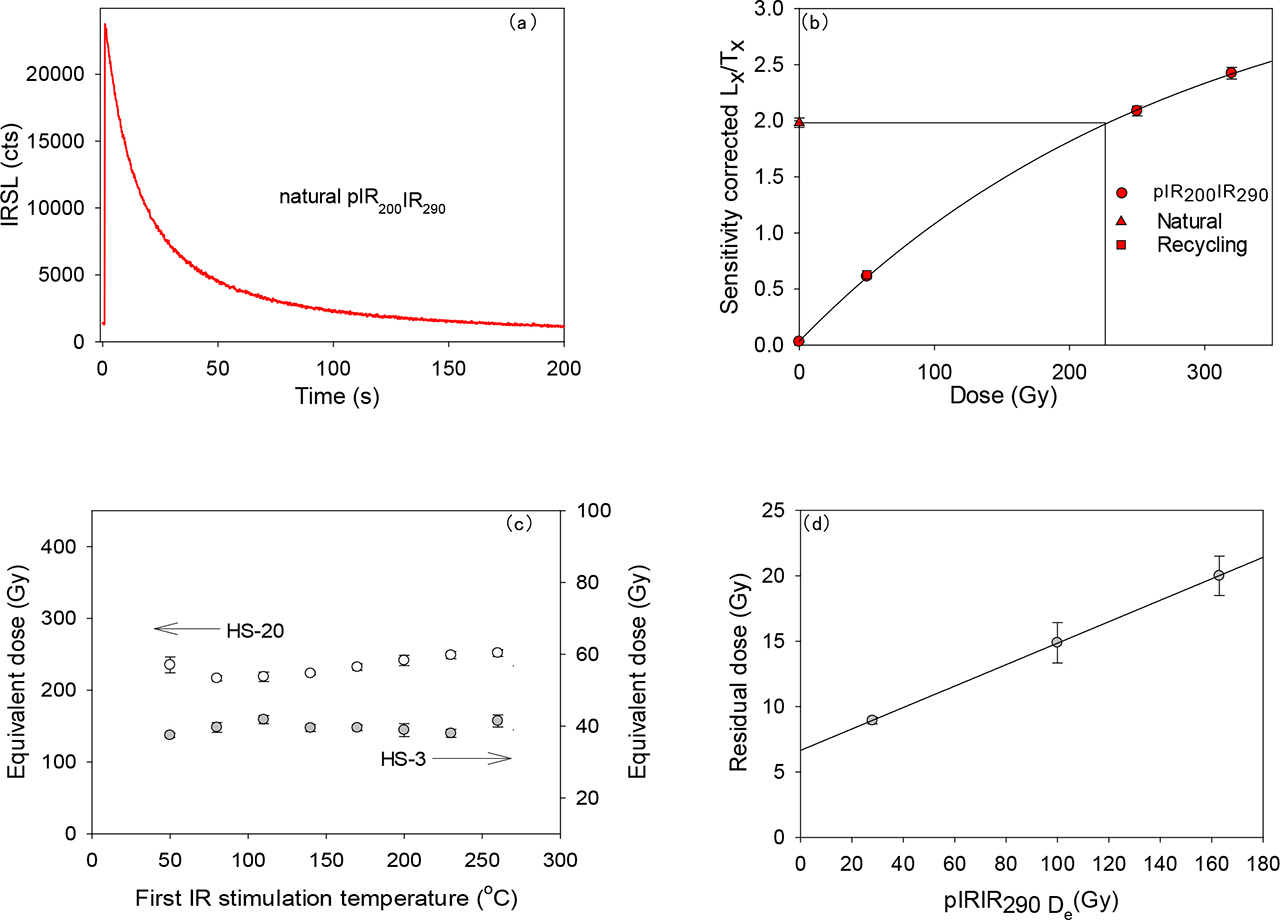
Representative decay curves and dose-response curves for the coarse-grained K-feldspar of sample HS-19 are shown in Fig. 4a, 4b. Based on model predictions, the stability of the post-IR IRSL signal may be dependent on the first IR stimulation temperature or wavelength (Jain and Ankjærgaard, 2011; Li and Li, 2011). Buylaert et al. (2012) have suggested the application of a first IR stimulation temperature plateau to investigate signal stability. A series of first stimulation temperatures, ranging from 50°C to 260°C (in increments of 30°C) were applied on samples of HS-3 and HS-20 (Fig. 4c), which demonstrates that the De is not dependent on the first IR stimulation temperature in a temperature range of 50°C to 260°C (Fig. 4c). However, some researches (e.g. Li and Li, 2012; Yi et al., 2016; Stevens et al., 2018) indicate that the first IR stimulation temperature of 200°C prior the second IR stimulation at 290°C (pIR200IR290) is more stable than the first IR stimulation temperature of 50°C prior the second IR stimulation at 290°C (pIR50IR290). Therefore, all doses were measured by pIR200IR290.
Fig. 4
Coarse-grain K-feldspar luminescence characteristics. Representative natural decay curve (a) and dose-response curve (b) of pIR200IR290 signal for sample HS-19. (c) Dependence of De on prior IR stimulation temperatures for the upper (HS-3) and lower sample (HS-20) of the HS section. Three aliquots were measured at each temperature, and error bars represent one standard error. The dash-dot line is drawn at the average De over the 50–260°C interval. (d) The pIRIR290 dose residuals after ten days bleach under natural sunlight were plotted against the corresponding equivalent doses.
To check the stability of the pIR200IR290 dating, dose recovery tests were performed. Six aliquots of each sample were bleached for 16 h with a Hönle UVACUBE400 solar simulator before they were given a laboratory β dose close to their natural doses (e.g. Qiu and Zhou, 2015, E et al., 2018). Three aliquots were measured using the pIR200IR290 method after given a beta dose. The other three aliquots were measured to determine the residual doses. Different laboratory doses were added to three representative natural samples HS-2, HS-7 and HS-20 (given dose is 40, 90 and 240 Gy), the pIR200IR290 dose recovery ratios without subtraction of the residual doses are 1.02 ± 0.09, 1.04 ± 0.04 and 1.14 ± 0.09 with a mean value of 1.06 ± 0.04 (n = 9). With subtraction of the residual doses, the dose recovery ratios are 0.93 ± 0.04, 1.01 ± 0.03 and 1.11 ± 0.06 with a mean value of 1.02 ± 0.05 (n = 9). It can be seen that the behaviour of pIR200IR290 SAR procedure on loess performed well for dose recovery tests.
The post-IR IRSL techniques may overestimate the De values due to thermal transfer during high-temperature heat treatment (Buylaert et al., 2012). The residual doses ranging from ∼5 Gy to ∼60 Gy for the post-IR IRSL signals have been reported from the world under the laboratory and sunlight bleaching conditions (Thomsen et al., 2008; Li and Li, 2011; Thiel et al., 2011; Murray et al., 2014; Yi et al., 2015, 2016). By contrast, much less is known about the residual dose for the loess samples in CSM region. In this study, three coarse loess samples were examined in the experiments. Five aliquots of the samples were bleached under the natural sunlight for ten days, and their residual doses were measured using the pIR200IR290 SAR procedure. The results are summarized in Fig. 4d. There is a clear tendency for the residual doses to increase with De values. Extrapolation of these residual doses to a De of zero Gy can be utilized to predict the average residual dose (Buylaert et al., 2012; Yi et al., 2016). The residual dose for the pIR200IR290 signal is 6.7 ± 0.4 Gy, which was subtracted from all measured De values used to calculate the pIR200IR290 ages given in Table 1.
The resulting pIR200IR290 De and ages are summarized in Table 1. The De values range from 42.9 ± 1.0 Gy for the upper sample to 242.9 ± 3.1 Gy for the lowest sample. The pIR200IR290 ages increase with depth from 9.4 ± 0.4 ka to 75.2 ± 2.2 ka (Table 1).
Comparison of quartz and feldspar ages
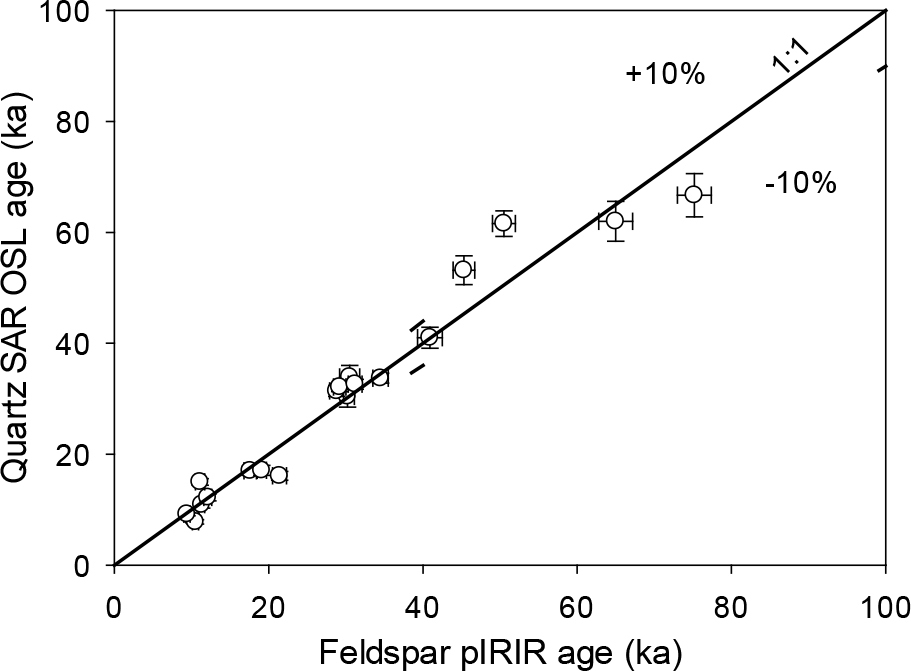
Quartz OSL ages for all samples are plotted against K-feldspar pIRIR290 ages in Fig. 5. All of the quartz and feldspar ages are consistent with each other in the whole section corresponding to an age of 8∼40 ka. The quartz OSL ages ranged from 8.5 ± 0.4 ka for the uppermost sample to 66.7 ± 3.9 ka for the lowest sample are consistently increasing with the depth. The dose of quartz in the 53.2 ± 2.6 ka (HS-17) is 146.3 ± 6.6 Gy, which is almost close to the limits (∼150 Gy) of reliable De determination using the SAR protocol suggested by Chapot et al. (2012). The quartz ages and the saturated dose-response curves suggest that they are already saturation for the samples older than 50 ka. The K-feldspar pIRIR290 ages increase systematically from 10.1 ± 0.3 ka to 75.2 ± 2.2 ka and are in stratigraphic order. So the quartz OSL ages <50 ka and the K-feldspar pIRIR290 ages >50 ka were selected for establishing the chronological framework for the study profile. Meanwhile, a steep increase of age exists in both chronological sequences at a depth of 3.1 m, indicative of a hiatus in the strata of the loess.
Chronology and sedimentation of the Heishan loess sequence
As demonstrated in Fig. 6, the quartz OSL and K-feldspar pIRIR290 ages of the HS section indicate that the loess was mainly deposited during the last glaciation and the Holocene. Loess sediments were primarily deposited between ∼75 ka and ∼30 ka and between 17 ka and ∼8 ka, corresponding to MIS 4 to MIS 3 and MIS 1 (Lisiecki and Raymo, 2005), respectively. A hiatus of ∼13 ka occurred between ∼30 and ∼17 ka, generally corresponding to MIS 2 (Lisiecki and Raymo, 2005). We suggest caution when using the loess sediments in this area to obtain the information of palaeoenvironmental changes, especially during the glacial stages such as MIS 2. Lu et al. (2006) identified a discontinuity of loess sedimentation between ∼15 ka and 10 ka. They implied that wind erosion related to a cold-dry climate during MIS 2 might be the primary cause of this hiatus in CLP loess sequences. Buylaert et al. (2008) reported that a hiatus was identified from 30 ka to 20 ka (MIS 2) at Tuxiangdao (Xining, western of the CLP) loess section. E et al. (2018) also tested a hiatus between 39 ka and 11 ka (MIS 2 and MIS 3) at the Hebei section in the northeast Tibetan Plateau by high-resolution OSL dating, and they attributed it to the deflation at the same time as the CLP is accumulating. Wang et al. (2018) also detected a gap in deposition between 25 and 2 ka (MIS 2) at the Ledu loess section in the Huangshui river valley on the northeastern Tibetan Plateau by high-resolution OSL dating, and they attributed it to the erosion events or lower accumulation rate. There seems a sedimentation hiatus in the Mangshan loess during 30–20 ka (MIS 2, Qiu and Zhou, 2015) and Xiashu loess within the period of 30–0 ka (MIS 1 and MIS 2, Yi et al., 2017). It seems that loess closed to desert boundaries, or adjacent to source regions of CLP, or neighbour the major river systems such as the Yangtze River or the Yellow River, often deposited episodically or was eroded during MIS 2.
The dust source of HS loess section in the CSM region might be proximal and most likely from the fluvial deposits (Peng et al., 2016). The dust accumulation at this section, i.e. during glacial periods, would be most likely influenced by changes in dust source and the dust-transporting wind strength. Therefore, the hiatus between 30–17 ka falls well within the last glacial period and could be viewed as a result of strong wind erosion in competition with rapid accumulation at the proximal sites near the source. Instead, more loess accumulation during the last deglaciation (after 17 ka) could be explained as more preservation possibly due to weaker winds.
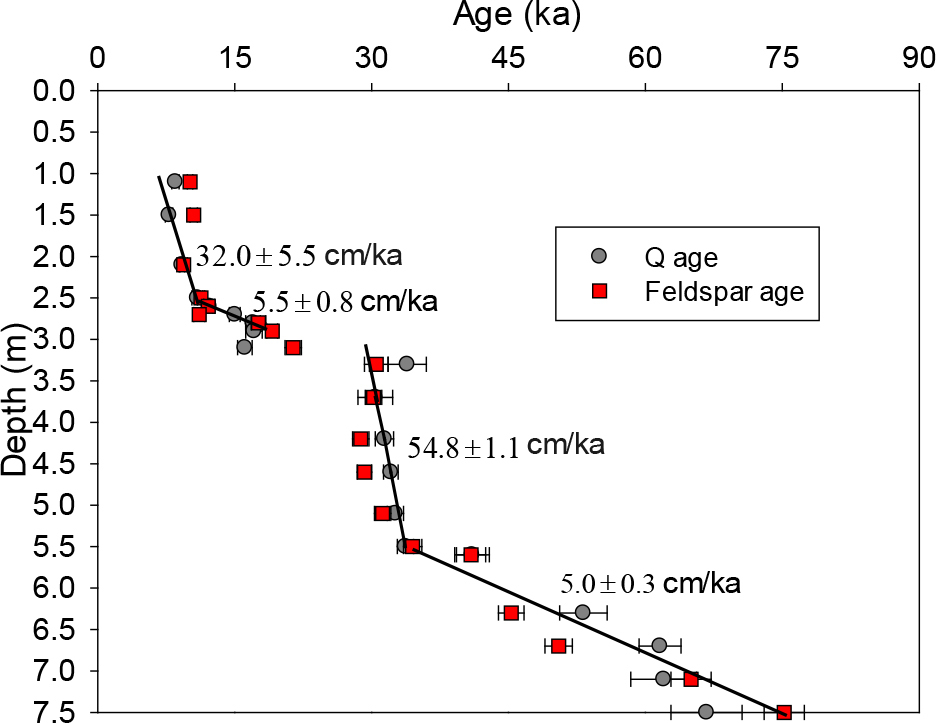
The sedimentation rate of the HS section is shown in Fig. 6. In view of the fact that feldspar ages are more reliable when the ages of samples are older than 50 ka, we calculated the sedimentation rates based on quartz ages during ∼11 ka to ∼8 ka, ∼17–11 ka and ∼34 ka to ∼30 ka, and 75–34 ka on feldspar ages. The graph indicates two relatively rapid sedimentation rates during ∼11 ka to ∼8 ka with 32.0 ± 5.5 cm/ka, and ∼34 ka to ∼30 ka with 54.8 ± 1.1 cm/ka. Loess deposited at much slower accumulation rates of 5.5 ± 0.8 cm/ka and 5.0 ± 0.3 cm/ka during ∼17–11 ka and ∼75–34 ka, respectively. The loess sedimentation rate increases from 5.5 ± 0.8 cm/ka (17.1–10.9 ka) to 32.0 ± 5.5 cm/ka (10.9–8.5 ka) at 10.9 ± 0.6 ka (Fig. 6), which is close to the MIS 2/1 boundary. Higher sedimentation rate during the Holocene epoch (after about 11 ka), compared to the relatively low rate during the late glacial period, could be actually resulted from post-depositional disturbance (Lu et al., 2006; Sun et al., 2010; Xu et al., 2018). The influence by post-depositional disturbance (i.e. bioturbation during pedogenesis) induced by more monsoon precipitation in the CSM region may be significant. It may homogenize sediments, disturb the underlying loess deposits and may offset the measured OSL age (Stevens et al., 2007; Sun et al., 2010; Xu et al., 2018), the same sedimentary processes as the distal sites on the CLP behave (Xu et al., 2018).
The rapid sedimentation rate during 34–30 ka was also similar with the lake sediments records (An et al., 2012) suggested a rapid dust deposition during 32–29 ka and rapid loess sediments around 33–30 ka (Wang et al., 2015). This similarity in loess sedimentation may have important implications for understanding the mechanism of loess accumulation and the process of palaeoclimatic changes. This still deserves further investigations.
. CONCLUSIONS
We applied high-resolution luminescence dating, using both quartz OSL and K-feldspar pIRIR290 on a loess sequence in the CSM, eastern China. The quartz signal is sensitive, fast component dominated, saturates approximately ∼150 Gy. For K-feldspar pIRIR290, first IR stimulation plateau tests indicated that the determined De does not have any obvious dependence on first IR stimulation temperature between 50°C and 260°C, and the dose recovery is satisfactory. In addition, K-feldspar pIRIR290 signals are far from saturation and show an agreement with the expected stratigraphy (8∼75 ka). Especially, the K-feldspar Post-IR IRSL dating method is the first application of the Loess dating in CSM region, implying that the experimental method has a large potential in the study of the older loess here.
Based on our results, a hiatus of ∼13 ka between ∼30 and ∼17 ka can be interpreted as deflation, which indicates that it is an erosion area during 30–17 ka. This loess sequence provides a relatively long-term chronological basis of palaeoclimatic researches in this semi-humid region since the last glacial period.