
. Introduction
CO2, a trace gas, plays a critical role in the greenhouse effect and the global carbon cycle. Over the past few decades, rapid and significant industrial development (resulting in high emissions), transportation advancements and urban-isation (with varying emission levels) have led to a substantial increase in anthropogenic carbon dioxide emissions, particularly in densely populated urban areas. The emission of carbon dioxide into the atmosphere has emerged as a pressing issue with wide-ranging environmental impacts. Human activities, including fossil-fuel combustion and cement production, contribute more carbon dioxide to the atmosphere than natural processes can remove. Roughly 50% of anthropogenic carbon dioxide is absorbed by the biosphere and oceans, while the remainder accumulates, elevating the atmospheric carbon dioxide concentration. Presently, atmospheric carbon dioxide levels are nearly 50% higher than those observed before the industrial revolution began. In October 2022, the average monthly level of CO2 in the Earth’s atmosphere exceeded 416 ppm. Additionally, in April 2023, the monthly average CO2 level at the Mauna Loa observatory surpassed 423 ppm (source: https://gml.noaa.gov/ccgg/trends/). This study presents preliminary results of CO2 level determinations since then.
Monitoring CO2 levels is of utmost importance in understanding the local carbon cycle and various environmental interactions. With recent changes in energy sector policies, research data on CO2 levels can serve as vital information sources for comparing the carbon cycle in selected cities with that of the natural environment. The diurnal pattern of CO2 may be primarily influenced by biological processes such as soil CO2 respiration as well as anthropogenic sources related to fossil-fuel usage (e.g. traffic intensity variations and heating or air conditioning demands), atmospheric transport and planetary boundary layer (PBL) dynamics (Fang et al., 2014; Vardag et al., 2015; Lauvaux et al., 2016; Lin et al., 2018; Metya et al., 2021; Bezyk et al., 2023).
Analysing the CO2 balance in urban areas holds significant importance due to the concentrated human activities and infrastructure present in cities. Urban environments are characterised by high population densities, extensive energy consumption and various emission sources such as industries, transportation networks and residential sectors. Understanding the CO2 dynamics in urban settings provides crucial insights into the efficiency of carbon-management strategies, urban planning and the potential for mitigating greenhouse gas emissions (Fang et al., 2014; Vardag et al., 2015; Lauvaux et al., 2016; Lin et al., 2018; Metya et al., 2021). By examining the urban CO2 balance, researchers and policymakers can identify the key contributors to emissions and develop targeted measures to reduce carbon footprints. This helps in assessing the effectiveness of urban greening initiatives, alternative transportation systems and energy-efficient practices. Furthermore, studying the CO2 levels in urban areas allows for a better understanding of the interplay between human activities, atmospheric conditions and the local carbon cycle (Marcotullio et al., 2014, Moore and Jacobson, 2015; Röckmann et al., 2016; Davis et al., 2017). Insights gained from analysing urban CO2 balances also contribute to the development of sustainable cities and the promotion of low-carbon urban lifestyles. The findings can inform policymakers and city planners on the implementation of policies, regulations and infrastructure improvements aimed at achieving climate goals, improving air quality and ensuring the wellbeing of urban residents.
In Poland, industrial emissions have been limited, but the contribution from traffic and households remains significant (Różański et al., 2014; Jasek-Kamińska et al., 2020; Zimnoch et al., 2020). The long-term evolution of CO2 emissions from fossil fuels in the urban atmosphere of Kraków, located in southern Poland, has been extensively studied (Kuc, 1991; Necki et al., 2003; Kuc et al., 2007; Zimnoch et al., 2012). Systematic atmospheric measurements were initiated in Kraków in the 1980s, although not consistently carried out. Analysis of radio-carbon concentrations of CO2 in Kraków compared to the European reference site (Jungfraujoch, Swiss Alps) indicates a decline in fossil-fuel–related CO2 emissions following significant economic changes in the region after 1989.
The systematic measurement of the CO2 air mole fraction in Gliwice with high temporal resolution and reasonable accuracy to catch the diurnal cycle was started in August 2022 (Sensuła, 2023, Sensuła et al., 2023a,b). The first experimental studies of atmospheric air in Gliwice were carried out over a period of time since 2011–2013 (Piotrowska et al., 2019). The air samples were then collected once a week, at around 10 a.m. Prior to these experimental studies, it was expected that, owing to road transport, there would be a clear increase in the quantum of CO2 in the air; however, this effect was not observed in these studies, whereas significant fluctuations were observed that could not be explained within the contexts of these particular researches, whose main objective was to determine the impact of human activity on the isotopic composition of the air. It should be mentioned that about 10 years ago, during the analyses, the level of CO2 was not investigated. It is possible that too short a sampling time had not given representative diurnal data, but only data concerned with certain moments of time – exactly those when the samples were collected. The results could contain some ‘noise’. In 2019, it was decided to create, in collaboration with coinvestigators, a new laboratory stand for the complex analysis of CO2 in the air (including molar fractions with high temporal resolution). The laboratory stand has been developed and will be further developed, tested and optimised. Further analysis of the impact of fossil-fuel combustion has been conducted by using tree rings and tree needles as bioindicators, since 2012 (Sensuła et al., 2018, 2022, 2023a,b). Additional new data on the mole fraction in Gliwice may be important for arriving at an understanding of the local and regional carbon cycle.
In summary, the analysis of the urban CO2 balance plays a vital role in tackling the challenges of climate change, thereby contributing to sustainable urban development. It will help in identifying emission sources, guiding mitigation efforts and shaping policies that aim to create healthier, more environmentally friendly cities.
This study focusses on measuring CO2 concentrations in the atmosphere of Gliwice city and comparing them with the levels measured by two well-established monitoring stations: the Kraków city observatory and the Kasprowy Wierch mountain observatory. Continued research and analysis are necessary to better understand the specific drivers of CO2 concentrations in urban areas and their implications for atmospheric composition and climate change.
. Sampling Sites
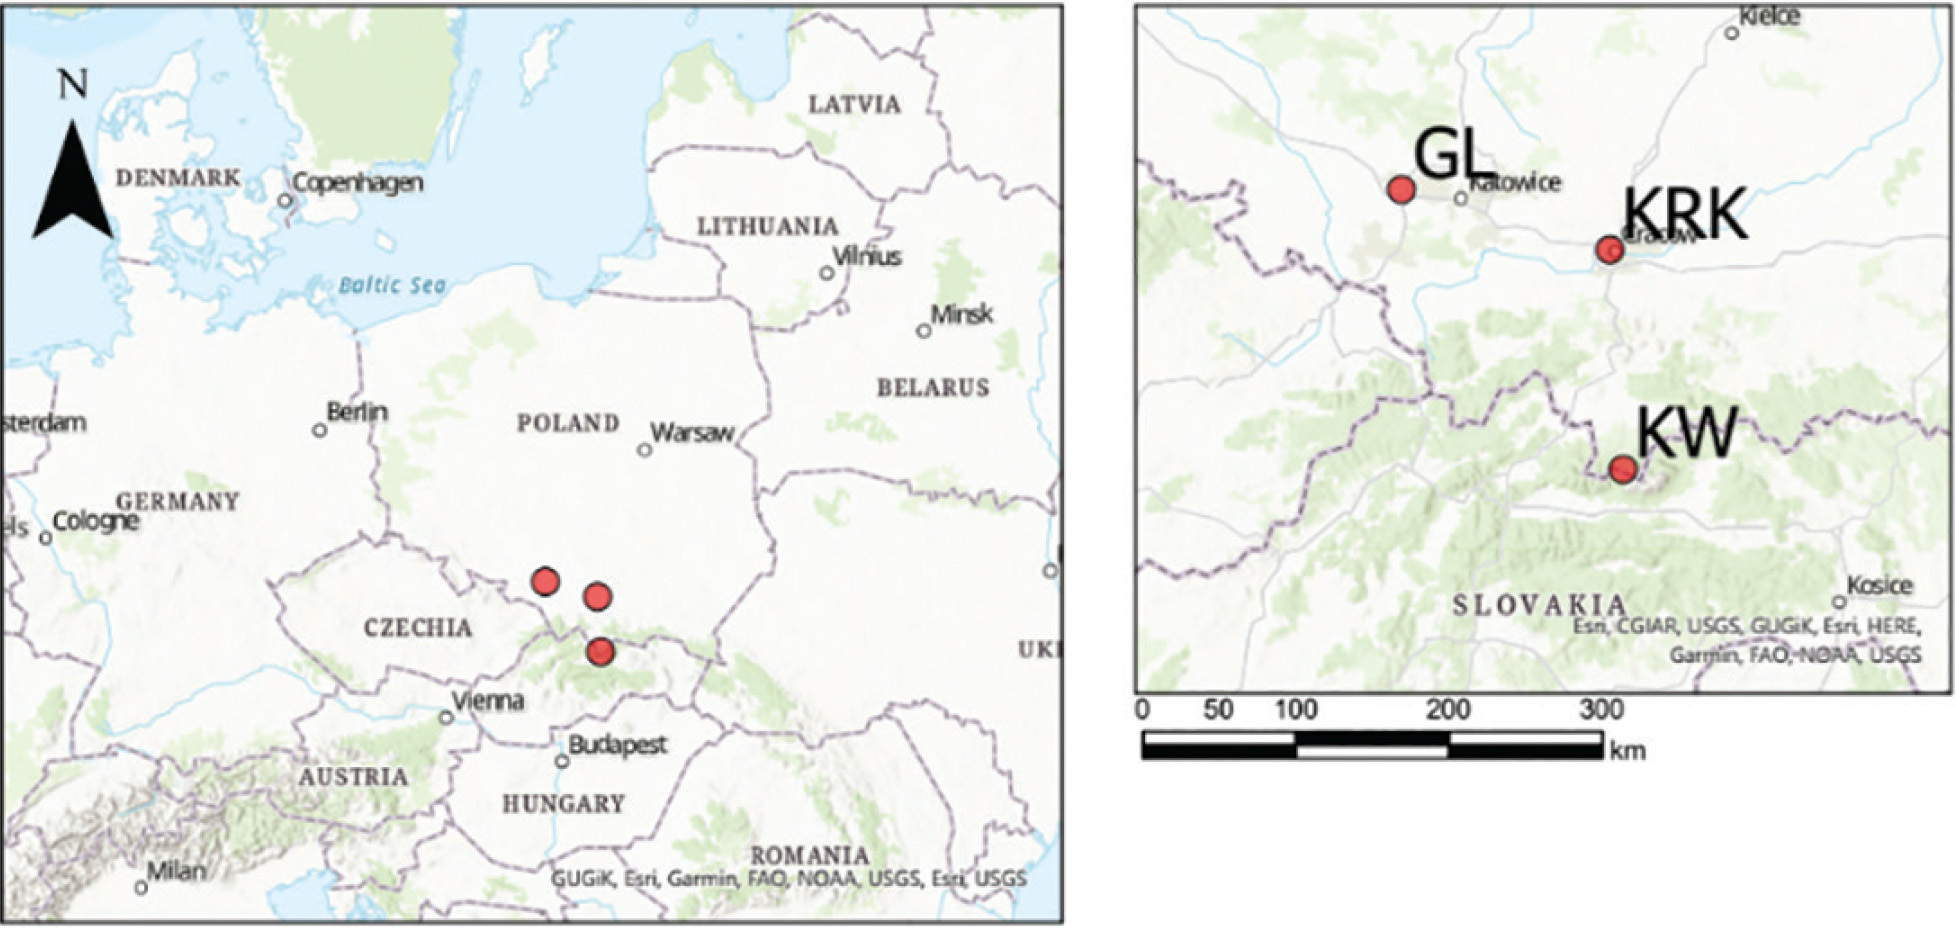
CO2 concentrations were measured in the atmosphere of the city of Gliwice and compared with two other long-operating stations: the Kraków city observatory and the Kasprowy Wierch mountain observatory (Fig. 1).
Fig 1.
The locations of sampling sites in the urban areas (GL, KRK) and in the remote mountain background environment (KW). GL, Gliwice; KRK, Kraków; KW, Kasprowy Wierch.
The analysis of CO2 levels in the Kraków area was initiated in 1984, while at Kasprowy Wierch, it began in 1994. However, in Kraków, the research was not conducted continuously; regular analysis was carried out from 2012 to 2015, followed by a break from 2016 to 2021. Currently, the analysis has been reinitiated. On the other hand, investigations in Kasprowy Wierch have been ongoing since 1994 without interruption. In Gliwice, a new sampling system was established in 2022.
The KASLAB station is located at the peak of Kasprowy Wierch in the Tatra Mountains. The Kasprowy Wierch peak is situated in the convergence area of three valleys (the Kasprowa, Gasienicowa and Dolina Cichej valleys), approximately 300 m above the tree line. Such a position favours the occurrence of anabatic and katabatic winds. The wind statistics indicate the southern and north-eastern wind directions to be the most frequently observed ones. The measurement laboratory is located in the meteorological observatory building. The air intake is installed ca. 2 m above the roof of the building, 1989 m a.s.l. Apart from short episodes related to the use of snow groomers at the top and specific winds from the northern valley, which are filtered out from the measurement record by quality assurance (QA) and quality control (QC) procedures, the station is free from local anthropogenic influences and represents the regional CO2 background.
Krakow, the second-largest Polish city located in Lesser Poland, is populated by almost 1 million inhabitants spread out over an area of 326.8 km2. The city’s area belongs to three geographical regions, i.e. the Polish Uplands, the Western Carpathians and the basin of the Carpathian Foredeep in between. Krakow is located in the Wisla river valley at the altitude of ca. 200 m a.s.l. and is surrounded by highly populated towns and villages located at uplands and hilltops bordering the city and reaching ca. 100 m above the valley floor. In the eastern part of the city, an energy-production and steelworks industry is located. In 2019, the city authorities had banned the use of solid fuels within the city borders, but in the surrounding areas, there are still a number of old-fashioned stoves used for house-heating purposes. Another important anthropogenic CO2 source is the high traffic prevalent within the city area. The measurement site is located in the western part of the city on the AGH University of Krakow campus. The air intake apparatus is installed on the top of 20 m high tower placed on the roof of the faculty building (ca. 40 m a.g.l.).
Gliwice, the third-largest city in the Upper Silesian metropolitan area, has a population of approximately 180,000 residents. It is situated approximately 30 km west of Katowice (with a population of approximately 300,000 inhabitants), 100 km northwest of Kraków, and about 150 km west of the Tatra Mountains. The Upper Silesian metropolitan area represents a typical urban environment characterised by rapid growth in vehicular traffic and significant industrial activities. This region is heavily influenced by large-scale coal mining, steelworks, power plants and chemical factories within the industrial district. The main sources of anthropogenic CO2 emissions in the area stem from the local combustion of coal, gas, oil and bio-mass used for communal and transportation purposes. The measurement site in Gliwice is located on the university campus in the city centre. The air intake device is positioned on the roof of a faculty building, approximately 2 m above the roof and at around 20 m above ground level. The thermal conditions in Gliwice during the investigated period were similar to those in Kraków (as shown in Fig. 2) within the specified timeframe.
Fig 2.
Comparison of the air temperature fluctuation (average, minimal and maximal values) in Gliwice and Kraków since August 2022 until March 2023 (database: IMiGW, meteo.fis.agh.edu.pl, http://www.hydrowskaz.pl/).
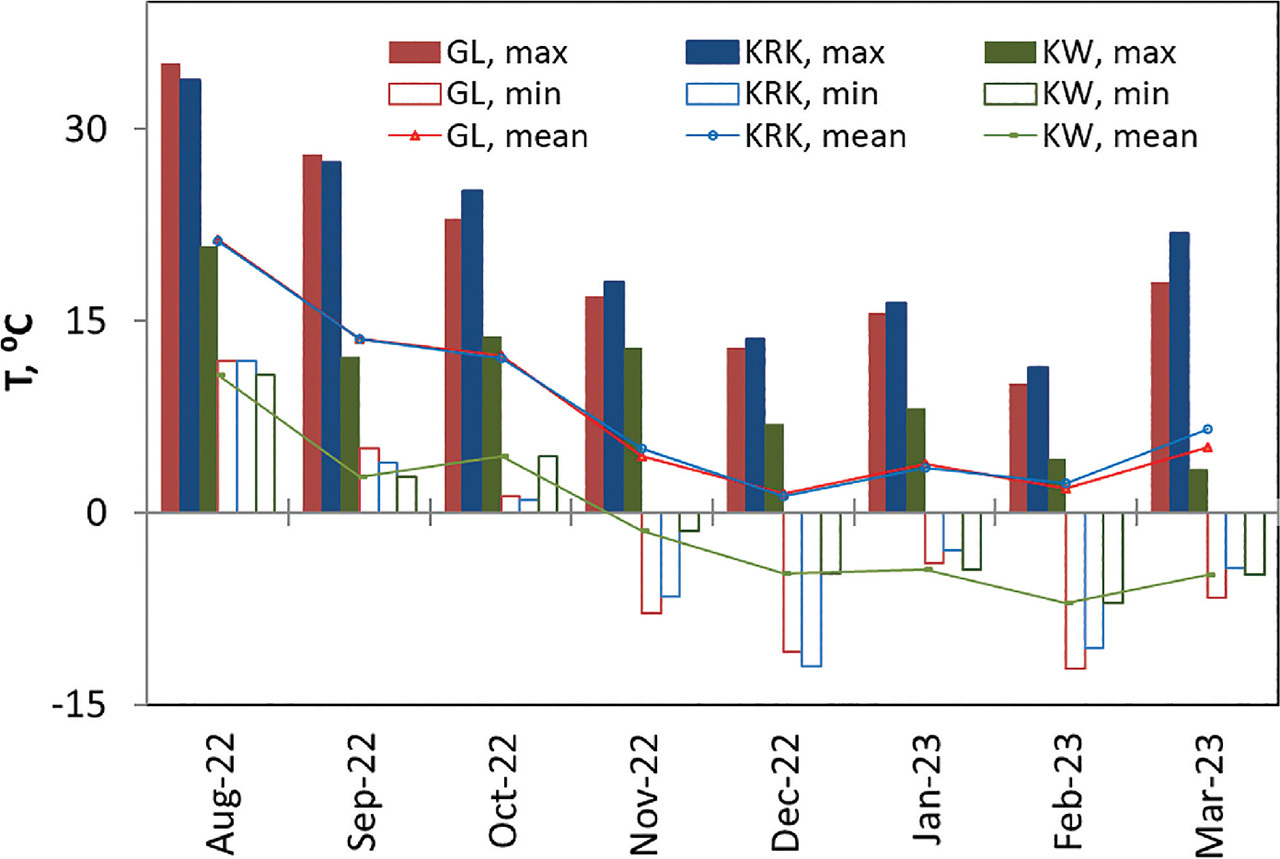
Based on the thermal data obtained from the local meteorological station (Fig. 2), it can be observed that both cities experienced their highest mean temperatures during the summer months, particularly in August 2022. Conversely, the lowest mean temperatures were recorded in winter, occurring in both December and February 2023. A comparison of the thermal conditions between Gliwice and Kraków showed no significant differences between them, suggesting similar temperature patterns in these two locations. This similarity can be attributed to the proximity of the cities, as Gliwice is located only a short distance away from Kraków. The close geographical proximity likely contributes to the comparable thermal conditions observed in the two cities.
. Large-Scale Models
In the same period of time, the data based on the CO2 observations made at Mauna Loa and Maunakea Observatories are presented by Pieter Tans (gml.noaa.gov/ccgg/trends/). The following levels of CO2 have been registered: 417 ppm in August, 416 ppm in September, 416 ppm in October, 417 ppm in November, 419 ppm in December, 419 ppm in January, 420 ppm in February and 421 ppm in March. Due to the eruption of the Mauna Loa volcano, measurements from the Mauna Loa Observatory were suspended as of 29 November 2022. The observations corresponding to December 2022 have their origin in a site at the Maunakea Observatories, approximately 21 miles north of the Mauna Loa Observatory.
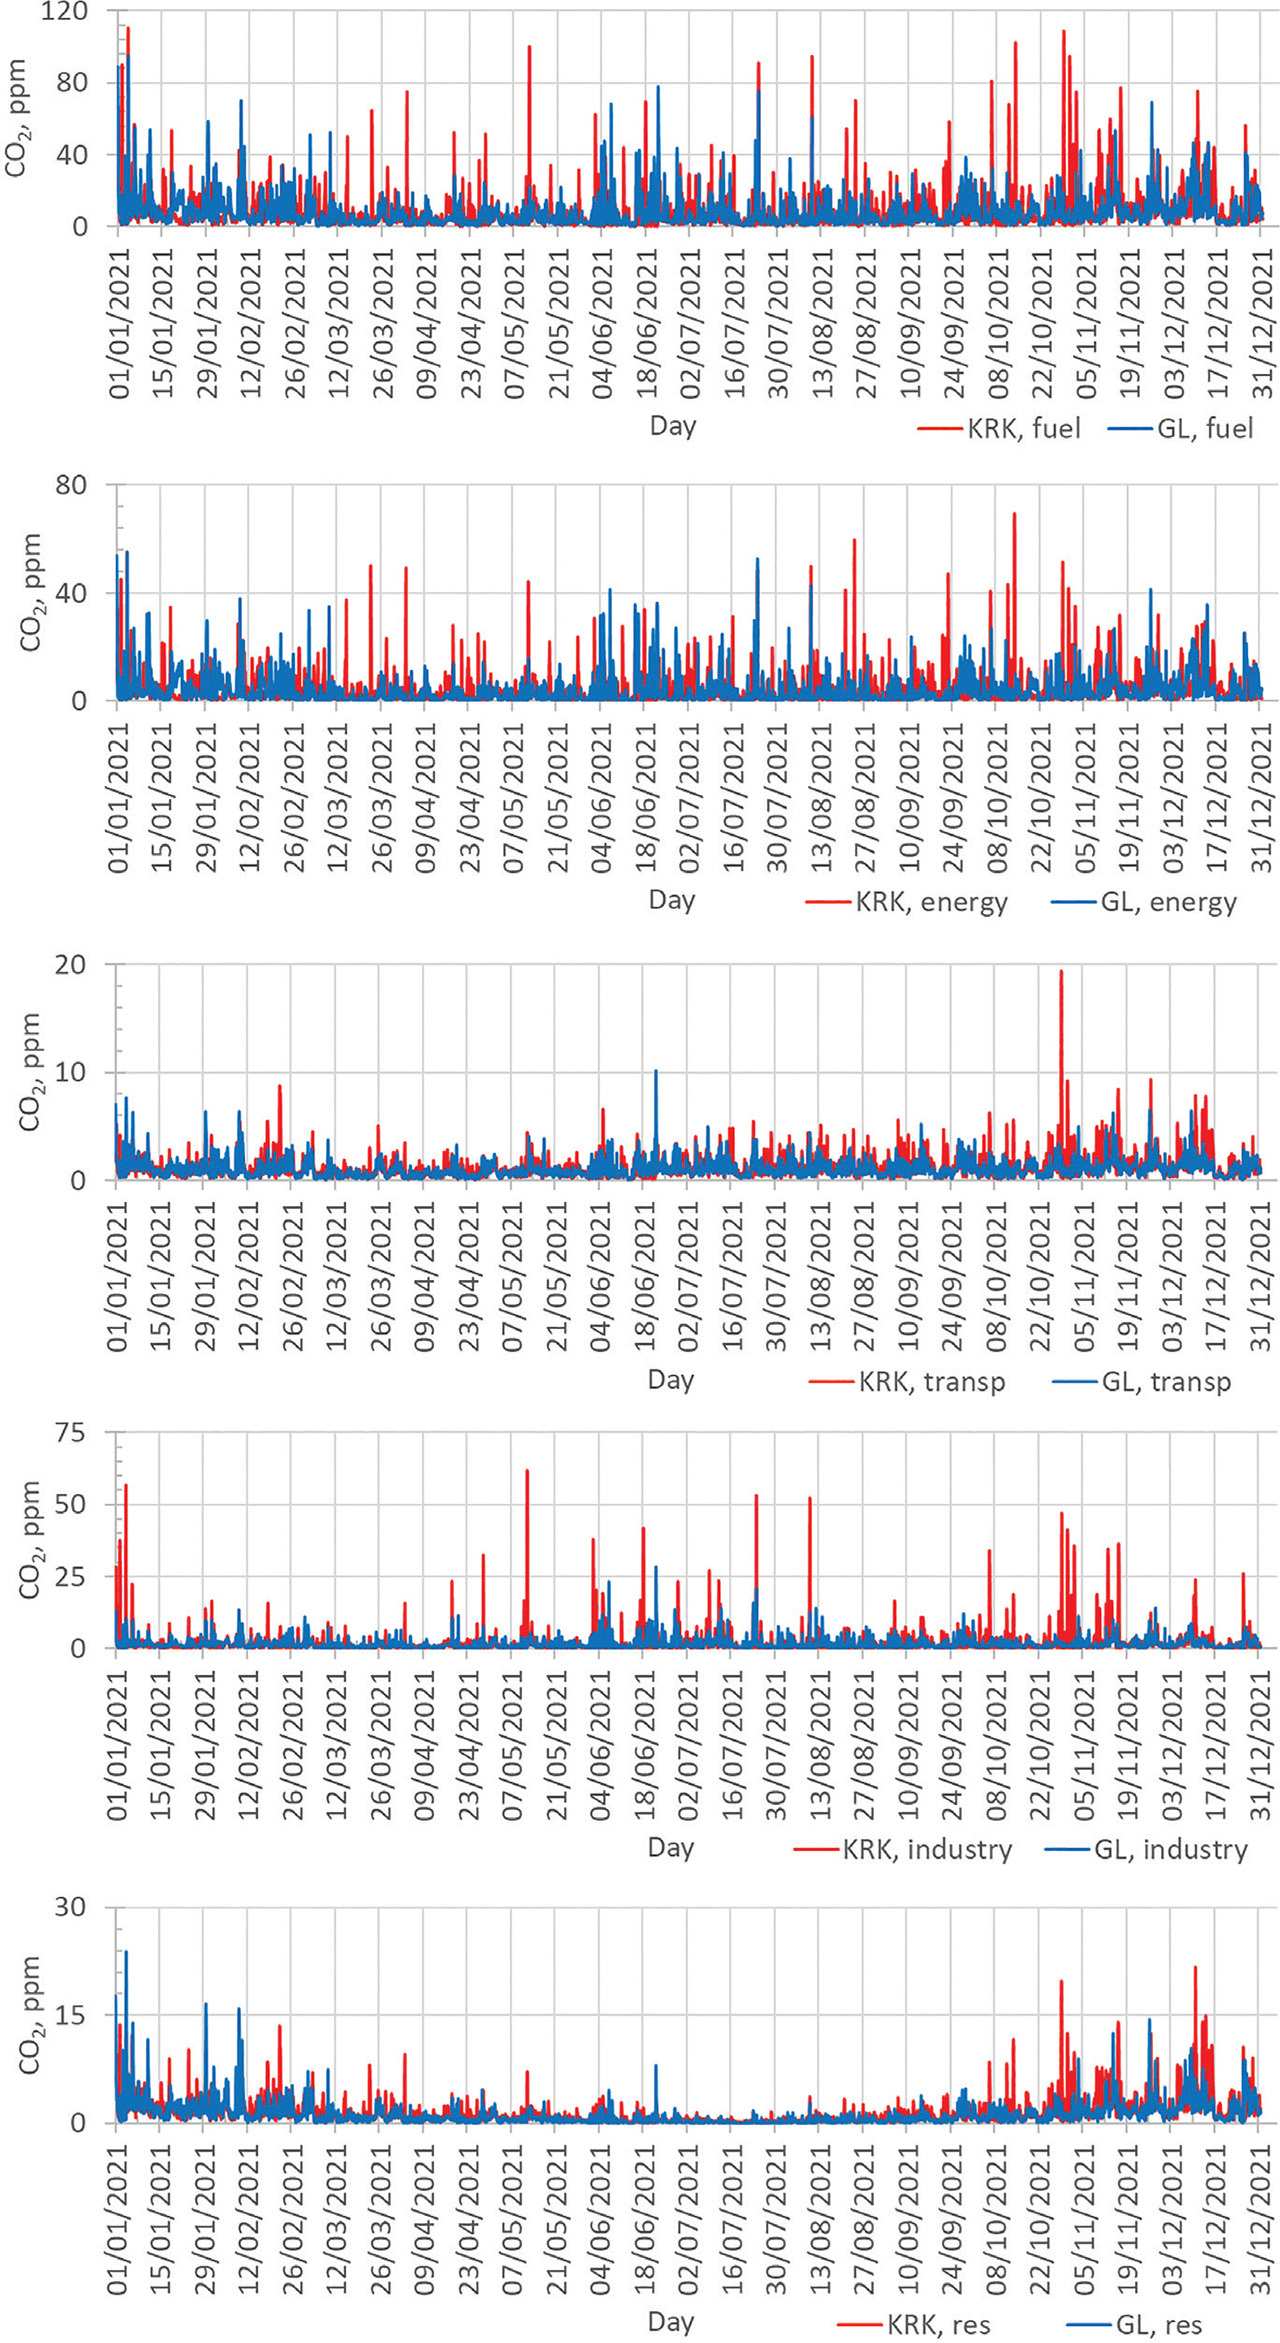
The results presented within the Integrated Carbon Observation System (ICOS) simulation (https://stilt.icos-cp.eu/viewer/) of the biogenic and anthropogenic components of the CO2 air mole fraction indicate that the biogenic component shows convergence in both urban areas, whereas in the case of the fossil components, there are clear differences, which shows the influence of local anthropogenic sources in the source area. In the model simulations given by the ICOS, the contributions from different fluxes are separated into biogenic and anthropogenic factors. The contributions from natural fluxes have been split up into uptake of CO2 by photosynthesis and release of CO2 by respiration. The contributions from anthropogenic emissions are split into total fuel combustion and emissions from different source categories, including energy production, industrial processes, transportation, residential heating and other processes. The data that could cover, and be compared with, measurement data for the investigated period from August 2022 to March 2023 are not available. Examples of the simulation indicating fluxes from the different sources in 2021 in both urban areas are given (Figs. 3 and 4).
Fig 3.
The contributions of biogenic components to the CO2 air mole fraction observed in Gliwice and Krakow for 2021, based on biospheric model simulation. The contributions from natural fluxes have been split into the uptake of CO2 by photosynthesis – bio.gee – and release of CO2 by respiration – bio.resp (data from https://stilt.icos-cp.eu/viewer/).
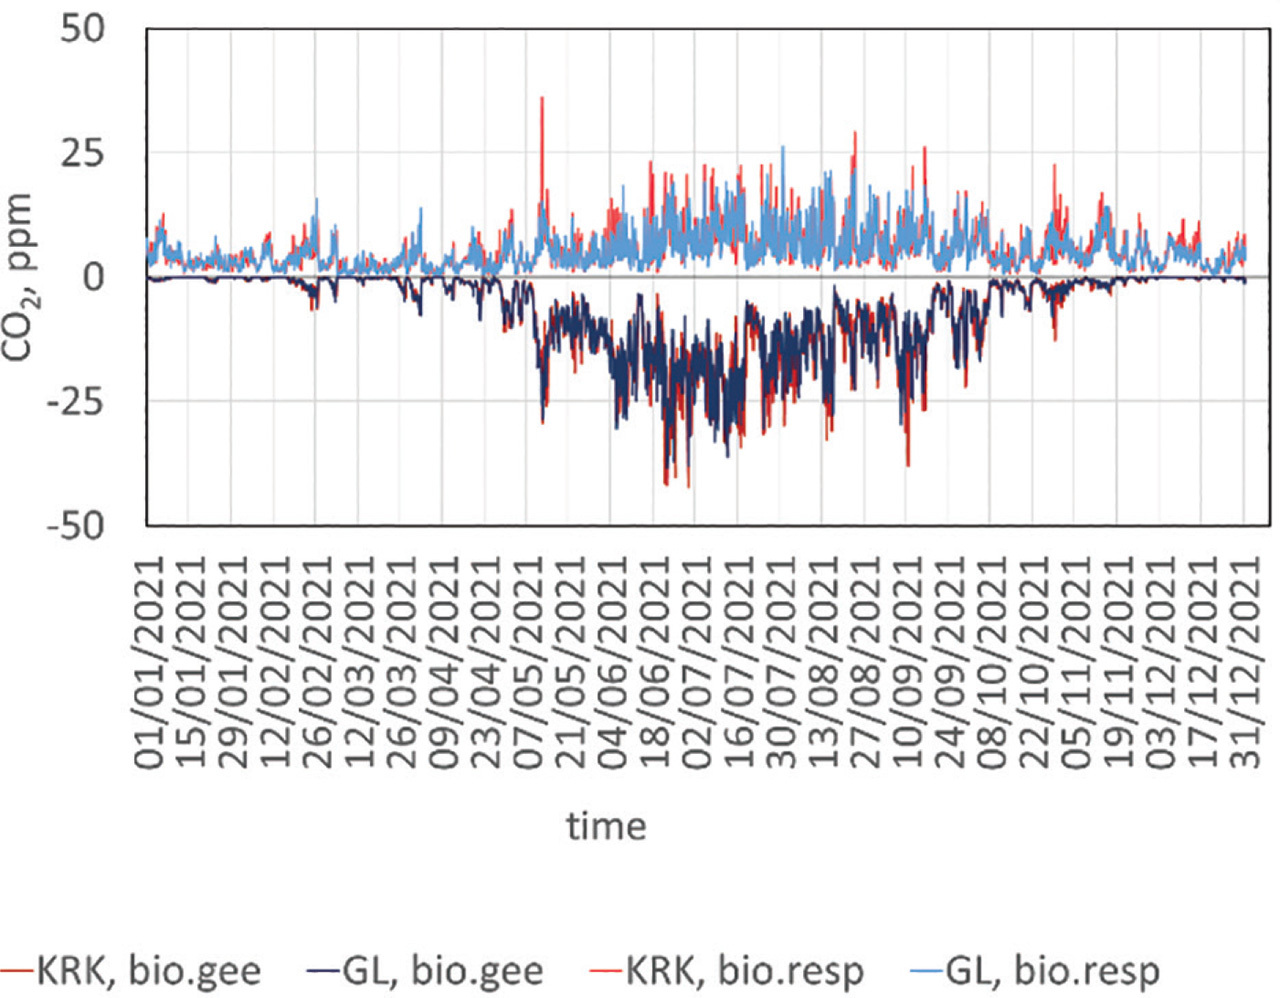
Fig 4.
The contributions of anthropogenic emissions from different sectors to the CO2 air mole fraction observed in Gliwice and Krakow for 2021 split into total fuel combustion (fuel) and emissions from different main source categories, including energy production (energy), industrial processes (industry), transportation (transport) and residential heating (res).
. Methods
At the Silesian University of Technology site in Gliwice, the continuous measurement of atmospheric CO2 began in August 2022. To measure the mole fraction of CO2, the CARBOCAP GMP-343 probe (Vaisala, Finland) was employed, capable of connecting to three different registers: MI70, DL2 and directly to a computer. The GMP-343 probe was equipped with a built-in temperature sensor, allowing for appropriate correction of optical cavity variations. At the AGH stations, measurements were conducted using Cavity ring-down spectroscopy (CRDS) analysers, specifically the Piccaro (USA) G-2311-f and G-2101-i spectrometers.
Meteorological data were obtained from local meteorological stations in Gliwice. Until February, data were collected from the Hydrowskaz platform, and from February 2022 onwards, data were obtained from the database from the local meteorological station installed on the roof the building of the Faculty of Environmental Engineering and Power Engineering (The Silesian University of Technology, http://www.hydrowskaz.pl/) and from the Institute of Meteorology and Water Management (IMiGW) for the closest location, Katowice (https://dane.imgw.pl/datastore). It is worth noting that the pressure difference between Gliwice and Katowice was approximately 1 hPa. Meteorological data for Krakow were obtained from the local meteorological station (Vaisala WXT520) installed on the roof of the building of the Faculty of Physics and Applied Computer Science, AGH University of Science and Technology, where CO2 air intake is located (meteo.fis.agh.edu.pl).
All CO2 concentration data are reported in accordance with the established standardised scale (https://gml.noaa.gov/ccgg/trends/). The concentration is presented as the mole fraction of dry air, defined as the number of carbon dioxide molecules divided by the total number of molecules in the air after removing water vapour.
. Calibration of the GMP-343 Probe at the Silesian University of Technology
The preliminary data collected for the summer and autumn of 2022 (Sensuła, 2023; Sensuła et al., 2023a,b) have revealed a lower level of CO2 in the centre of Gliwice city compared to the relatively clean region of Kasprowy Wierch. This disparity prompted further recalibrations to verify the parameters of all the metres used in Gliwice since the previous summer.
According to the manufacturer’s specifications, each CARBOCAP GMP343 probe is calibrated using ±0.5% accurate gases at various concentrations. In the range of 370–420 ppm, the expected accuracy is approximately 2 ppm. Calibration of the instrument using reference gases in May 2023 showed relatively low standard deviations (approximately 2 ppm) for each reference gas. However, there was a notable difference between the data recorded by the two loggers (analogue and digital) compared to the expected CO2 levels in the reference gases.
It is important to mention that the concentration of CO2 in the reference gases is regularly monitored. To recheck the parameters of the CARBOCAP GMP343 probe, the same reference gases were simultaneously measured using a Piccaro spectrometer in Kraków. The CO2 concentrations measured by the Piccaro spectrometers were found to be in agreement with the recommended values provided by the manufacturer.
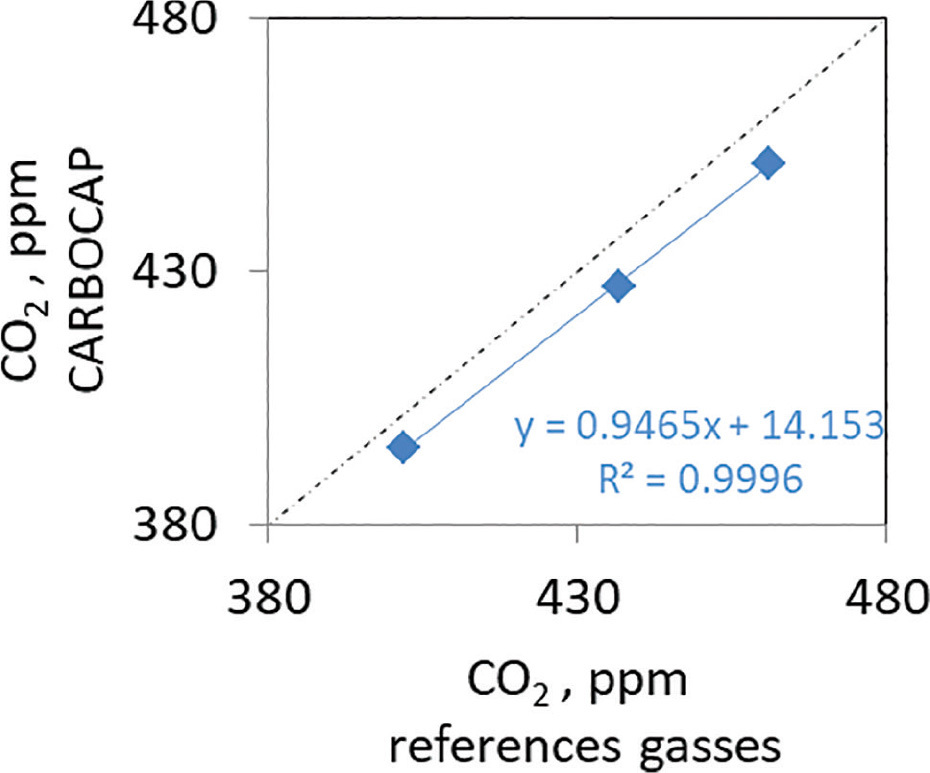
The first discrepancy in the results obtained from the CARBOCAP GMP343 probe was observed between the data recorded by the analogue logger (DL2) and that by the digital recorder (MI70 as indicator and display). This constant shift amounted to 6.9 ppm over time, indicating an underestimation of CO2 levels in all data from the analogue record. Furthermore, multipoint calibration revealed that all digital records were further underestimated by approximately 7–10 ppm compared to the three reference gases (Fig. 5), which had CO2 concentrations of 402 ppm, 436 ppm and 461 ppm, respectively. These reference gas concentrations were declared by the manufacturer and verified using the Piccaro spectrophotometer.
In the research and analysis, the following corrections were applied to the raw CO2 data obtained from the digital recorder, with their respective effects on precision:
Correction for underestimation by the digital recorder: +6.9 ppm. This correction was necessary to account for the consistent underestimation of CO2 levels in the data recorded by the digital device.
Correction based on the response function of the calibration curve: This correction was made to address the underestimation of data compared to the reference gases. The specific effect on precision varied depending on the calibration curve’s response function.
Compensation for the effects of humidity and oxygen: The accuracy of the CO2 measurements was affected by humidity and oxygen levels. Humidity compensation ranged between ±0.006% of the reading/g/m3 H2O below 1000 ppm CO2 (not exceeding 0.25% of the reading), while oxygen compensation was −0.09% of the reading/%O2 (not exceeding 0.2% of the reading).
Compensation for the effect of temperature: Temperature compensation was necessary due to the impact of temperature on accuracy. The range of compensation varied between 1% and 3% of the reading, as specified in the user guide, with a minimum compensation of 10 ppm. Temperature compensation was performed using an integrated Pt1000 element.
Pressure compensation: After measurement, pressure compensation was applied using the formula provided by the manufacturer. In many cases, if the temperature compensation of the GMP-343 was activated, pressure compensation alone was sufficient.
These corrections and compensations were implemented to ensure the accuracy and precision of the CO2 measurements and to account for various factors that could influence the recorded data.
where parameters (1000 ppm range), are equal, respectively, to the following:The iteration loop is repeated until i = 10.
Thus, the effect of pressure on the accuracy range is between 0.5% and 1% of reading (according to https://www.manualsdir.com/manuals/408536/vaisala-gmp343.html).
All data collected since August 2022 have undergone recalculation with the aforementioned corrections and their associated effects on accuracy. The shift between the raw results obtained from the analogue register, including the correction for pressure compensation, could be up to approximately 40 ppm for individual data points. The uncertainty of the new single results, after applying all corrections and compensations, does not exceed 12 ppm. This includes the mode of operation mentioned earlier, with adjustments made for ambient pressure compensations. For instrument calibration, it is recommended to follow a three-step process. Firstly, using the analogue signal register as the display, the metres should be checked and verified to ensure consistency with the digital signal. Any discrepancies should be taken into account when correcting the data. Secondly, for long-term analysis, it is advisable to utilise temperature compensation performed by an integrated Pt1000 element. The fixed value for pressure compensation should be turned off and the environmental pressure data from other metres should be considered, applying the formula provided by the manufacturer. Lastly, it is recommended to calibrate the instruments more frequently than the manufacturer’s recommended interval. The preliminary results indicate that calibration should be performed more often, as a shift of approximately 10 ppm was observed after just a few months.
Following these calibration steps and considering the necessary corrections and compensations ensure accurate and precise CO2 measurements and help maintain the reliability of the collected data.
. Results and Discussion
Figs. 6 and 7 reveal the mean diurnal and monthly averaged CO2 air mole fractions in Gliwice, Kraków, and Kasprowy Wierch for each month, from 1 August 2022 to 31 March 2023. The observed increase of CO2 levels at Kasprowy Wierch (Fig. 7 and Table 1) reflects a part of the background seasonal variability signal representing CO2 build-up stimulated by a decrease of assimilation activity of the biosphere and an increase of anthropogenic emissions specific for late summer, fall and winter periods. The figures clearly show the overall rise of CO2 in the atmosphere, with noticeable diurnal, monthly and seasonal variations in urban areas. The standard deviation of monthly results during summer and fall, which coincide with the vegetation period, further confirms the higher diurnal variation in CO2 compared to winter and early spring when the biosphere is less active.
Fig 6.
Average diurnal changes of CO2 air mole fraction presented as the 2-h means in GL, KRK and KW from 1 August 2022 to 31 March 2023 and a variability of the results based on SD. GL, Gliwice; KRK, Kraków; KW, Kasprowy Wierch; SD, standard deviation.
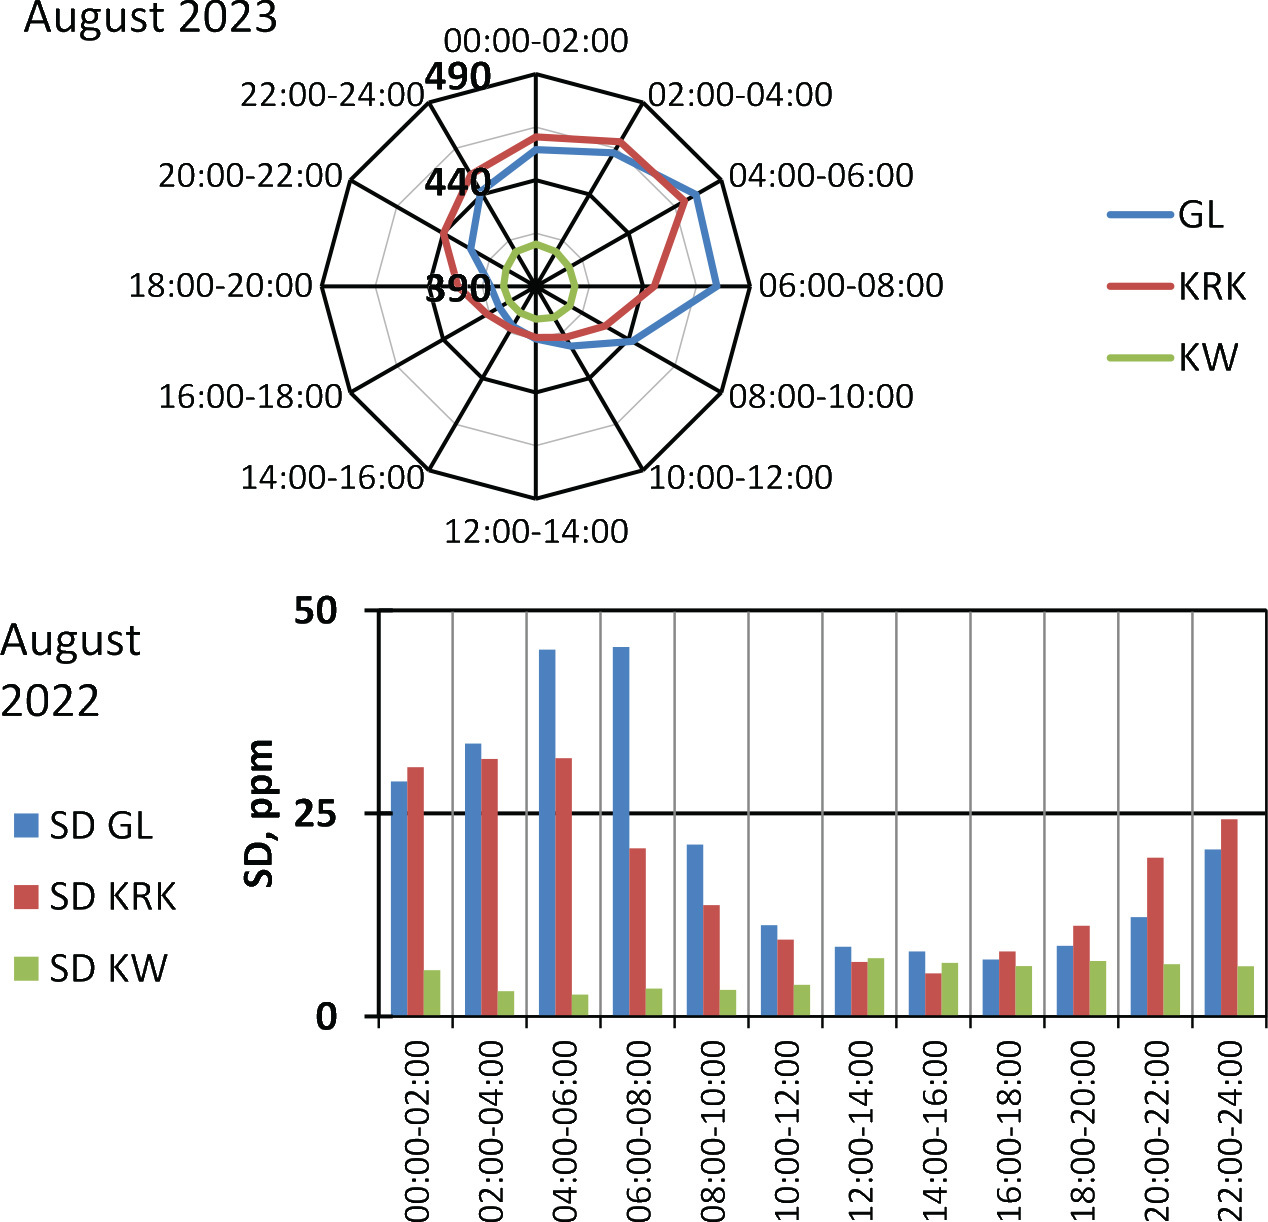
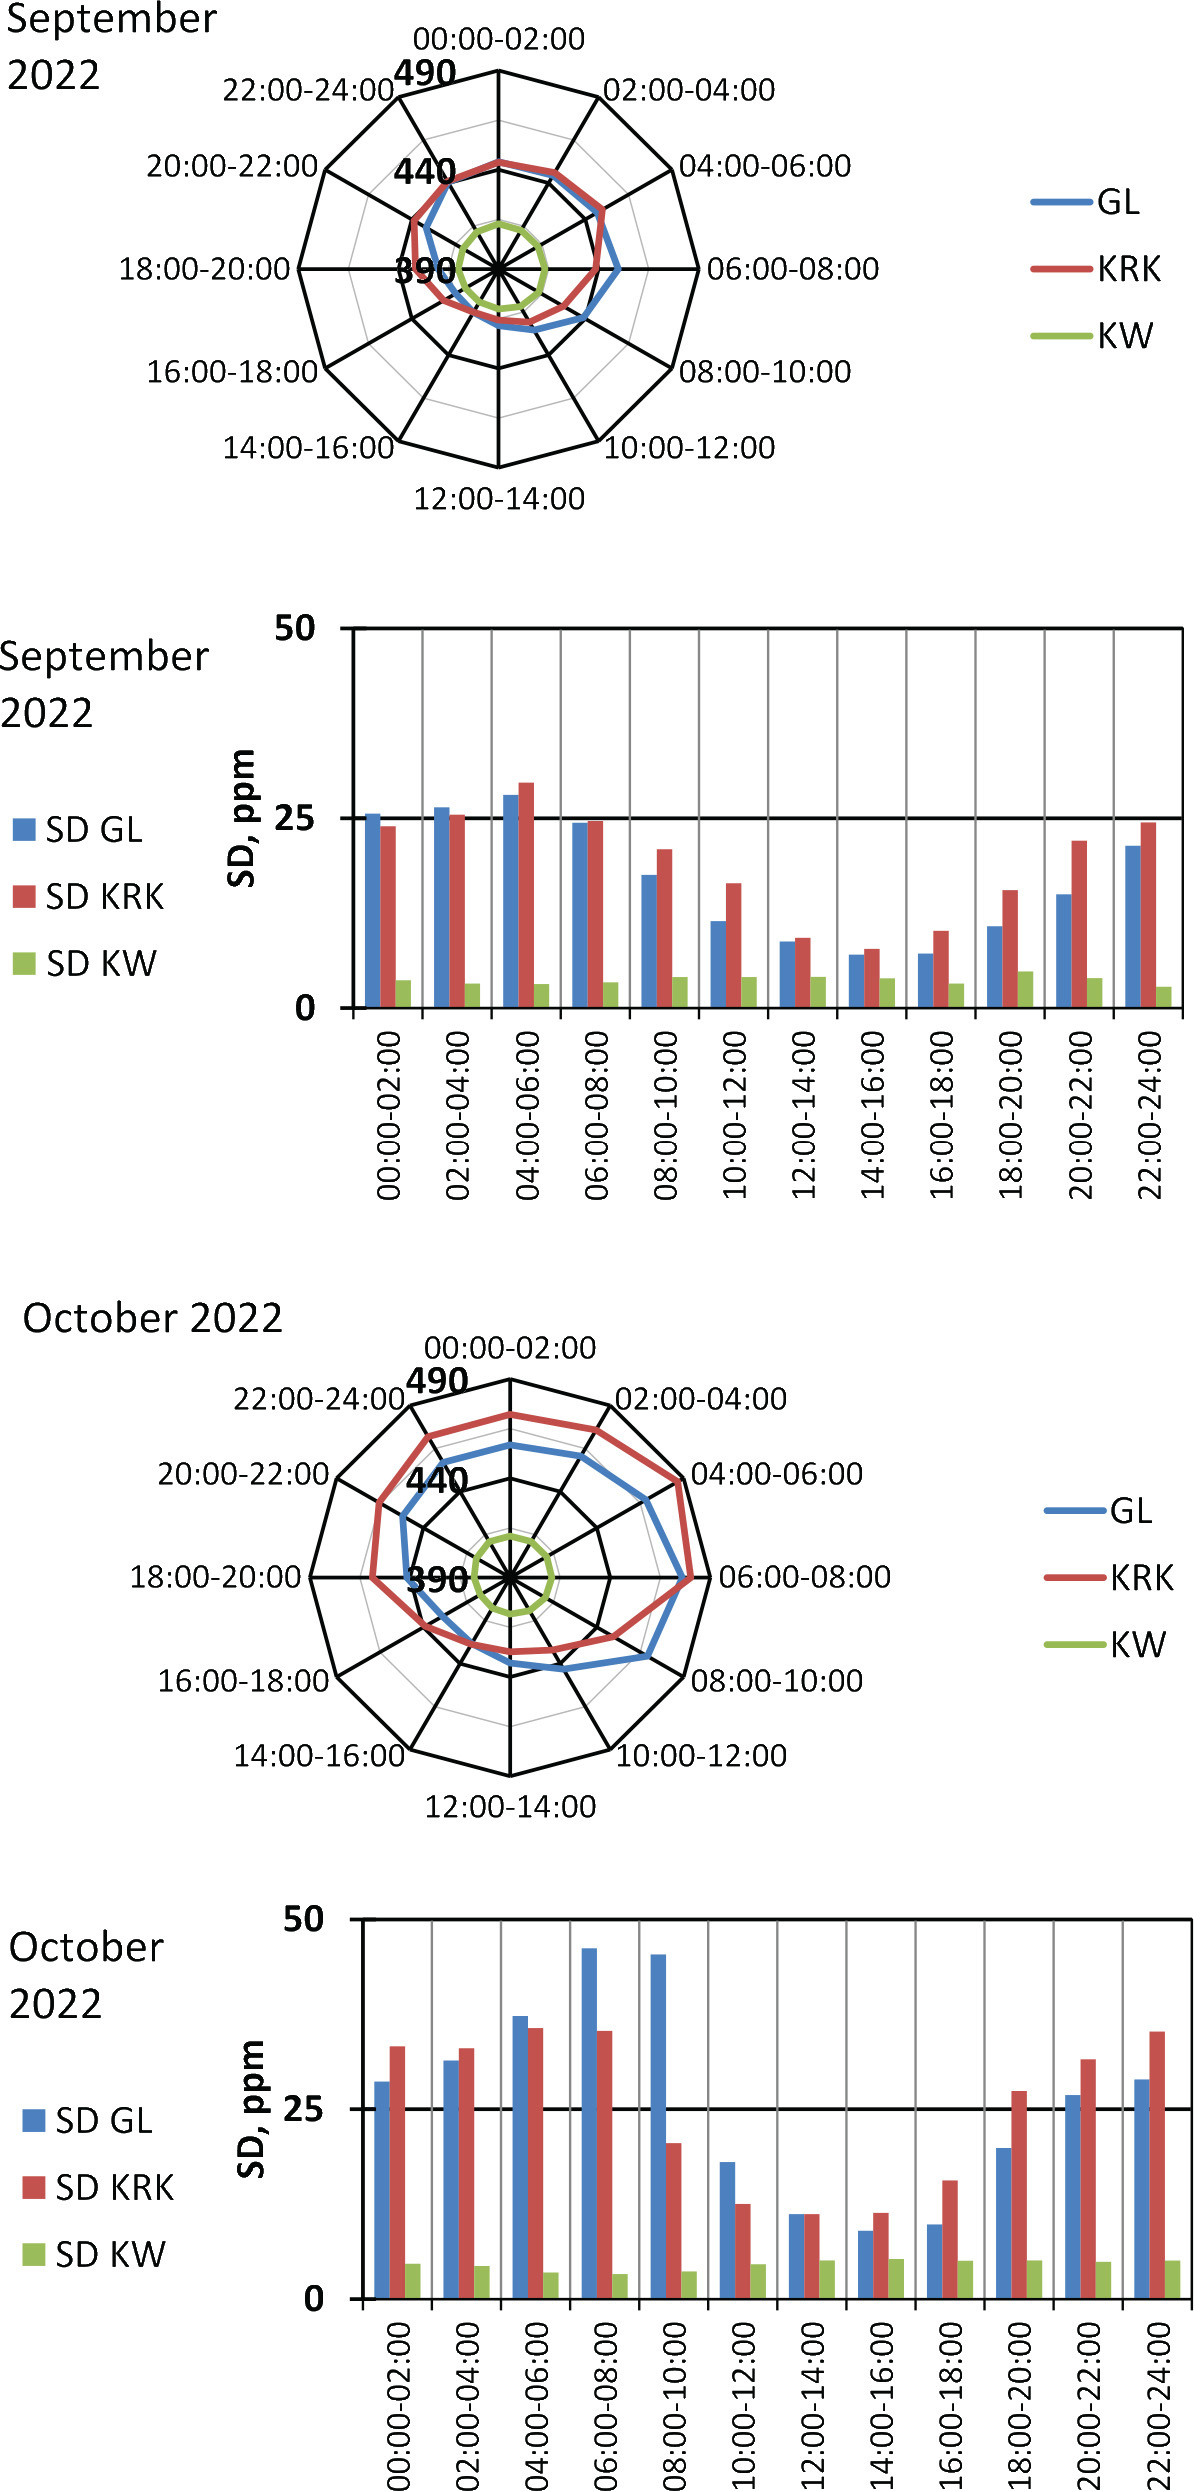
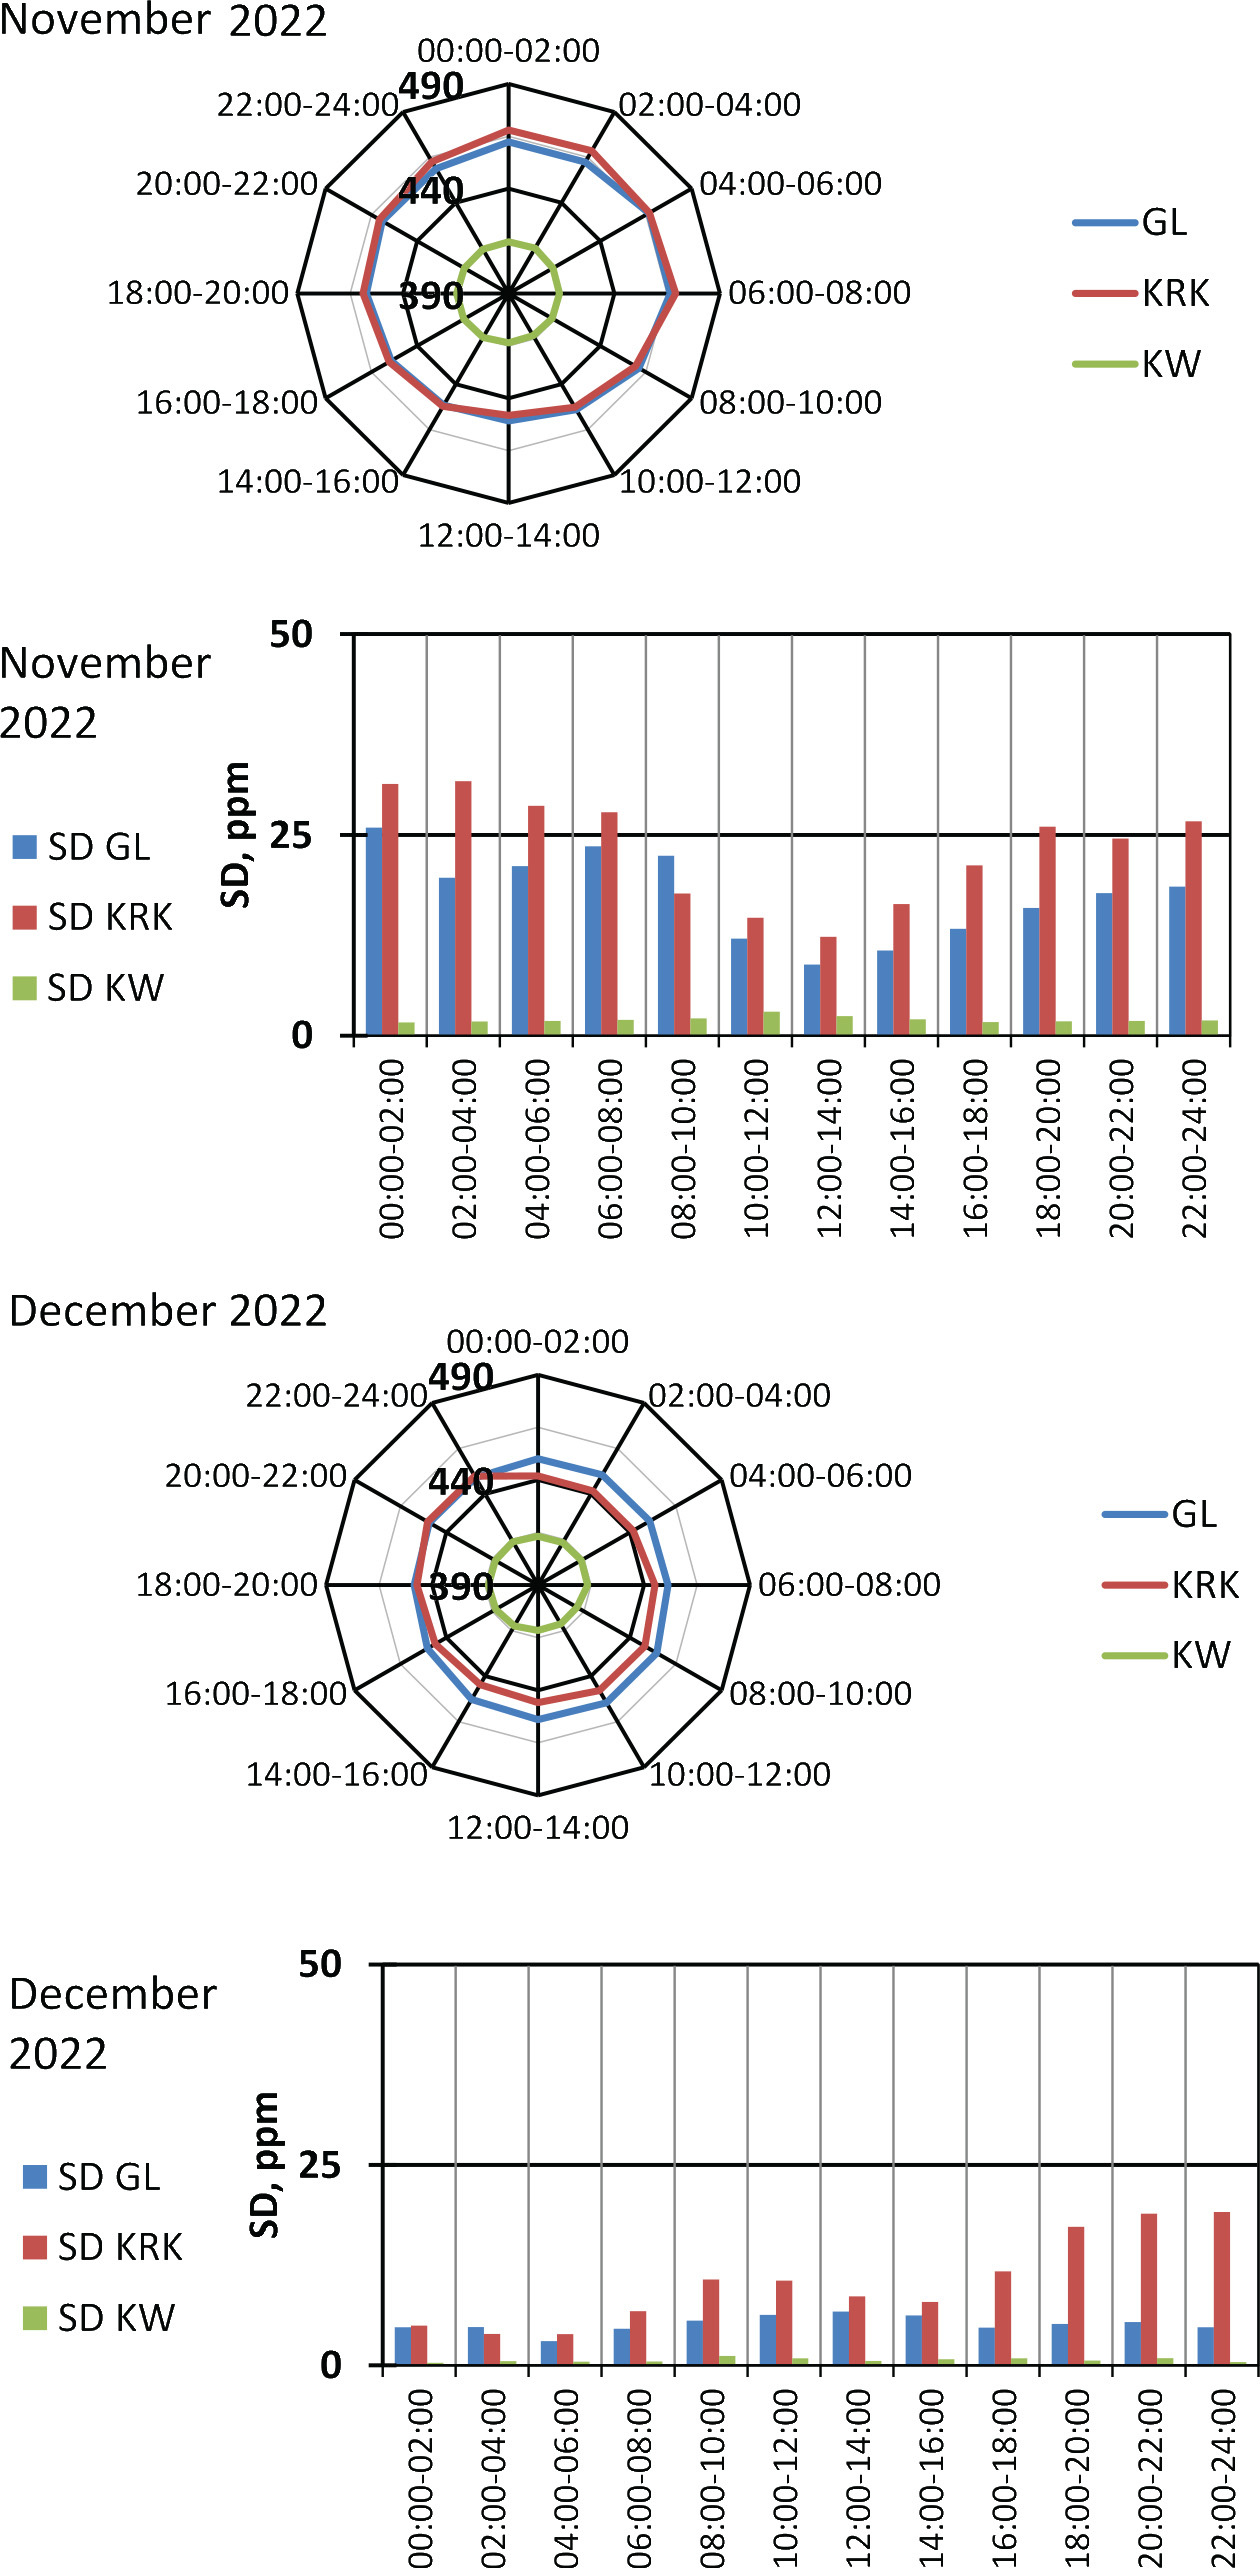
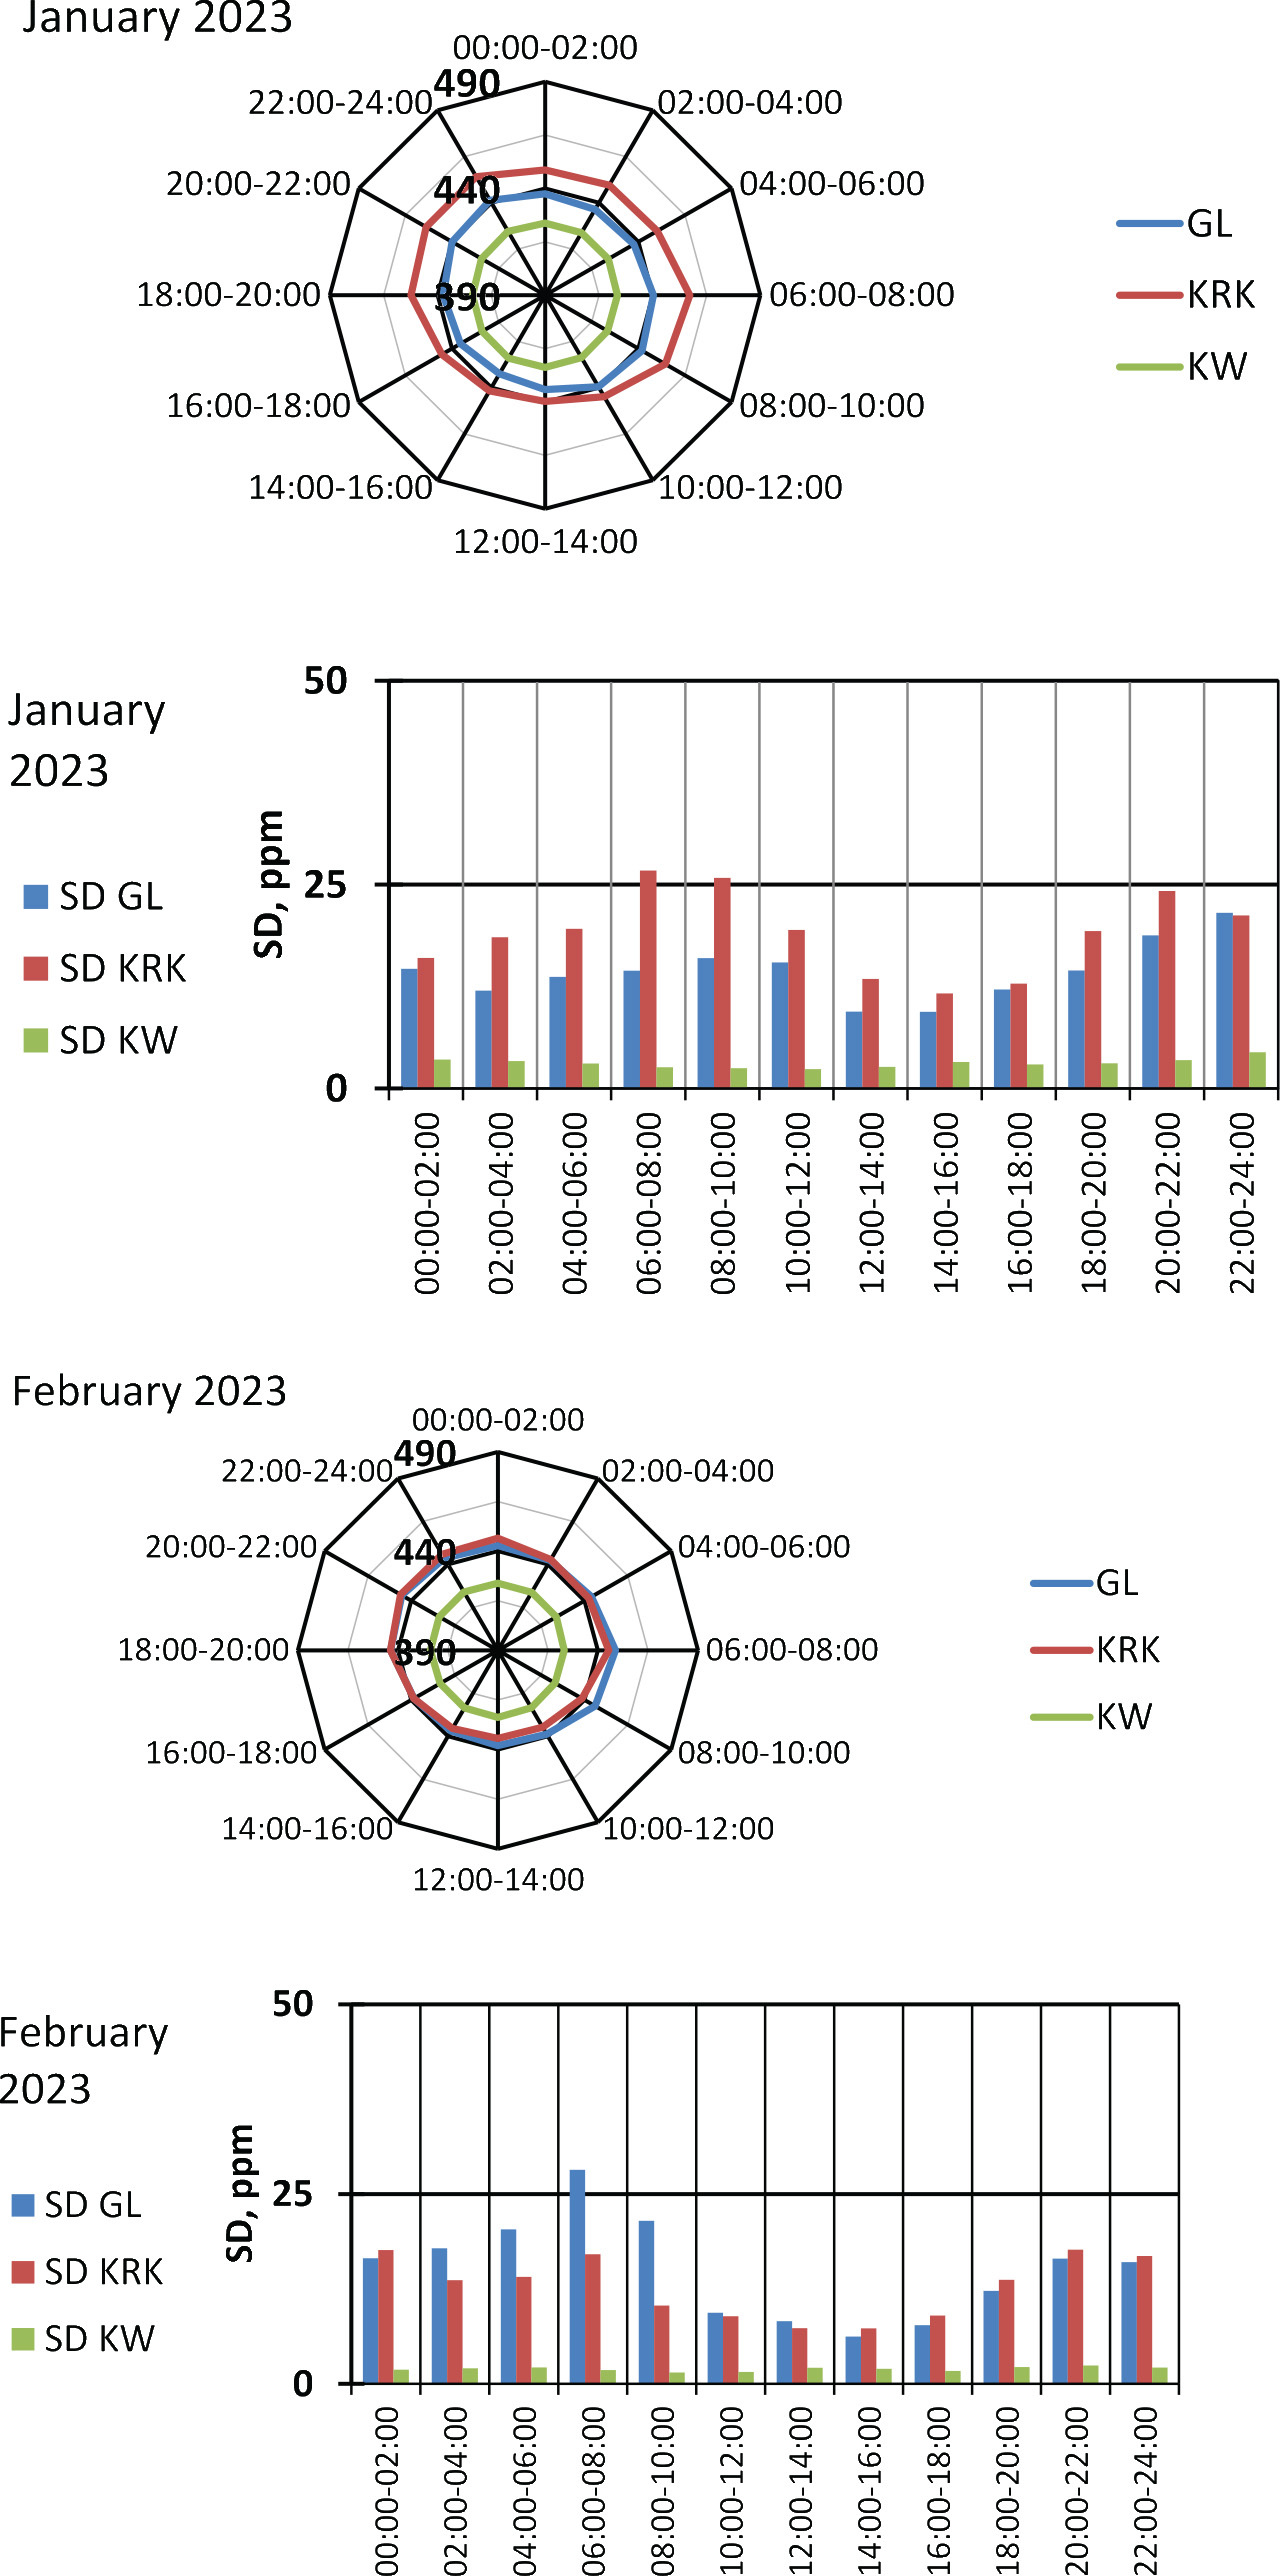
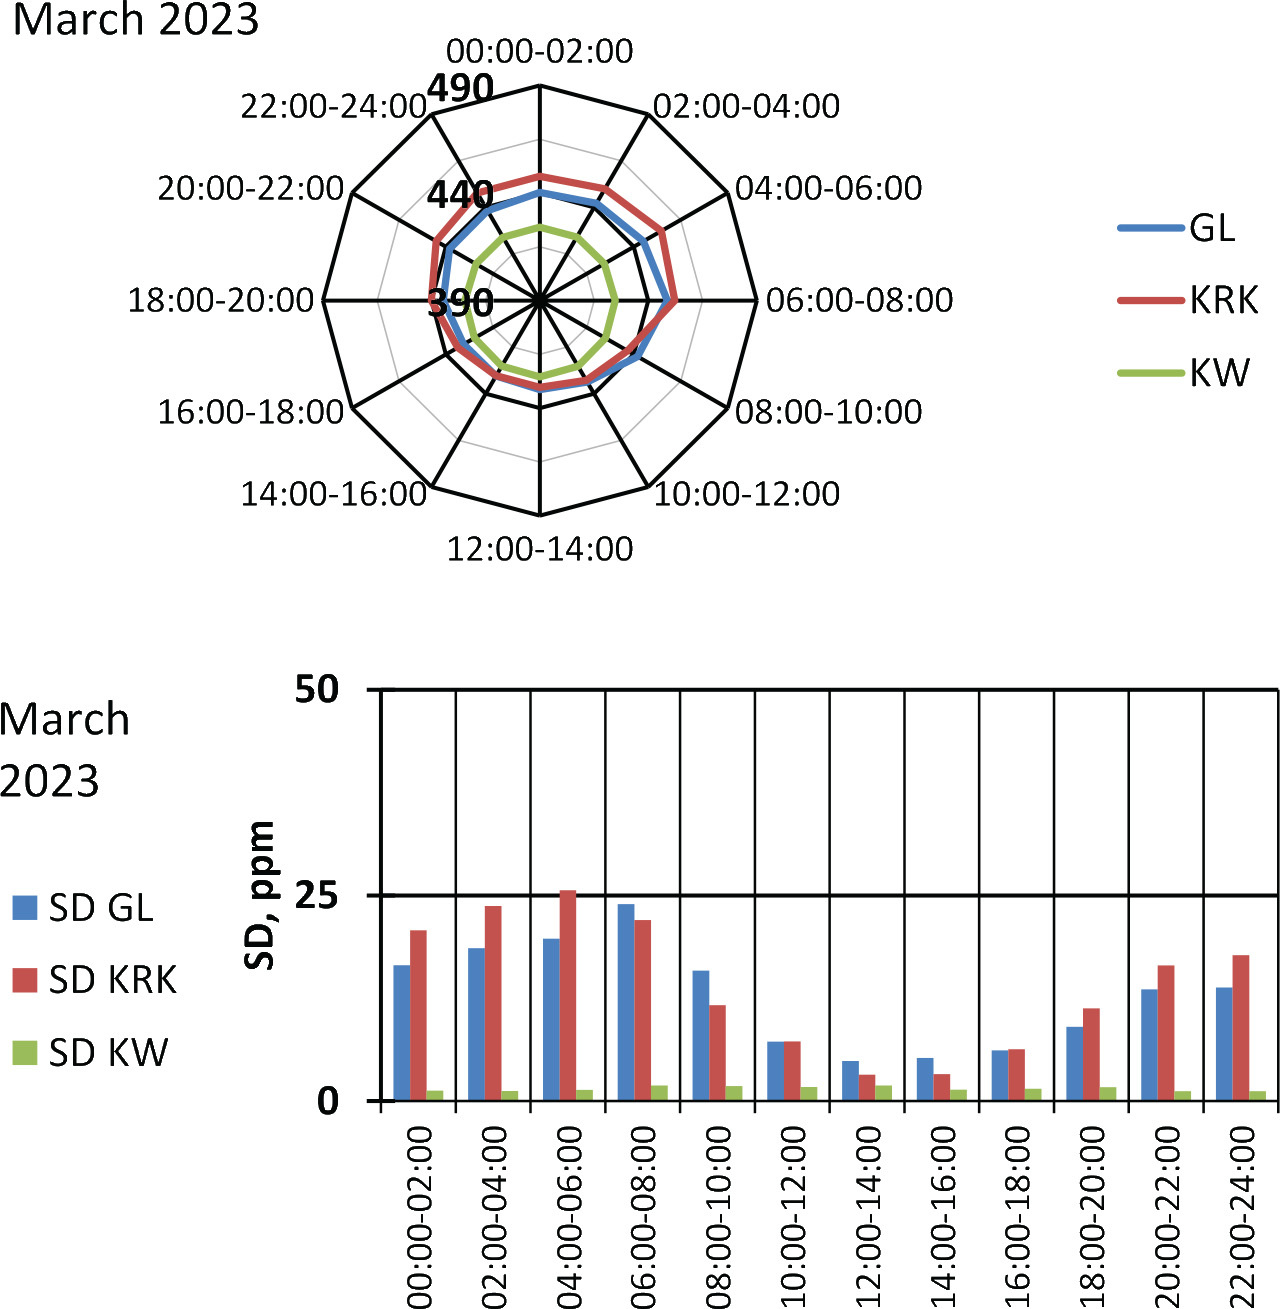
Fig 7.
The monthly average of the CO2 air mole fraction in Gliwice, Kraków, and Kasprowy Wierch from 1 August 2022 to 31 March 2023.
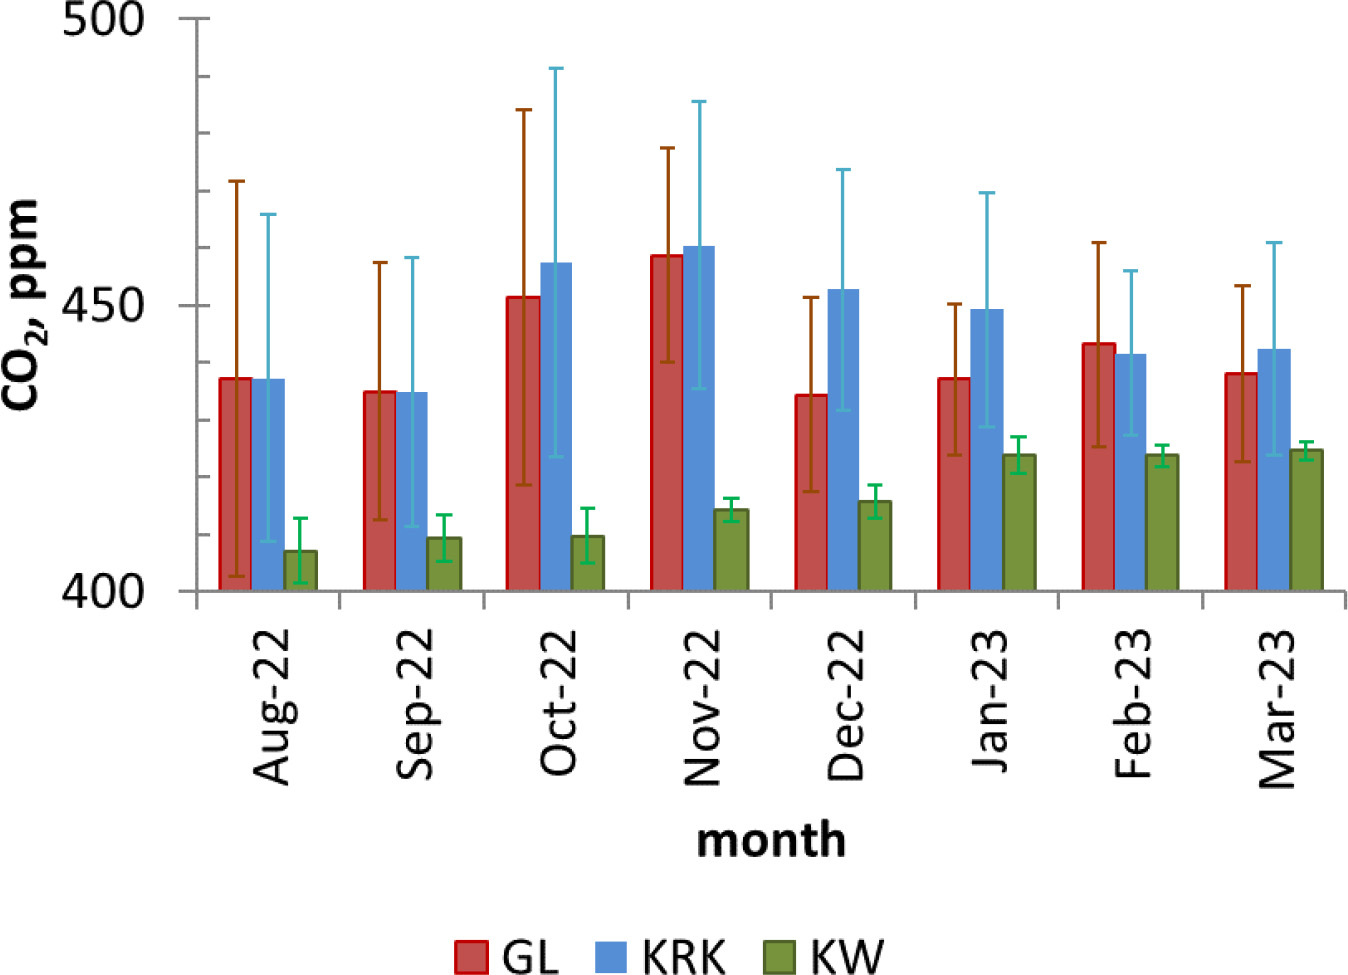
Fig 8.
An example of similarities and contrasts between the diurnal temperature and CO2 air mole fraction levels in the winter and summer seasons in urban areas (Gliwice and Kraków) compared to the mountain regional background site (Kasprowy Wierch) based on (A) day-to-day (B) hour-by-hour comparisons, respectively.
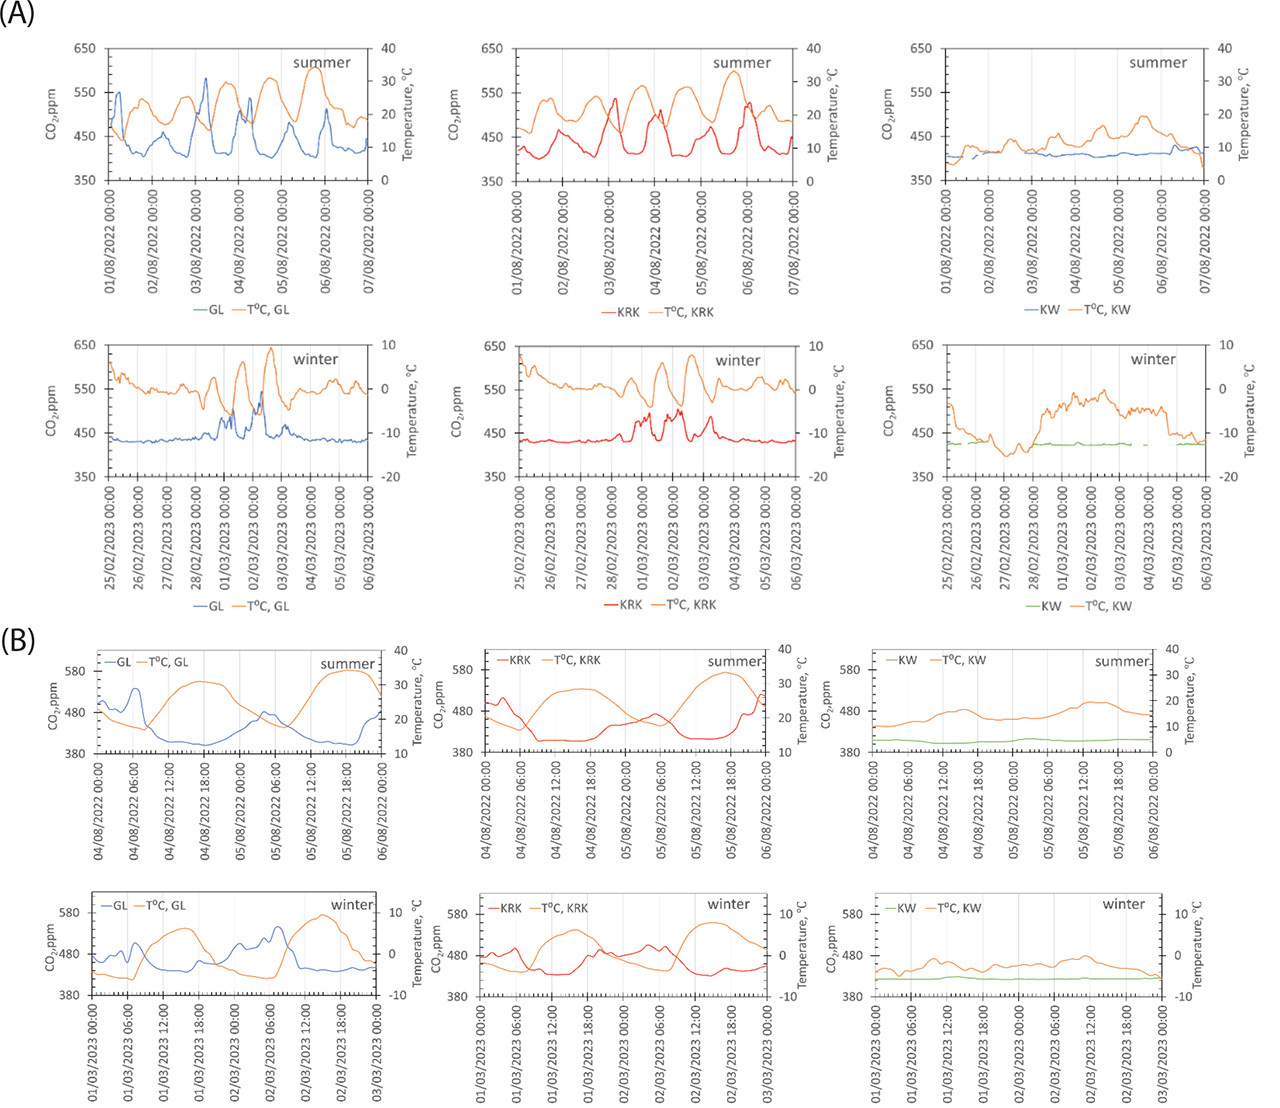
Table 1.
Thermal conditions (minimal, maximal and mean air temperature) and mean value of the CO2 air mole fraction in Gliwice, Kraków, and Kasprowy Wierch from 1 August 2022 to 31 March 2023.
A noteworthy relationship between temperature and CO2 levels in the air is observed. In Kraków, local peaks in CO2 concentration are observed during nocturnal temperature inversions in the lower troposphere, particularly in summer. On the other hand, Kasprowy Wierch exhibits less variation in the diurnal dynamics of CO2 during summer and fall. During winter, higher CO2 levels are associated with lower air temperatures, particularly when frost occurs. However, when considering the mean values and the scatter of the results (1σ), no significant differences in monthly mean CO2 values are observed between Kraków and Gliwice. The scatter of the monthly mean CO2 levels is evident in both urban areas (Gliwice and Kraków). Nevertheless, when analysing individual days or hours, the differences between the two sites become more apparent.
These findings highlight the complex relationship between CO2 levels, temperature and urban environments. The data suggest that while both cities exhibit similar monthly mean CO2 values, there are distinct variations in diurnal patterns and seasonal dynamics. Further investigation and analysis of these patterns will contribute to a better understanding of the factors influencing CO2 concentrations in urban and mountainous regions.
The previous studies performed in Krakow (Zimnoch et al., 2004, 2018, 2019) show that the main contributions to observed CO2 levels in urban areas are associated with biosphere resporation (summer season) and anthropogenic emissions (winter season). The results analysed in this study confirm these findings; however, a comparison of two different urban environments (Krakow and Gliwice) showing a great similarity in trends allows for a broader view of the impact of urbanised areas on the observed CO2 levels.
The much lower variability observed at the Kasprowy Wierch station is due to the location of the measurement point most of the time above the boundary layer, which is seen separating the station from the direct influences of nearby CO2 emission sources (Necki et al., 2016). Some influence is present due to the anabatic winds occurring in this area; however, the data-flagging procedures developed for this site allow for the significant reduction of these signals (Necki et al., 2003).
In 2022 and 2023, in both the urban areas, Gliwice and Kraków, the impact of various factors on CO2 is evident. In Gliwice, the mean difference between nocturnal and daytime CO2 levels varied throughout the months, confirming that these results were due to the impact of the anthropogenic (including different fuels’ combustion from different sources) and biogenic factors, including photosynthesis and respiration, in the past years. Unfortunately, the models presented by the ICOS are limited and do not cover the period of time for the measurements conducted within these studies.
For example, in August, the difference was approximately 70 ppm, while in September, it was around 35 ppm. In October, the difference increased to approximately 50 ppm, followed by a decrease to 16 ppm in November. In December, the difference was around 6 ppm, and in January and February, it was approximately 10 ppm. In March, the difference was around 18 ppm. Similarly, in Kraków, the mean difference between nocturnal and daytime CO2 levels showed a similar pattern, with values around 60 ppm in August, 35 ppm in September, 60 ppm in October, 20 ppm in November, 8 ppm in December, 17 ppm in January, 12 ppm in February and approximately 24 ppm in March. These variations in diurnal CO2 levels may be influenced by local effects, contributing to higher or lower concentrations. At Kasprowy Wierch, the differences between nocturnal and daytime CO2 levels were generally minimal, ranging from a few parts per million in summer to 1–2 ppm in fall and winter.
The thermal conversion effect in the atmosphere has been noted, particularly during the nocturnal period. As the temperature decreases at night, the air layer close to the Earth’s surface, enriched with CO2 from plants and soil respiration, can undergo convection and migrate to higher parts of the atmosphere. This phenomenon can lead to dilution and a decrease in CO2 levels if there is sufficient mixing of air masses. However, in situations with limited air mass mixing, such as calm or non-windy weather, higher concentrations of CO2 can persist in the atmosphere for longer durations. Moreover, the biosphere activity has been dominating (but not exclusively) in summer and fall, while anthropogenic sources became more prominent in winter, following the end of the vegetation period. The impact of photosynthesis and plant respiration on CO2 levels becomes limited from late fall until the beginning of the new vegetation period, typically starting in mid-March in Poland. During this period, there was no significant decrease in CO2 levels during the day and an increase at night, as observed during summer. The effects of air mass mixing and fluxes may influence CO2 concentrations in urban areas. Studies conducted in Łódź analysed CO2 exchange above dense built-up city centres, revealing that carbon dioxide emissions generally surpass absorption throughout the year, except for the summer season when lower anthropogenic CO2 emissions coincide with absorption through photosynthesis, resulting in the lowest net flux of CO2 (Pawlak et al., 2010). These findings underscore the complex dynamics of CO2 concentrations in urban environments, influenced by various factors such as emissions sources, seasonal variations and interactions with the biosphere. These results are in line with those obtained by Bezyk et al. (2023), who also identified two main source categories in the city area: fuel combustion and biogenic processes. According to the Bezyk et al. (2023), in 2017 and 2018, in Wrocław, biogenic emissions dominated during the growing season and were reduced due to plant photosynthesis during the summer afternoons, whereas during the winter, local fossil-fuel CO2 originated from domestic heating, vehicle emissions and heat and power plants. Similar results were obtained by scientists all around the world (e.g., Fang et al., 2014; Vardag et al., 2015; Lauvaux et al., 2016; Lin et al., 2018; Metya et al., 2021) who indicated that the mole fractions of atmospheric CO2 exhibit synoptic, diurnal, day-to-day and seasonal variabilities. Similar results were obtained in the simulations (https://stilt.icos-cp.eu/viewer/), where it is possible to observe the contributions from different fluxes for selected places until 2021. The results are separated into (1) contributions from natural fluxes, split up into uptake of CO2 by photosynthesis and release of CO2 by respiration; (2) contributions from anthropogenic emissions, split into fuel-type specific contributions from burning of coal, oil, gas, biofuel and waste and cement production; and (3) emissions from different source categories such as energy production, industrial processes, transportation, residential heating and other processes. The ICOS’s results confirm that in selected areas, the contribution from natural fluxes and anthropogenic emission varied over time, depending on the seasons. The findings confirm those of earlier studies, such as that in summer and autumn, biosphere activities dominated (but not exclusively), and, in winter, after the end of the vegetation period, anthropogenic sources became more prominent. Unfortunately, this simulation is time-limited and there are still no data concerning the investigated period of time under the present study. We recommend that future research examine observed data and data modelled by simulations.
In summary, our research highlights the complex interplay of various factors influencing diurnal CO2 variations in urban and mountainous regions. Further investigations into these local effects, thermal conversions and air mass mixing will contribute to a better understanding of the dynamics of CO2 concentrations and their spatial and temporal variations.