
. Introduction
Measuring the infrared stimulated luminescence (IRSL) of K-feldspar or polymineral separates at elevated temperatures (>150°C) after initial IRSL stimulation at 50°C (IRSL50) has gained considerable popularity for estimating the equivalent dose (De) in retrospective dosimetry (e.g., Thomsen et al., 2008; Thiel et al., 2011; Reimann and Tsukamoto, 2012). This technique – usually referred to as post-IR IRSL or pIRIR – offers access to feldspar-derived luminescence signals less affected by so-called anomalous fading (Wintle, 1973). The conceptual model explaining these lower fading rates builds upon an increased distance between trapping and recombination sites as stimulation temperature is raised, resulting in a decreased probability of tunneling recombination of opposite charge carriers (e.g., Jain and Ankjsrgaard, 2011; Buylaert et al., 2012). There is however a trade-off between low fading rates of pIRIR signals and signal bleachability, i.e., the pIRIR stimulation temperature is inversely related to the optical resetting rate of the respective signal, while part of the signal remains unaffected by sunlight exposure (Li and Li, 2011). This unbleachable residual has occasionally been determined in the laboratory by applying some sort of residual subtraction method in order to isolate the optically sensitive component from the bulk signal (e.g., Schatz et al., 2012; Li et al., 2013).
Commonly, either sand-sized (~90–250 μm) K-feldspar or silt-sized (~4–11 μm) polymineral grains are prepared for pIRIR measurements. While it is debatable whether the coarse grain size fraction should be HF-etched to remove the outer layer influenced by external α-radiation (e.g., Duller, 1992; Li and Li, 2011; Trauerstein et al., 2014; Kenzler et al., 2015), the α-dose rate has to be fully considered for fine grains (~4– 11 μm). To account for the different efficiency in producing luminescence of heavy particles such as α-particles and slightly ionising radiation such as β- and γ-radiation, the so-called α-efficiency must be incorporated when calculating the dose rate (Aitken, 1985a). Among the different systems presented for quantifying α-efficiency (see Aitken, 1985b, for a summary), the a-value system has most widely been used both for quartz and feldspar. This system is based on the findings of Aitken and Bowman (1975) indicating that the induced luminescence per unit of generated α-track length (in μm μm–3 = μm–2) is nearly independent from the α-particle’s energy. Hence, the luminescence recorded after generating a certain cumulative length of α-tracks is compared with the luminescence resulting from a known β-dose to calculate the a-value. In the case of quartz and mono-energetic 3.7 MeV α-particles (as delivered by many 214Am sources), the a-value is by definition equal to the k-value, where the ratio of luminescence induced by an α-dose (in Gy) to that induced by a β-dose (in Gy) is calculated. For non-quartz materials, a correction factor r relates the material-specific a-value to the quartz a-value (Aitken, 1985b). This correction factor largely depends on the density of the used material. Since the density of feldspar, however, only deviates 2% from the density of quartz, we used uncorrected a-values in this study.
Compared to the vast body of literature published during the past years on the application of the pIRIR protocol to various sedimentary archives, only relatively few studies determined the a-value individually for the samples investigated. Many authors refer to Rees-Jones (1995) when using an a-value of 0.08 ± 0.02, although this value is based on three samples only and – more importantly – determined for the IRSL signal recorded using a multiple-aliquot protocol and under strongly varying preheat and measurement conditions than the ones used in the respective studies (e.g., Stevens et al., 2011; Thiel et al., 2011; Buylaert et al., 2012; Vasiliniuc et al., 2012; Schmidt et al., 2014). Only Biswas et al. (2013) reported measured pIRIR290 a-values ranging from 0.036 ± 0.003 to 0.055 ± 0.002 for volcanic ash samples, determined by administering a known α-dose to a bleached sample and recovering the equivalent β-dose using a single-aliquot regenerative dose protocol. These values are on average higher than the IRSL50 a-values of these samples by a factor of 1.28 ± 0.03 (Biswas et al., 2013). Successful dose recovery using either solely α-regeneration or solely β-regeneration always combined with a fixed β-test dose for normalisation led the authors to conclude that this approach of a-value determination is accurate. In a more comprehensive study, Kreutzer et al. (2014) determined pIRIR225 a-values for five loess samples (polymineral fine grains) from Saxony (Germany), revealing a systematic difference between IRSL50 and pIRIR225 a-values. Furthermore, the mode of signal resetting (heating vs. bleaching) prior to α-irradiation appears to affect the size of the a-value (Kreutzer et al., 2014). Considering the results obtained in the referenced studies above, one might suspect that the pIRIR a-value of polymineral fine grains correlates positively with the pIRIR stimulation temperature. It therefore appears timely to further investigate the a-value of the pIRIR290 signal for a range of different samples. Specifically, the present study aims at:
identifying a suitable method to accurately determine pIRIR a-values,
investigating whether there is a common pIRIR290 a-value, independent of sample mineralogy or provenance, and
clarifying whether the pIRIR290 a-value is different from the pIRIR225 a-value.
Many samples in our laboratories were recently measured with a distinct IRSL protocol (following the approach described in detail in Faust et al., 2015) which includes a high-temperature preheat and a 20 min pause prior to IRSL measurement, in order to minimise anomalous fading. In addition to pIRIR290 a-values, we therefore also report on the a-values determined with this procedure (termed IRSLF henceforth) in order to assess the variability of the a-value as a function of the IRSL/pIRIR measurement protocol. Details on both protocols employed in this study are given below.
. Samples and sample preparation
To evaluate both the variability of the pIRIR290 a-value between samples of different mineralogy and geographical origin and within a set of samples originating from the same outcrop, we studied a total of 47 polymineral fine grain samples from 10 different locations in Europe. Table 1 provides a summary of these samples.
Table 1
Summary of investigated samples. Sample codes BT… refer to the luminescence laboratory in Bayreuth, codes C-L… to the laboratory in Cologne; pIRIR290 = post-IR IRSL protocol with 290°C stimulation temperature (following Thiel et al., 2011); IRSLF = IRSL protocol according to Faust et al. (2015); MAAD = multiple-aliquot additive-dose protocol applied both to the pIRIR290 and the IRSLF emission (see main text for further details).
| Sample code | Provenance | Coordinates | Depositional environment | Applied protocols | Reference |
|---|---|---|---|---|---|
| BT1257 | Titel, Serbia | 45°17′42″N, 20°11′22″E | Loess | PIRIR290 | – |
| BT1258 | Titel, Serbia | 45°17′42″N, 20°11′22″E | Loess | PIRIR290 | – |
| BT1259 | Titel, Serbia | 45°17′42″N, 20°11′22″E | Loess | PIRIR290 | – |
| BT1337 | Encantado I, Fuerteventura | 28°38′20″N, 13°58′37″W | Aeolian deposits | IRSLF | – |
| BT1339 | Encantado I, Fuerteventura | 28°38′18″N, 13°58′40″W | Aeolian deposits | IRSLF | – |
| BT1340 | Melian, Fuerteventura | 28°40′18″N, 13°57′08″W | Aeolian deposits | IRSLF | Roettig et al. (2017) |
| BT1341 | Melian, Fuerteventura | 28°40′18″N, 13°57′08″W | Aeolian deposits | IRSLF | Roettig et al. (2017) |
| BT1342 | Melian, Fuerteventura | 28°40′09″N, 13°57′14″W | Aeolian deposits | IRSLF | Roettig et al. (2017) |
| BT1343 | Melian, Fuerteventura | 28°40′09″N, 13°57′14″W | Aeolian deposits | IRSLF | Roettig et al. (2017) |
| BT1344 | Melian, Fuerteventura | 28°40′22″N, 13°57′12″W | Aeolian deposits | MAAD (PIRIR290, IRSLF) | Roettig et al. (2017) |
| BT1345 | Melian, Fuerteventura | 28°40′22″N, 13°57′12″W | Aeolian deposits | MAAD (PIRIR290, IRSLF) | Roettig et al. (2017) |
| BT1421 | Encantado III, Fuerteventura | 28°38′21″N, 13°58′44″W | Aeolian deposits | IRSLF | Roettig et al. (2017) |
| BT1423 | Encantado III, Fuerteventura | 28°38′21″N, 13°58′44″W | Aeolian deposits | IRSLF | Roettig et al. (2017) |
| BT1424 | Encantado III, Fuerteventura | 28°38′21″N, 13°58′44″W | Aeolian deposits | IRSLF | Roettig et al. (2017) |
| BT1425 | Encantado III, Fuerteventura | 28°38′21″N, 13°58′44″W | Aeolian deposits | IRSLF | Roettig et al. (2017) |
| BT1426 | Encantado III, Fuerteventura | 28°38′21″N, 13°58′44″W | Aeolian deposits | IRSLF | Roettig et al. (2017) |
| BT1432 | Enamorados, Fuerteventura | 28°38′05″N, 13°59′06″W | Aeolian deposits | IRSLF | – |
| BT1513 | Jable 1, Fuerteventura | 28°38′38″N, 13°58′28″W | Aeolian deposits | PIRIR290, IRSLF | – |
| BT1514 | Jable 1, Fuerteventura | 28°38′38″N, 13°58′28″W | Aeolian deposits | IRSLF | Roettig et al. (2017) |
| BT1515 | Jable 1, Fuerteventura | 28°38′38″N, 13°58′28″W | Aeolian deposits | PIRIR290, IRSLF | Roettig et al. (2017) |
| BT1517 | Jable 1, Fuerteventura | 28°38′38″N, 13°58′28″W | Aeolian deposits | PIRIR290, IRSLF | – |
| BT1519 | Fuerteventura, Spain | 28°39′09″N, 13°57′27″W | Aeolian deposits | PIRIR290, IRSLF | – |
| BT1525 | Jable 2, Fuerteventura | 28°38′50″N, 13°58′38″W | Aeolian deposits | PIRIR290, IRSLF | Roettig et al. (2017) |
| BT1528 | Jable 2, Fuerteventura | 28°38′50″N, 13°58′38″W | Aeolian deposits | PIRIR290, IRSLF | – |
| BT1529 | Montana Roja, Fuerteventura | 28°38′59″N, 13°51′08″W | Aeolian deposits | IRSLF | – |
| BT1401 | Eifel, Germany | 50°04′39″N, 07°01′43″E | Quartzitic slate | PIRIR290 | Schmidt et al. (2017) |
| BT1415 | Vârghis, Romania | 46°12′58″N, 25°32′36″E | Aeolian cave deposit | PIRIR290 | Veres et al. (2018) |
| BT1416 | Vârghis, Romania | 46°12′58″N, 25°32′36″E | Aeolian cave deposit | PIRIR290 | Veres et al. (2018) |
| BT1417 | întorsura Buzăului, Romania | 45°43′02″N, 26°04′13″E | Loamy hillslope deposit | PIRIR290 | – |
| C-L3704 | Urluia, Romania | 44°05′42″N, 27°54′07″E | Loess | PIRIR290 | – |
| C-L3707 | Urluia, Romania | 44°05′42″N, 27°54′07″E | Loess | PIRIR290 | Obreht et al. (2017) |
| C-L3778 | Stalać, Serbia | 43°40′39″N, 21°25′04″E | Loess | PIRIR290 | Bösken et al. (2017) |
| C-L3780 | Stalać, Serbia | 43°40′39″N, 21°25′04″E | Loess | PIRIR290 | Bösken et al. (2017) |
| C-L3784 | Stalać, Serbia | 43°40′39″N, 21°25′04″E | Loess | PIRIR290 | Bösken et al. (2017) |
| C-L3786 | Stalać, Serbia | 43°40′39″N, 21°25′04″E | Loess | PIRIR290 | Bösken et al. (2017) |
| C-L3787 | Stalać, Serbia | 43°40′39″N, 21°25′04″E | Pedogenetically overprinted loess | PIRIR290 | Bösken et al. (2017) |
| C-L3788 | Stalać, Serbia | 43°40′39″N, 21°25′04″E | Loess | PIRIR290 | Bösken et al. (2017) |
| C-L4029 | Vrsac, Serbia | 45°09′10″N, 21°09′30″E | Lacustrine sediment | PIRIR290 | Zeeden et al. (in PreP.) |
| C-L4030 | Vrsac, Serbia | 45°09′10″N, 21°09′30″E | Lacustrine sediment | PIRIR290 | Zeeden et al. (in PreP.) |
| C-L4031 | Vrsac, Serbia | 45°09′10″N, 21°09′30″E | Lacustrine sediment | PIRIR290 | Zeeden et al. (in PreP.) |
| C-L3789 | Ságvár, Hungary | 46°49′18″N, 18°05′23″E | Loess | PIRIR290 | Bösken et al. (in Press, a) |
| C-L3791 | Ságvár, Hungary | 46°49′18″N, 18°05′23″E | Loess | PIRIR290 | Bösken et al. (in Press, a) |
| C-L3792 | Ságvár, Hungary | 46°49′18″N, 18°05′23″E | Loess | PIRIR290 | Bösken et al. (in Press, a) |
| C-L3793 | Ságvár, Hungary | 46°49′18″N, 18°05′23″E | Loess | PIRIR290 | Bösken et al. (in Press, a) |
| C-L3795 | Bodrogkeresztúr, Hungary | 48°08′50″N, 21°21′48″E | Loess | PIRIR290 | Bösken et al. (in Press, b) |
| C-L3797 | Bodrogkeresztúr, Hungary | 48°08′50″N, 21°21′48″E | Pedogenetically overprinted loess | PIRIR290 | Bösken et al. (in Press, b) |
| C-L3799 | Bodrogkeresztúr, Hungary | 48°08′50″N, 21°21′48″E | Loess | PIRIR290 | Bösken et al. (in Press, b) |
Prior to measurement, samples were dry or wet sieved to grain sizes <63 μm, soaked in 10% HCl and 10% H2O2 to dissolve carbonates and oxidise organic matter, respectively, treated with 0.01 N sodium oxalate to disperse aggregates (only Cologne laboratory) and subsequently settled in a water column for distinct periods to extract the target grain size range of ~4–11 μm (application of Stokes’ Law). All steps were carried out under subdued red light conditions (640 ± 20 nm). Readily prepared fine grains were pipetted onto aluminium or steel discs (~2 mg per aliquot in Bayreuth, ~0.9–1.0 mg in Cologne) for IRSL and pIRIR measurements. Experiments by Kreutzer et al. (2014; Table S3) have shown that pIRIR225 a-values resulting from both 1 mg and 2 mg of sample material per aliquot are identical within uncertainties.
. Instrumentation and data analysis
All measurements were carried out on Risø TL/OSL DA15/DA20 readers, equipped with infrared (875 ± 80 nm) diodes for signal stimulation and an EMI 9235QB15 photomultiplier tube coupled with a Chroma D410/30x band pass filter (410 ± 15 nm) for signal discrimination and detection. Artificial β-irradiation was carried out with a built-in 90Sr/90Y β-source delivering dose rates to fine grains between 0.040 ± 0.002 and 0.133 ± 0.005 Gy s–1. In Bayreuth, α-irradiation was conducted in vacuum (<10–2 mbar) using either the built-in 241Am source (0.144 ± 0.007 Gy s–1) of one of the Risø readers or an external six-seater Littlemore 241Am irradiation facility (type 721/B) with a dose rate of 0.021 ± 0.002 Gy s–1. In Cologne, the built-in α-source of a Freiberg Instruments lexsyg research reader was used for that purpose (0.197 ± 0.004 Gy s–1, <1 mbar). Information on the calibration of these α-sources is given in the appendix.
Acquired luminescence data were analysed using the program Analyst (v.4.31.9; Duller, 2015). IRSL and pIRIR290 decay curves were measured for 300 s (Bayreuth) or 200 s (Cologne) in this study, and the initial 5 s were integrated to give the signal with which dose response curves were constructed. Instrumental background averaged from the last ~40 s of the decay curve was subtracted from the integrated signal.
. Multiple aliquot additive-dose (maad) measurements
Previous studies on the appropriateness of using single-aliquot regeneration (SAR) protocols for a-value assessment raised concerns on the validity of β-test dose correction of α-induced luminescence signals (Mauz et al., 2006). One way of bypassing this problem is to apply multiple-aliquot additive-dose (MAAD) protocols. In this study, natural aliquots were divided into four dose groups (four aliquots each) and given equally-spaced additive α-doses between 0 and 969 Gy. After measuring the pIRIR290 and IRSLF signals according to the protocol described in Table 2 (steps 2–4), the fitted dose response curve was extrapolated to the α-dose axis and the so-obtained α-dose related to the β-dose derived from ‘regular’ SAR De measurements to obtain the a-value. We adopted the equal pre-dose normalisation technique (Franklin and Hornyak, 1992) to reduce inter-aliquot scatter using solely α-regeneration doses and an α-test dose of 211 Gy. In the course of this normalisation method, all aliquots received the same cumulative dose and heat treatment prior to test dose irradiation to consider dose-dependent sensitivity changes. To account for the pIRIR290 residual, the signal left after 24 h bleaching in a solar simulator (Osram Duluxstar 24 W) was subtracted (Fig. 1). In all cases, the laboratory bleaching procedure resulted in IRSLF and pIRIR290 signals close to instrumental background levels. For MAAD investigations, we chose two samples (BT1344, BT1345) with comparably small De values with the aim to enable a linear fit to the dose points. The MAAD dose response curve of sample BT1345 is shown in Fig. 1; resulting a-values are listed in Table 4.
Fig. 1
Results of MAAD measurements for sample BT1345 (IRSLF protocol). The corresponding a-value is shown in Table 4.
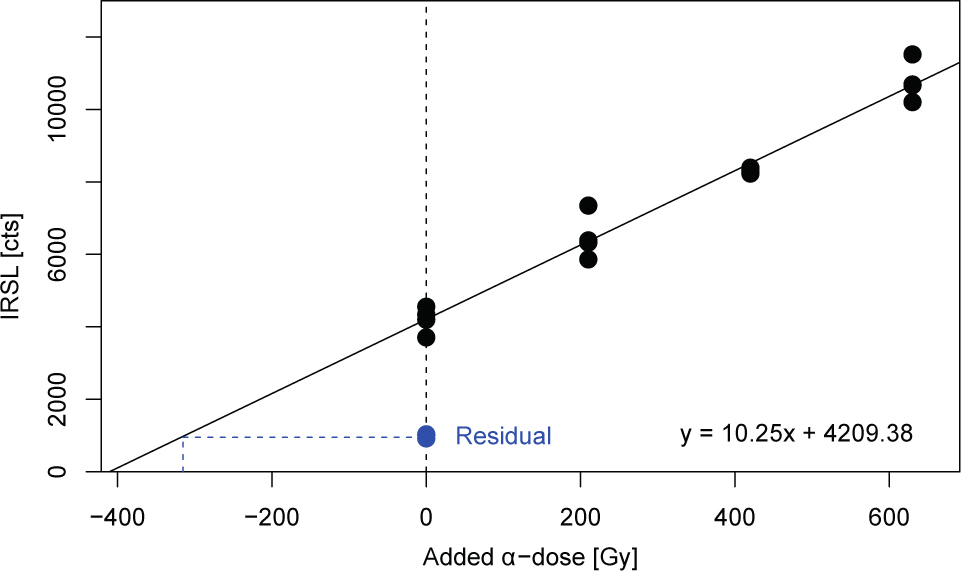
Table 2
Measurement protocols employed for a-value determination. Step 1 in the first SAR cycle is carried out using α-irradiation, while all subsequent irradiations refer to β-doses. The pIRIR290 protocol follows Thiel et al. (2011), while the IRSLF protocol was adopted from Faust et al. (2015). Stimulation times for IRSL50 and pIRIR290 signals were 300 s (Bayreuth) or 200 s (Cologne); an IRSL readout at 325°C for 600 s (Bayreuth) or 200 s (Cologne) intended to fully zero IRSL traps prior to the next regeneration cycle.
Table 3
Relative change of the Lα/Tβ ratio after repeated Lα – Tβ cycles (see main text for further information).
| Sample | BT1258 | BT1259 | ||
|---|---|---|---|---|
| Protocol | IRSLF | PIRIR290 | IRSLF | plRIR290 |
| 3 cycles | 6% | 3% | 9% | 8% |
| 7 cycles | 5% | 7% | 12% | 13% |
Table 4
Results of a-value determination. In contrast to Table 1, samples are grouped according to the measurement protocol used for a-value determination. n is the number of measured aliquots per sample. The a-value is derived as the arithmetic mean of individual aliquots of one sample; the averaged measurement uncertainty Δa is calculated using the formula Δa = [(Δa12+Δa22+…+Δan2)/n]0.5 SD is the standard deviation. The low-temperature IRSL readout of sample C-L3789 was carried out both at 50°C and 80°C, as indicated in the first column. Systematic errors relating to α- and β-source calibration are not considered in this compilation.
Despite the fact that a-values derived from MAAD measurements may be regarded as reliable for the above mentioned reasons (no test dose correction necessary and normalisation using α-doses only), they are nevertheless tied to some impracticalities. First, comparatively large amounts of sample material are required (>12 aliquots, in addition to those needed for ‘regular’ De determination). Secondly, data scatter and extrapolation of the dose response curve can cause uncertainties of dose estimates usually larger than those in SAR measurements. The following experiments hence aim at testing whether SAR measurements are a practical alternative to the MAAD approach and which measurement procedures yield the most reliable a-values. The pIRIR290 protocol following Thiel et al. (2011) and the IRSLF protocol after Faust et al. (2015) on which the SAR measurements are based are outlined in Table 2.
. Single aliquot regeneration (sar) measurements
Considerations on the size of regeneration doses
The determination of the a-value relies on comparing luminescence signals generated by α- and β-radiation. Since the α-dose response is linear to much higher doses than the β-dose response, the a-value starts to change as soon as the β-dose response shows saturating behaviour (Zimmerman, 1972; Mauz et al., 2006; Kreutzer et al., 2014). It is thus important to avoid doses outside the linear range of the dose response for both α- and β-radiation. Depending on the individual luminescence sensitivity of each sample, we therefore tried to keep administered α- and β-regeneration doses as low as possible (Table 4). Due to this restriction and the fact that the intensity of pIRIR signals usually exceeds that of the IRSL50 signals for stimulation temperatures >250°C (e.g., Zhang et al., 2015), the latter signal was too dim in most cases to evaluate IRSL50 a-values accurately.
pIRIR signal resetting prior to α-regeneration
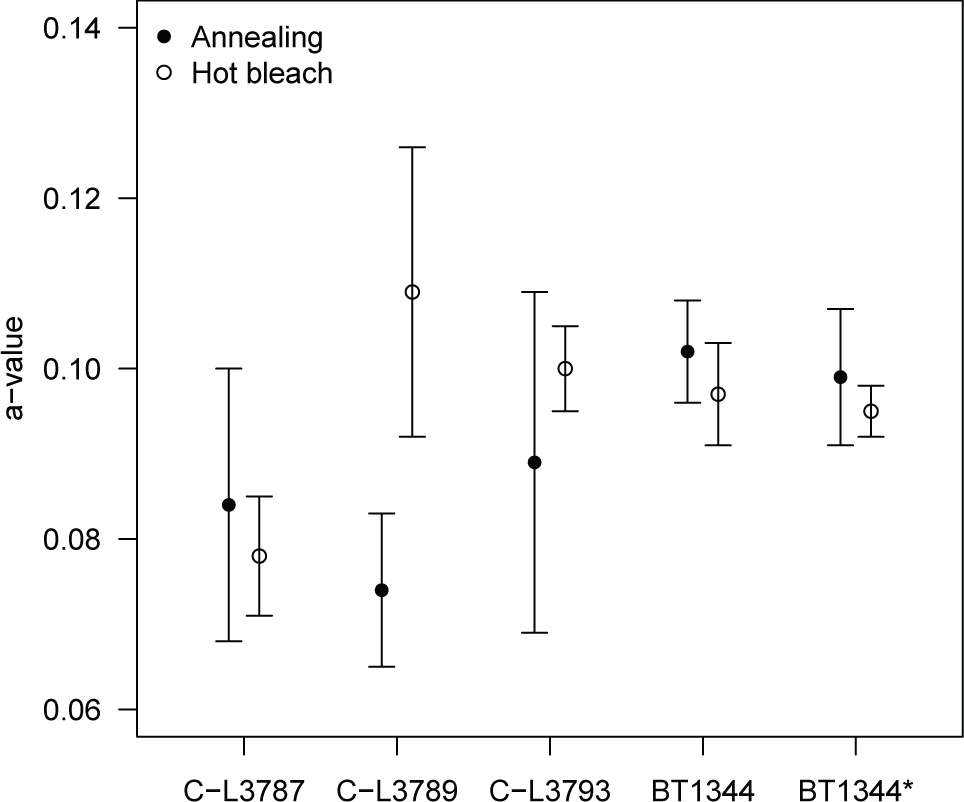
A common SAR procedure to determine the a-value includes irradiating a zeroed aliquot with a known α-dose, constructing a dose response curve by a series of β-regeneration cycles and finally dividing the obtained β-De by the known α-dose. Kreutzer et al. (2014) showed for the pIRIR225 emission of polymineral fine grain samples that the mechanism of signal resetting prior to α-irradiation has significant influence on the resulting a-value. Without being able to cover the entire set of zeroing mechanisms examined by Kreutzer et al. (2014) for all of our samples, we focus here on thermally-assisted IR resetting (‘hot bleach’) and annealing. While samples at the Bayreuth laboratory received a hot bleach (IR stimulation at 325°C for 600 s, identical to step 9 in Table 2), those in the Cologne laboratory were annealed (480°C for 60 s) for the purpose of signal resetting. Both procedures cause IRSL and pIRIR290 signal depletion down to levels indistinguishable from instrumental background. For three samples from the Cologne laboratory (C-L3787, C-L3789, C-L3793) and one from the Bayreuth laboratory (BT1344) both resetting procedures were applied in parallel. Three of these samples gave identical a-values for both resetting methods, while one (C-L3789) showed differing results (based on the standard deviation of individual aliquots) (Fig. 2; Table 4). Observed differences between the resetting procedures are not significant (Welch two sample t-test: t = 0.85, df = 8.0, p = 0.42).
Fig. 2
Comparison of a-values determined following different luminescence signal resetting modes. Each data point represents 2–4 individual a-value measurements; the error bars show the standard deviation. All measurements were carried out with aliquots of ~1 mg sample material, except for BT1344* (~2 mg sample material per aliquot).
Sensitivity correction of an α-regenerated signal by a β-test dose
One basic assumption of SAR protocols is that the luminescence signal of a test dose measurement monitors the sample’s luminescence sensitivity to the preceding regenerative β-dose (e.g., Murray and Wintle, 2000). Whether this assumption holds true for an α-regenerated signal that is monitored by a β-test dose measurement is, however, unclear. Accurate sensitivity correction can be expected if the α-induced luminescence signal (Lα) and the β-test dose signal (Tβ) are directly proportional to each other in the course of repeated constant-dose Lα and Tβ cycles. In addition, in a plot of Tβ vs. Lα the y-axis intercept should be small compared to luminescence intensity (Murray and Mejdahl, 1999). Previous investigations of a silt-sized quartz sample by Mauz et al. (2006) showed varying behaviour in the proportionality of Lα and Tβ signals, with one aliquot fulfilling these requirements, while the other three failed. Equivalent experiments for silt-sized polymineral samples have not yet been carried out.
We therefore measured repeated Lα – Tβ cycles for seven polymineral samples (four aliquots each) while applying the two measurement protocols listed in Table 2. Natural signals were zeroed prior to α-regeneration by means of a hot bleach and α-doses were chosen according to luminescence signal intensity (BT1257, BT1258, BT1259: 298 Gy; BT1342, BT1343, BT1423, BT1426: 199 Gy); the β-test dose was kept constant at 5 Gy. For practical reasons, the major part of measurements consisted of three cycles of α-irradiation using the Littlemore facility and β-irradiation in a Risø reader. However, to check for potential loss of sample material during repeated transport between irradiation facilities, we conducted reference measurements of seven Lα – Tβ cycles for samples BT1258 and BT1259 (IRSLF and pIRIR290) using both the built-in α- and β-source of one of the Risø readers, i.e. sample transport was not necessary in this case. Lα – Tβ data were fitted with a linear function. Representative results are shown in Fig. 3.
Fig. 3
Results of the repeated Lα – Tβ measurements. Data were fitted with a linear function; PIRIR290 results are shown in black, IRSLF results in blue. The asterisk indicates that seven Lα – Tβ cycles were measured without removing the samples from the luminescence reader, while the other samples were transferred from the α-irradiation facility to the luminescence reader three times (see main text for further details).
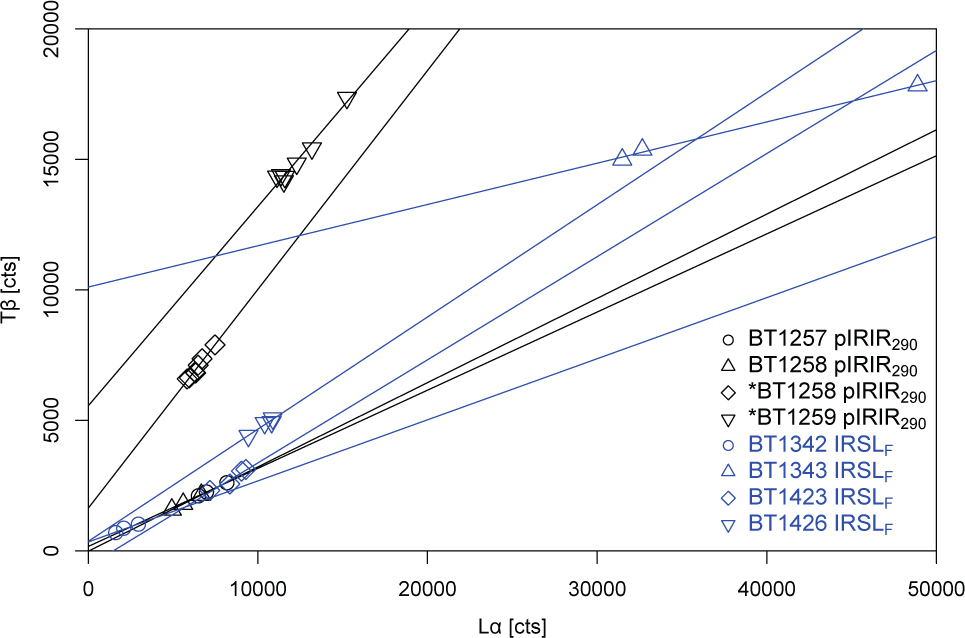
As evident from Fig. 3, the major part of studied samples (~70%) revealed direct proportionality between Lα and Tβ. There is a substantial offset on the y-axis only for few samples (e.g., BT1343 in Fig. 3), rendering the SAR procedure for a-value determination inappropriate for these. The relative change of the Lα/Tβ ratio after three and seven regeneration cycles for the IRSLF and pIRIR290 protocols is shown in Table 3 for samples BT1258 and BT1259. Furthermore, we could not observe any systematic trend with respect to sample provenance and measurement protocol for the fulfilment of the Lα – Tβ requirement.
Variation of a-values among samples and measurement protocols
Since the SAR approach as outlined in the previous sections appears to be appropriate for α-efficiency determination for the majority of polymineral samples, we employed it to determine the a-value for the 47 samples listed in Table 1. For each sample, up to eleven aliquots were analysed and the arithmetic average calculated, along with the standard deviation (SD, at 1σ confidence level) and the averaged measurement uncertainty Δa = [(Δa12+Δa22+…+Δan2)/n]0.5 (with Δan being the uncertainty of an individual aliquot, and n the number of aliquots) in order to both depict the scatter of several aliquots of one sample and the uncertainties associated with individual a-values derived from a single aliquot. Results are summarised in Fig. 4 and compiled numerically in Table 4.
Fig. 4
Graphical summary of PIRIR290 and IRSLF a-values measured in Bayreuth and Cologne. The dashed lines indicate the unweighted average and its standard deviation (1σ). Data points represent the average of 1–11 aliquots (see Table 4) and are plotted with the corresponding standard deviation (1σ).
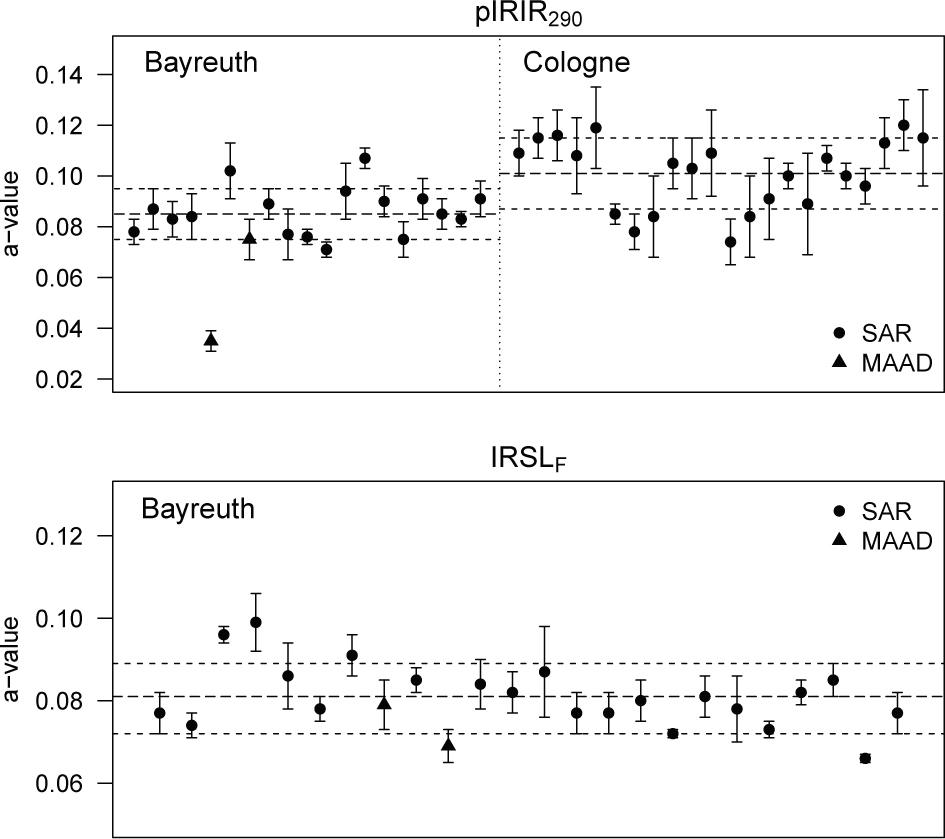
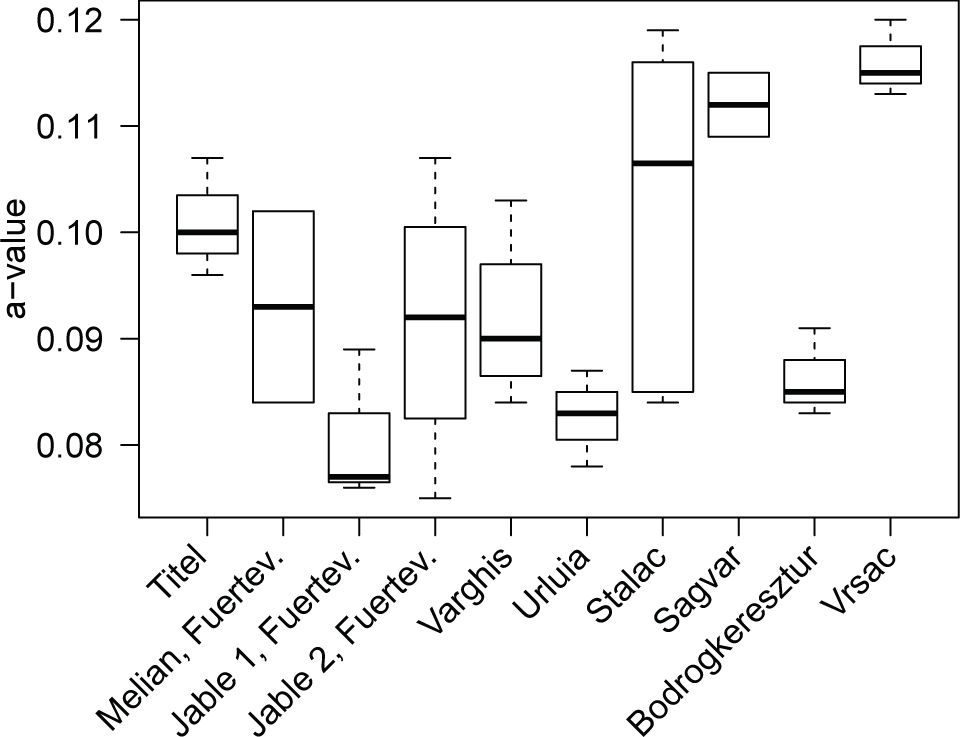
The a-values for the IRSLF protocol yield an average of 0.081 ± 0.008 (n = 24; unweighted average with SD) and 0.074 ± 0.009 (n = 24; error-weighted average with SD) (Table 4 and Fig. 4). Excluding the MAAD a-value of sample BT1344 (outlier according to Dixon’s test with p = 0.01; Rorabacher, 1991) produces average pIRIR290 a-values for samples measured in Bayreuth of 0.085 ± 0.010 (n = 18; unweighted average) and 0.083 ± 0.011 (n = 18; error-weighted average). Corresponding pIRIR290 a-values for the measurements conducted in Cologne are 0.101 ± 0.014 (n = 22; unweighted average) and 0.095 ± 0.013 (n = 22; error-weighted average). Although pIRIR290 a-values from both laboratories overlap within 1σ standard deviation (Fig. 4), their difference is significant (Welch two sample t-test: t = 3.96, df = 36.6, p < 0.01). Contrarily, a-values measured with two different protocols in the Bayreuth laboratory (pIRIR290 and IRSLF) derive from one common distribution, i.e. the difference of their means is not significant (Welch two sample t-test: t = 1.7, df = 30.4, p = 0.1). Finally, the variation between samples from different sample locati ons (e.g. sampled sections) measured with the pIRIR290 protocol was investigated (Fig. 5). The F-test revealed that there are significant differences in the mean a-values between the tested sample locations (F923 = 4.17, p < 0.01), i.e., the explained variation between mean a-values of different locations exceeds the unexplained variation within the a-values of one sampled profile. Specifically, we observed significant differences in the a-values from Vrsac and Titel (C-L4029–4031 and BT1257-1259; Tukey post-hoc-test: p = 0.01), Vrsac and Jable 1, Fuerteventura (C-L4029–4031 and BT1513, BT1515, BT1517; Tukey post-hoc-test: p < 0.01), and Vrsac and Vârghis (C-L4029–4031 and BT1415–1416; Tukey post-hoc-test: p = 0.04). There is no significant difference between sample locations for the a-values determined with the IRSLF protocol (F6,14 = 2.56, p = 0.07).
Comparative measurements between laboratories
To investigate whether pIRIR290 a-values are reproducible on various luminescence readers and with respect to specific laboratory routines, we measured samples prepared in Bayreuth (BT1344) in the Cologne laboratory and vice versa (C-L3778, C-L3788, C-L3791, C-L3707), using the same measurement protocol. However, laboratory-specific resetting mechanisms (Bayreuth: hot bleach; Cologne: annealing) and aliquot size (Bayreuth; ~2 mg; Cologne: ~0.9–1.0 mg) were retained.
Results of these five samples are shown in Fig. 6. The pIRIR290 a-values obtained are different (by ~20–30%) for the two laboratories, with the values derived in Cologne mostly exceeding those measured in Bayreuth. Nevertheless, these differences are not significant (Welch two sample t-test: t = 1.82, df = 7.7, p = 0.11).
Fig. 6
Results of comparative a-value measurements between the two involved laboratories. Data points represent 2–6 aliquots and are plotted along with the respective standard deviation.
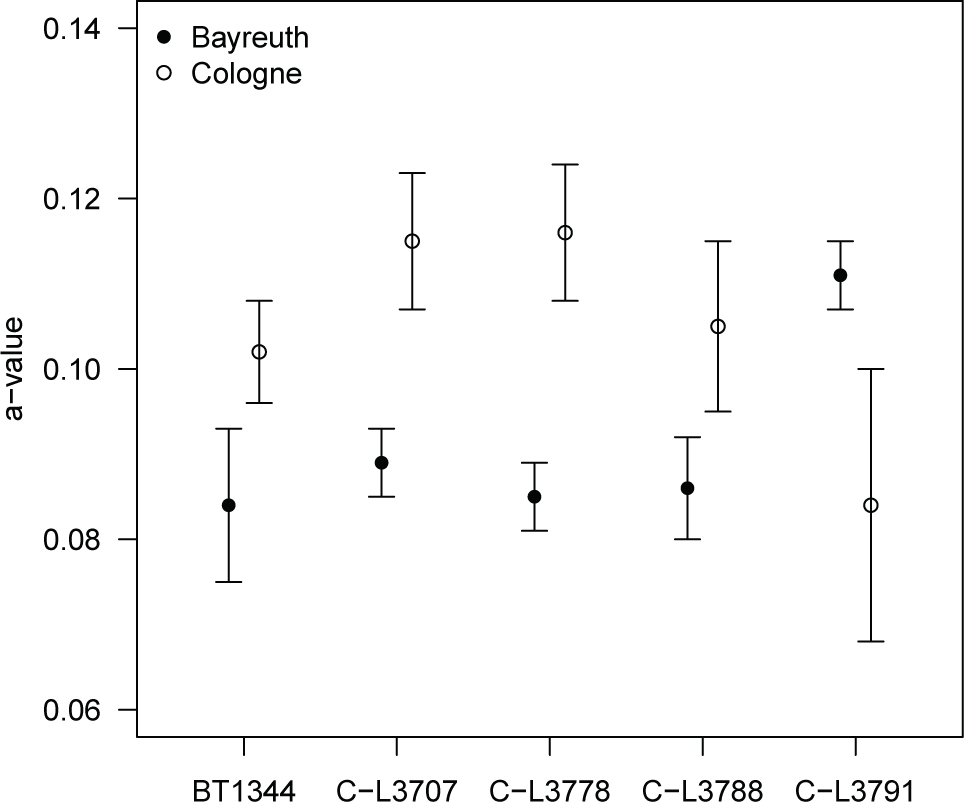
Comparative measurements of sample BT1344 in Cologne using aliquot sizes of ~1.0 and ~2.0 mg yielded identical a-values of 0.097 ± 0.006 and 0.095 ± 0.006, respectively (Welch two sample t-test: t = 0.53, df = 4.8, p = 0.62; see also Fig. 2). The pIRIR290 a-value hence appears to be largely insensitive to the amount of sample material per aliquot, in accordance to the findings by Kreutzer et al. (2014) for the pIRIR225 a-value.
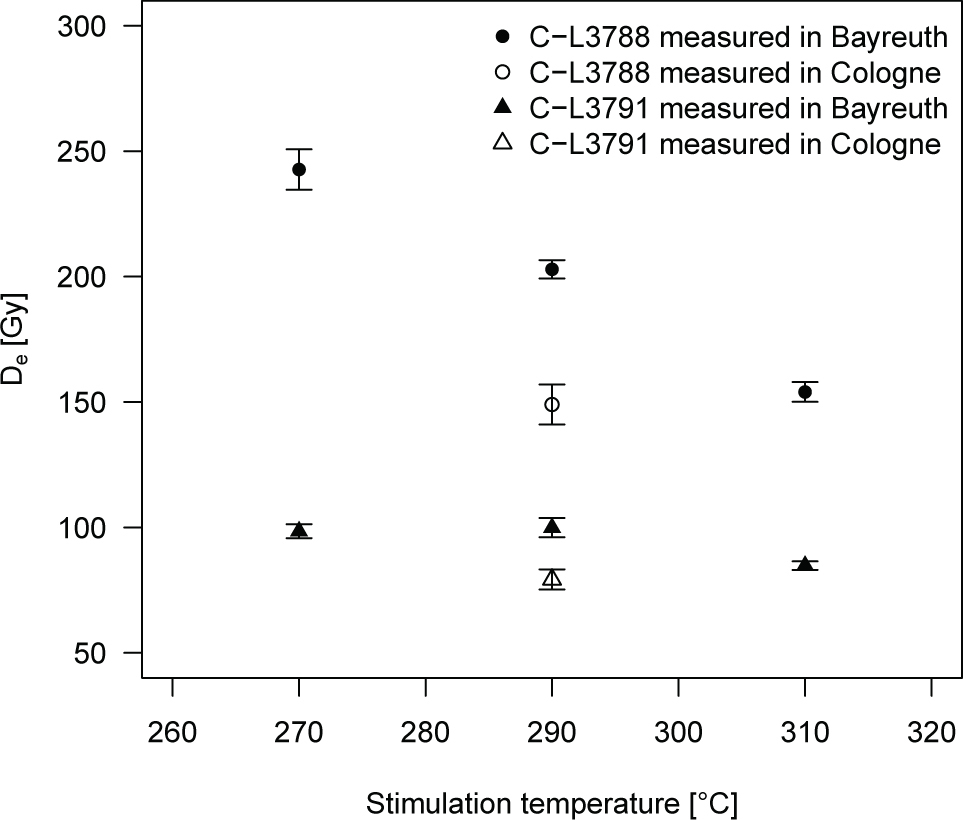
In order to further study the potential reasons for differing a-values of the same samples as measured in the two laboratories, we aimed at testing whether there is an offset in actual reading temperature of the two luminescence readers used for the comparative measurements. Therefore, we measured the De on a set of fresh aliquots from samples C-L3788 and C-L3791 in Bayreuth, employing a pIRIR protocol as outlined in Table 2 with three different pIRIR readout temperatures (270, 290, 310°C), while the preheat temperatures were set 30°C lower than the respective stimulation temperatures. Results are shown in Fig. 7 and indicate that at least for sample C-L3788 the De is rather sensitive to slight variations in preheat and measurement temperature. While for the pIRIR270 protocol the De amounts to ~245 Gy, it progressively decreases by more than 37% for the pIRIR290 (De ~ 203 Gy) and the pIRIR310 (De ~ 154 Gy) protocols. The decrease in De with pIRIR measurement temperature is less pronounced for sample C-L3791, with a reduction from ~100 Gy to ~85 Gy. Reconciling these results with the De values of the same samples measured in Cologne with the pIRIR290 protocol (149 ± 8 Gy and 79 ± 4 Gy for C-L3788 and C-L3791, respectively) suggests an offset of actual measurement temperature of ~20°C in the range 270–310°C.
Fig. 7
Equivalent doses determined with the pIRIR protocol at varying reading temperatures (270, 290, 310°C). Further technical details are given in the main text. A comparative dose estimate derived in the Cologne laboratory using the pIRIR290 protocol is indicated with open symbols. Error bars represent the standard deviation of contributing aliquots.
. Discussion
Our experiments on the correction of sensitivity changes induced by an α-regeneration dose by means of a β-test dose indicate that for the majority of the investigated samples the SAR protocol (recovery of a known α-dose with β-SAR cycles) is suitable to determine reliable a-values. This procedure is less time- and material-consuming than MAAD protocols, for which sensitivity changes should not have any effect on the results. Comparative a-values derived from SAR and MAAD protocols for four samples (pIRIR290 and IRSLF for two samples each; Table 4) are not in agreement within 1σ uncertainties, but are consistent with the overall a-value distribution of the respective IRSL signal and laboratory (see Fig. 4; except for the MAAD pIRIR290 a-value of sample BT1344, which could be classified as a statistically significant outlier). Therefore, it can be concluded that SAR protocols are a valid procedure to determine IRSL a-values of polymineral silt-sized samples, at least for the majority of samples investigated in this study.
The assessment whether or not there is a common a-value for polymineral samples measured with several infrared stimulated luminescence protocols is not straightforward. While a-values appear to be consistent within one laboratory environment, there are discrepancies when comparing a-values that were obtained using different measurement setups. Although comparative measurements on the same samples in the two laboratories showed differences in a-values, these were not significant (but n = 5 only). However, considering the entire data set it appears that the a-values measured in this study are less dependent on sample origin and lithology, but rather on the measurement equipment and laboratory routines. Since slight variations in experimental conditions may affect the characteristics (anomalous fading, residual signals) of (post-)IRSL signals, measured a-values are probably only valid for this respective experimental setup (type of sample carriers, luminescence reader etc.), and De and a-value measurements on a sample should be carried out with the same setup. Specifically, possible technical reasons for the trend of difference in a-values between laboratories could be the calibration of the α- and β-sources, thermal lag or the temperature-calibration of the heating elements in the readers, which seem to be offset, as indicated by the comparative measurements described in the last section. Similar effects were observed in a previous interlaboratory comparison study of the 110°C thermoluminescence peak of quartz (Schmidt et al., 2018). The findings from the pIRIR290 De comparison of the same samples within two laboratory environments (Fig. 7) suggest that the α-source calibration is not the sole cause responsible for the discrepancy in a-values between laboratories. For samples with IRSL50 signals just high enough to permit determination of rough a-value estimates, there is the tendency of higher average IRSL50 a-values in Cologne (0.086 ± 0.012, n= 15) as compared to Bayreuth (0.074 ± 0.009, n = 10). Since temperature deviations at 50°C stimulation temperature should be negligible, it appears that systematic shifts in temperature cannot explain the observed a-value differences alone. Rather, an interaction of the influencing factors described above seems to cause the observed variation in a-values. The aliquot size (~1 mg vs. ~2 mg per aliquot) and the mode of signal resetting, however, do not appear to influence the a-value significantly. It is noteworthy that the pIRIR290 a-values derived after annealing (Cologne) and after hot bleach (Bayreuth) match well with the pIRIR225 a-values of Kreutzer et al. (2014) obtained with comparable resetting mechanisms. Although the comparison of the two resetting mechanisms in our study did not reveal any significant differences in the resulting a-values, a consistent pattern with higher a-values after annealing emerges. For future research, it might be advisable to test this with more samples and interlaboratory comparisons.
The slight differences in the pIRIR290 measurement protocol (cf. Table 2) are unlikely to be the source of a-value variations between the two laboratories, because β-regeneration doses and hence signal intensities were usually low. Therefore, pIRIR290 signals always reached instrumental background levels at the end of a regenerative measurement and signal carry-over into the test dose cycle as observed by Colarossi et al. (2018) appears improbable.
Contrasting the a-values obtained from different profiles revealed no provenance-related difference for the samples measured with the IRSLF protocol. However, these samples were all taken on Fuerteventura in similar geomorphological settings and show comparable geochemical composition. Contrarily, we detected some provenance-related differences between the samples measured with the pIRIR290 protocol. It is noteworthy though that these are mainly associated with the only lacustrine archive (Vrsac, Serbia) tested. This might suggest different a-values for different types of lithology or sedimentary archives; a statement, however, which needs further investigation. Furthermore, it is possible that slight provenance-related differences in a-values are masked by the variation induced through the differences in experimental setup. Therefore, even if there were systematic trends in a-values among samples with different lithology, they would not be discernible given the measurement uncertainties. This is supported by the fact that within one laboratory, the a-values for most of the samples are statistically the same.
The study of Kreutzer et al. (2014) showed for five loess samples from Saxony that the a-value appears to rise with increasing sample temperature during measurement (by 0.023 ± 0.012 for IRSL50 and pIRIR225, respectively, on polymineral fine grains). This trend could not be confirmed with the current data set where the average a-values obtained with the IRSLF and pIRIR290 protocols are statistically indistinguishable. Considering a-values employed in previous applications of the pIRIR290 protocol (e.g., 0.08 ± 0.02 in Thiel et al., 2011; or 0.07 ± 0.02 in Preusser et al., 2014) and the dataset compiled here, it is conceivable that continuing use of literature values could lead to slight, but systematic age overestimation.
Taken previous and the current data together, the a-value of IRSL signals from polymineral loess samples appears to range between 0.08 and 0.11, and whenever an individual assessment of a-values is not feasible (what is, however, highly encouraged), an increased uncertainty level of 30% could account for the variation in a-values caused by differences in measurement equipment and laboratory routines. Nevertheless, to avoid systematic errors in age determination, a-values should be measured as accurately as possible for each set of samples and specific measurement setup.
. Conclusion
The analyses conducted in the frame of a-value measurements of 47 polymineral silt-samples with two different IRSL measurement protocols (pIRIR290 and IRSLF) lead to the following conclusions:
– The SAR protocol appears to be appropriate for determining IRSL a-values.
– Within one laboratory environment a-values arise from one common statistical population.
– Determining a common and accurate a-value, independent of sample mineralogy, provenance and measurement equipment, remains challenging due to an inherent variation between different laboratory environments.
– Measurement equipment seems to exert significant influence on a-value results. Therefore, the same luminescence reader should be used for both dose and a-value determination.
– For the samples investigated, the a-values for the IRSLF signal average to 0.081 ± 0.008 (unweighted) and range from 0.085 ± 0.010 (Bayreuth laboratory) to 0.101 ± 0.014 (Cologne laboratory) for the pIRIR290 signal.