
. Introduction
The regional erosion of an uplifted positive landform is always a step behind the instantaneous crust uplift. The exhumation or denudation rates recorded by this later regional erosion could only represent a prolonged average exhumation rate. For this reason, the better way to estimate the instantaneous crustal uplift rate is to study the erosional responses immediately following the uplift, such as river incision, glacial denudation, and normal faulting of a horst boundary. Limited methods, including optically stimulated luminescence (OSL) dating, cosmogenic nuclide (10Be) dating, and Carbon-14 dating, can be applied to estimate the rates of these incision and denudation within the last 10–200 ka. They are very sensitive to environmental conditions (Herman et al., 2010; Dunai, 2010; Bowen, 1994).
Comparing with isotopic dating methods, luminescence thermochronometry has several advantages in determining the crustal uplift rates and reconstructing the relief evolution. Firstly, it has multiple thermochronometers which correspond to a group of closure temperatures (Li and Li, 2012; Tang and Li, 2015; Qin et al., 2015). The continuous cooling process can be estimated based on a group of apparent ages, which initiate at different times and temperatures. Secondly, the luminescence thermochronometry has very low closure temperatures between 35–80°C (Li and Li, 2012). It can document cooling histories within the uppermost portion of the crust, such as river incision and glacier denudation. Thirdly, the factors critical to dating methods such as OSL, including sun bleaching and cosmic rays shielding, have little influence on this method because it is sensitive to the geothermal heat only.
The fundamental principles of luminescence thermochronometry and its theoretical formulae and numerical simulation have been studied over the last 20 years (e.g. Prokein and Wagner, 1994; Herman et al., 2010; Li and Li, 2012; Qin et al., 2015). It was only recently that this method was applied to exhumation process in rapid uplifting areas, such as the Southern Alps in New Zealand, the Eastern Himalaya and Nujiang River (Herman et al., 2010; Sarkar et al., 2013; Tang and Li, 2015). Regardless of the great potentials of luminescence thermochronology, it has not been widely applied because suitable dating protocols that can be routinely and conveniently applied in the laboratory are unavailable. Guralnik et al. (2015) studied the OSL signals from quartz samples and found undesirable OSL characteristics for dating the rocks. King et al. (2016) studied the infra-red stimulated luminescence (IRSL) signals from K-feldspar through the multi-elevated-temperature (MET) protocol (Li and Li, 2011), and indicated the great potential of it. Tang and Li (2015) suggested that, for quartz grains, multiple aliquot regenerative dose thermoluminescence (MAR-TL) and single aliquot regenerative isothermal thermoluminescence (SAR-ITL) were appropriate for thermochronological studies.
It has been reported that the sensitivity of quartz TL and ITL signals can be low, and give very weak signals, especially in the cases of limestone and dolomite rocks (Tang and Li, 2015). However K-feldspar has noticeable bright TL and ITL signals, even when quartz TL/ITL signals are low. Similar to quartz, the K-feldspar also offers multiple thermometers available for thermochronometry cross-checks. The K-feldspar is less affected by the heterogeneity in environmental radiation dose because of internal dose from 40K and 87Rb. In addition, K-feldspar has highly reproducible TL/ITL signals and high saturation dose, which improve accuracy and dating limit, respectively.
In order to find a suitable protocol for the K-feldspar thermochronology study, five protocols, the multiple aliquot additive-dose thermoluminescence (MAA-TL), the multiple aliquot regenerative-dose thermoluminescence (MAR-TL), the multiple aliquot additive-dose isothermal thermoluminescence (MAA-ITL), the multiple aliquots regenerative-dose isothermal thermoluminescence (MAR-ITL) and the single aliquot regenerative-dose isothermal thermoluminescence (SAR-ITL) were studied and tested using a standard sand sample, N-1. After initial analysis, the MAR-TL and SAR-ITL protocols were considered more favorable and further evaluated using samples collected from Nujiang River.
. Samples and Equipment
A laboratory standardised sand sample N-1, from northern China was used in the study of five different protocols. The natural De was determined approximately at 16 Gy (Li et al., 2007; Gong et al., 2014). The K-feldspar grains of sample N-1 were prepared using a standard separation technique in the Luminescence Dating Laboratory, The University of Hong Kong.
Three rock samples collected from a “V” shape valley slope of the Nujiang River were used in the evaluation of MAR-TL and SAR-ITL protocols (Tang and Li, 2015). They were named from top to bottom of the slope as FG-A, FG-B and FG-C. They are mylonite (FG-A), schist (FG-B) and gneiss (FG-C) which contain abundant K-feldspar and experienced rapid cooling in the recent geological history due to the uplift and erosion.
The outer layer of rock samples is removed by cutting machinery under fluorescent lamp or red dim light. Then, the inner part of raw sample is sawed into small pieces using rock-cutting machinery. These small pieces are then crushed by hand hammer gently to maintain the mineral size as original as possible. 10% H2O2 and 10% HCl are used to remove the organic materials and carbonates, respectively. The rock samples were then dry sieved to obtain a 150–180 um powder. The K-feldspar grains were separated from the powder using the heavy liquid sodium polytungstate with a density of 2.58 g·cm–3. The K-feldspar was then etched by 10% HF for 40 minutes to remove the outside layer penetrated by alpha particles. All preparations were performed under fluorescent lamp or dim red light.
All luminescence measurements were carried out using a Riso TL/OSL-DA-15 reader. The heating rate was 5 K/s. The filter package contained one Corning 7–59 and one Schott BG-39 filter, in front of an EMI9236QA photomultiplier. Irradiation was carried out using a 90Sr/90Y beta source of 0.1 Gy/s to feldspar grains carried on aluminum discs built into the reader.
. Measurement Procedures and Results
The MAA-TL and MAR-TL protocols
The conventional MAA-TL and MAR-TL protocols were used because multiple signals at different temperatures can be measured in one run (Aitken, 1985). A TL glow curve of typical K-feldspar TL signals is shown in Fig. 1A. The MAA-TL protocol is shown in Fig. 2A. Four groups of six aliquots were given: 0, 3.5, 7 and 14 Gy dose, respectively. These aliquots were preheated with a cutheat to 200°C, and cooled immediately. Then the aliquots were then heated to 450°C to measure the ‘natural + dose’ TL signal. All TL measurement heating rate in this study are 5 K/s. In order to normalize the signals, a second glow TL following a beta dose of 7 Gy was measured immediately after the first heating.
Figure 1
Typical luminescence signals from sample N-1. A) Thermoluminescence (TL); B) Isothermal thermoluminescence (ITL).
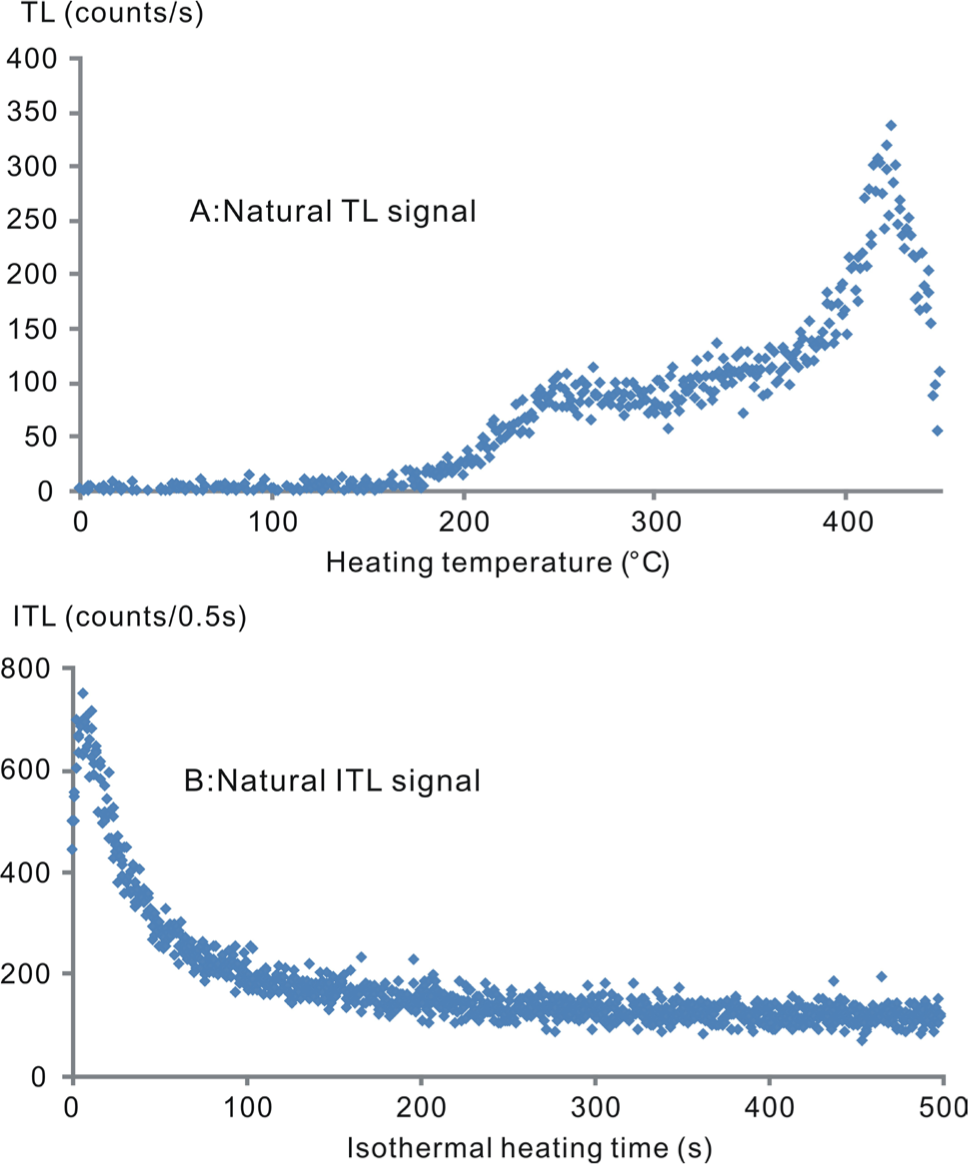
Figure 2
Schematic running sequences of luminescence protocols. A) MAA-TL, B) MAR-TL, C) MAA-ITL, D) MAR-ITL and E) SAR-ITL protocols.
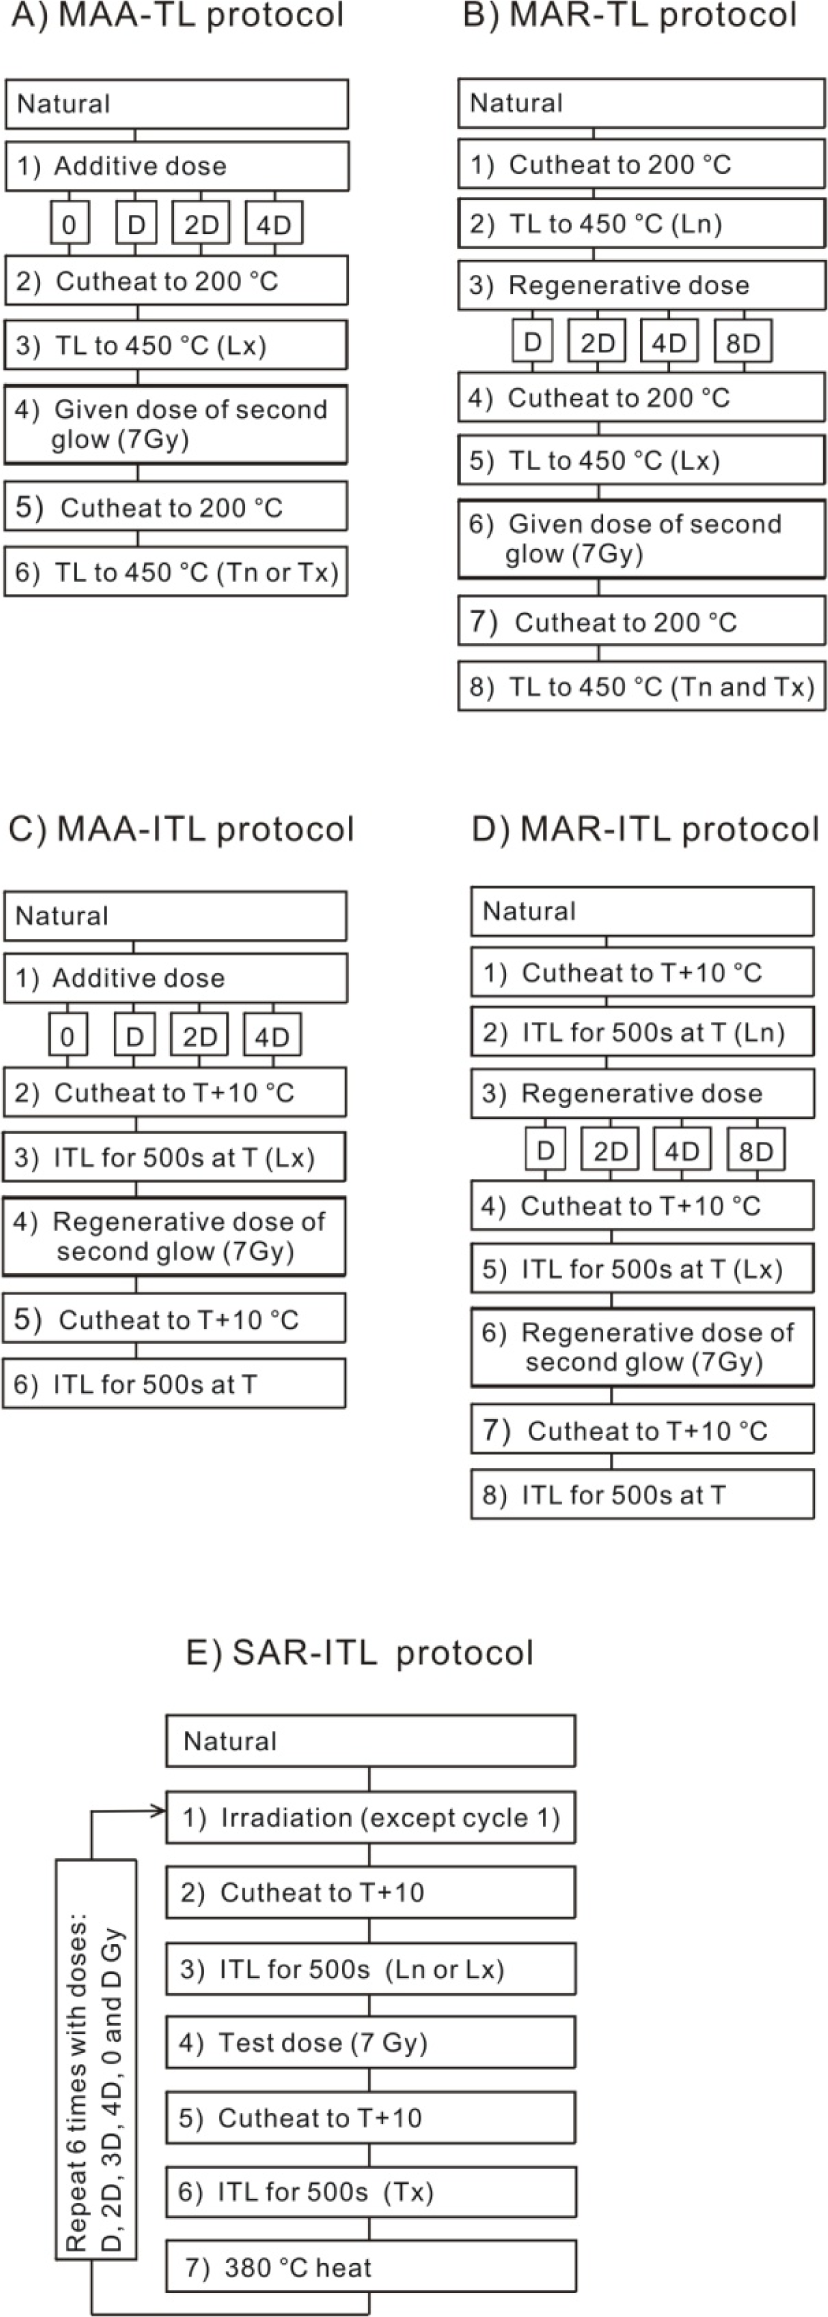
The MAR-TL protocol is shown in Fig. 2B. The MAR-TL protocol was also studied using four groups of six aliquots. These aliquots were preheated with a cutheat to 200°C, and cooled immediately. The aliquots were then heated to 450°C to allow the natural TL signals to be measured. The heated aliquots were separated into four groups and given regenerative doses of 7, 14, 28 and 56 Gy, respectively. The aliquots were then cut-heated to 200°C again. The regenerative TL signals were measured by heating to 450°C. Similar to the MAA-TL protocol, a second glow TL following a beta dose of 7 Gy was measured at the end of measurement to normalize both the natural and regenerative TL signals.
The MAA-TL and MAR-TL results
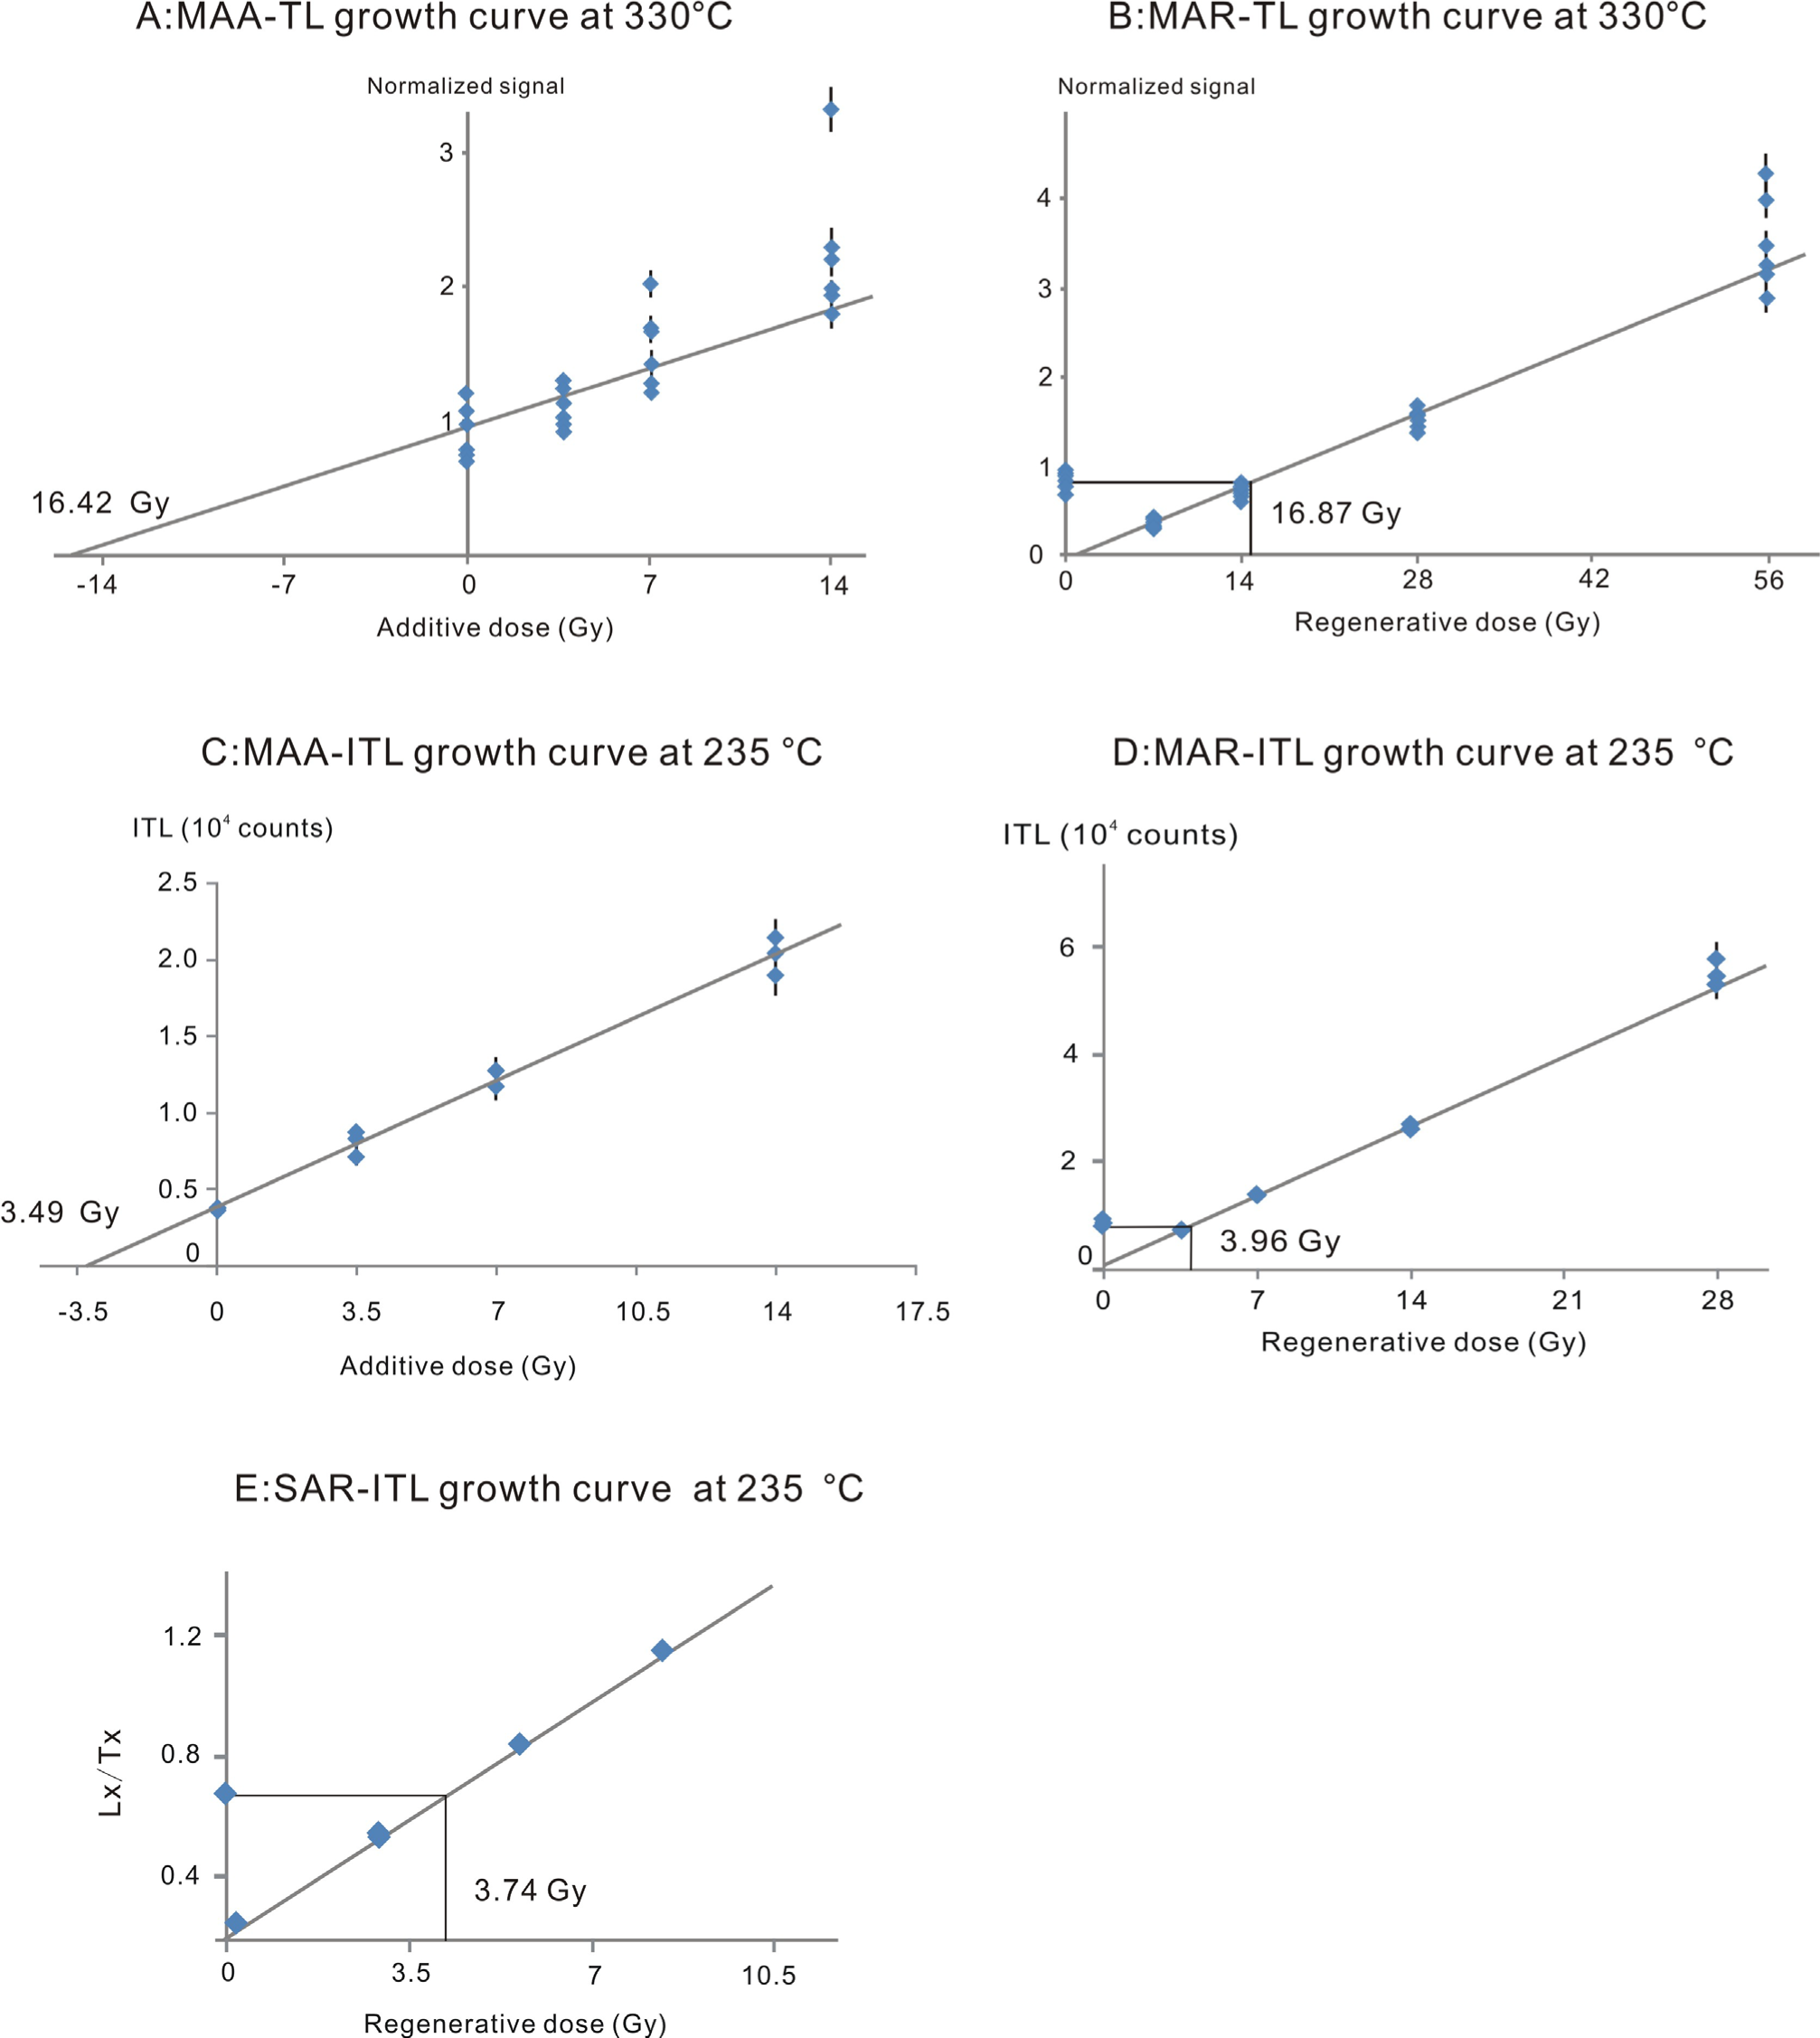
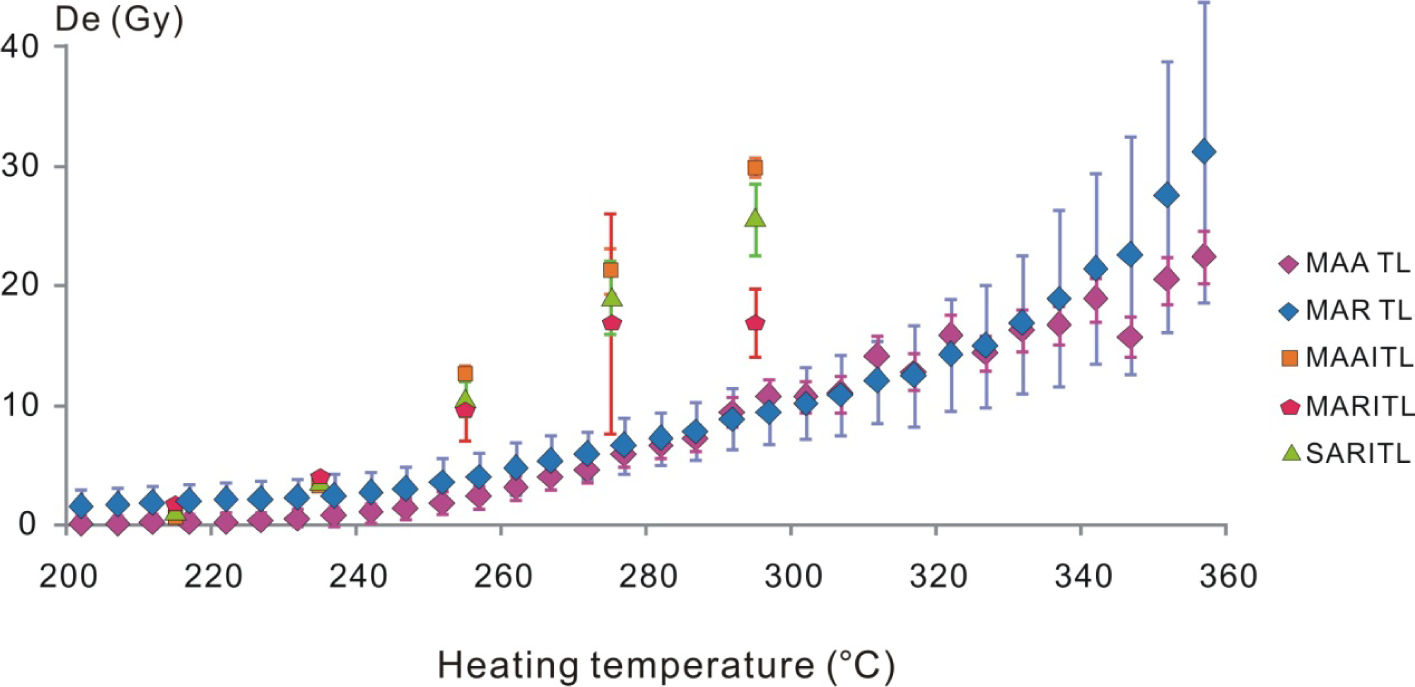
Typical growth (dose response) curves of MAA-TL and MAR-TL at 330°C were established and shown in Figs. 3A and 3B, respectively. The results of MAA-TL and MAR-TL protocols were shown in Fig. 5. Since the TL signals at temperatures lower than 200°C were removed by preheating and blackbody radiation occurs for TL temperature over 360°C, only the 200 to 360°C De results were demonstrated. Both the MAA-TL and MAR-TL protocols results agreed with each other within the 1 standard deviation error.
The MAA-ITL and MAR-ITL protocols
Different from TL, the ITL is to measure the TL signals at a fixed temperature. Benefiting from the preheating, it has relatively less signal contribution from lower temperature compared to the TL signals. A typical ITL decay curve is shown in Fig. 1B.
The detailed steps of the MAA-ITL protocol are described in Fig. 2C. Five isothermal heating temperatures, 215, 235, 255, 275 and 295°C were adopted in the experiments. Twelve aliquots were grouped into four groups with three aliquots in each. These four groups of aliquots were given different additive doses. For ITL measurement at 215, 235, 255°C, four groups of aliquots were given doses of 0, 3.5, 7 and 14 Gy, respectively. For ITL measurement at 275 and 295°C, four groups of aliquots were given doses of 0, 7, 14 and 28 Gy, respectively. The preheat treatment was a cut-heat to 10°C higher than the ITL temperature. The aim of this preheat was to remove the signals at temperatures lower than the temperature in order to minimize their influence on the ITL signal. The aliquots were isothermally heated for 500 seconds to obtain the ITL signals. A second glow was performed afterwards for the signal normalization. It is a 7 Gy regenerative dose signal measured by 500 seconds ITL. There is an approximately 10 s thermal lag at the beginning of the ITL signal before the disk reaches a thermal equilibrium between its center and rim (Tang and Li, 2015). To exclude this thermal lag, the first 10–20 s ITL was integrated as signal and the last 50 s was used as the background (Fig. 1B).
Detailed steps of the MAR-ITL protocol are described in Fig. 2D. Five isothermal heating temperatures, 215, 235, 255, 275 and 295°C were adopted in the experiments. Twelve aliquots were grouped into four groups with three aliquots in each. Firstly, aliquots were preheated by a cut-heat to 10°C higher than the ITL temperature. Then, the natural ITL signals were measured by isothermal heating at the measurement temperature for 500 seconds. The Four groups were given different regenerative doses. For ITL measurement at 215, 235, 255°C, the four groups of aliquots were given 3.5, 7, 14 and 28 Gy, respectively. For ITL measurement at 275 and 295°C, the four groups of aliquots were given 7, 14, 28 and 56 Gy, respectively. After that, a cut-heat to 10°C higher than the ITL temperature was also applied to these aliquots. The aliquots were heated for 500 seconds to allow the ITL signals to be measured. A second glow following 7 Gy regenerative dose was performed after ITL measurement for signal normalization. The first 10–20 s ITL was integrated as signal to exclude the thermal lag, and the last 50 s were used as the background (Fig. 1B).
The MAA-ITL and MAR-ITL results
Typical growth curves of MAA-ITL and MAR-ITL at 235°C are shown in the Figs. 3C and 3D, respectively. The results of equivalent doses measured by the MAAITL and MAR-ITL protocols are shown in Fig. 5. The MAA-ITL De values at 215, 235, 255, 275 and 295°C are 0.76 ± 0.29, 3.49 ± 0.15, 12.72 ± 0.68, 21.26 ± 1.91, 29.98 ± 0.85 Gy, respectively. The MAR-ITL De values at 215, 235, 255, 275 and 295°C are 1.75 ± 0.40, 3.96 ± 0.35, 10.03 ± 2.98, 16.93 ± 9.22, 16.94 ± 2.88 Gy, respectively. Except for the Devalue of MAR-ITL at295°C, all the De values increased with ITL measurement temperatures.
The SAR-ITL protocol
Unlike MAA and MAR protocols, the SAR-ITL protocol only needs a small number of aliquots for De determination. During the measurement, the sensitivity changes can be corrected using the ITL signal induced by a test dose (Jain et al., 2005). Therefore, no inter aliquot normalization was required. The detailed steps of the SAR-ITL protocol are described in Fig. 2E.
The procedures consist of several cycles, each of them very similar. In a single cycle, firstly, a cut-heat to 10°C higher than the ITL temperature was given before measuring the ITL signal. The ITL signals were then measured by heating at the measurement temperature for 500 seconds. Secondly, a test dose was given and an induced ITL signal was measured (Fig. 2E, steps 4, 5 and 6). Thirdly, a TL measurement up to 380°C was applied to remove the remnant signal and prevent the signal build-up. Then, the next cycle started and a designed regenerative dose was given to the same aliquot.
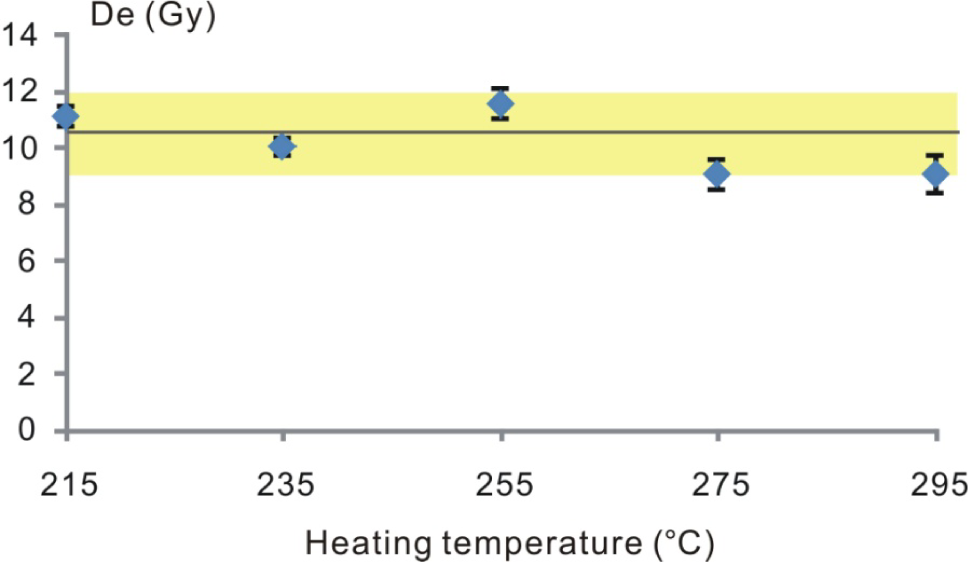
To verify the SAR-ITL protocol, a dose recovery test was performed. A known laboratory regenerative dose was given to the aliquots in which the signals were all cleaned by heating. Then the ‘De’ value was measured using the SAR-ITL protocol. The ratio of the measured ‘De’ dose to the given dose was used to assess the validity of the SAR-ITL protocol. The ratio is expected to be around 1.0.
The dose recovery test was carried out for five ITL temperatures, 215, 235, 255, 275 and 295°C. The laboratory given dose was 10.5 Gy. The mean values of recovered doses of 215, 235, 255, 275 and 295°C were 11.02 ± 0.35, 10.00 ± 0.30, 11.48 ± 0.54, 8.99 ± 0.54 and 9.04 ± 0.64 Gy (Fig. 4). The recovery ratios were 1.05 ± 0.03 at 215°C, 0.95 ± 0.03 at 235°C, 1.09 ± 0.05 at 255°C, 0.86 ± 0.05 at 275°C and 0.86 ± 0.06 at 295°C, respectively. All the mean recovery ratios were within the 1.00 ± 0.15 ranges and showed very good recovery results. This indicated that the SAR-ITL protocol was applicable for the K-feldspar measurement.
The SAR-ITL results
A typical growth curve of SAR-ITL at 235°C was established and shown in the Fig. 3E. The SAR-ITL protocol results are shown in Fig. 5. The Devalues of 215, 235, 255, 275 and 295°C were 1.14 ± 0.17, 3.74 ± 0.38, 10.59 ± 1.43, 19.12 ± 3.08 and 25.58 ± 2.97 Gy, respecttively. As expected, the De values increased with ITL heating temperatures. It was consistent with results from the MAA-ITL and MAR-ITL protocols.
. Discussions and Application
Discussion of protocols
The MAA-TL and MAR-TL protocols gave similar De values, having overlapping error bars. The De values from the MAA-TL protocol had smaller errors than the MAR-TL. This error bar is directly related to the number of measured natural signals. There were four groups of aliquots with natural signals measured in the MAR-TL and only one group of aliquots with natural signals in the MAA-TL. Through, benefit from the number of aliquots of natural signals, MAR protocols can give a better statistical result and improve the accuracy of De value. Since the MAA-TL protocol has less data points to establish a growth curve, it performs better on good reproducible samples. The MAA-ITL and MAR-ITL protocols yielded consistent De results, with an exception for MAR ITL at 295°C. At 295°C, the MAA-ITL and SAR-ITL protocols had consistent results while the MAR-ITL protocol under estimated De value by 50%. This difference was probably caused by the poorly established growth curve being influenced by non-natural signals, because both MAA-ITL and SAR-ITL used the same natural signal. It was highly possible that the growth curve was based on overestimated regenerative dose signals. The residual signal after first heating and the signal build-up of the second glow may be the causes of this problem. This residual signal was only detected at 295°C or higher temperature. To remove this residual signal, a thermal wash of 380°C was needed. The SAR-ITL protocol results had relatively small error bars and showed consistent results with the MAA-ITL and MAR-ITL protocols.
Murray and Wintle (2000) reported a temperature gap between TL and ITL signals that suggest that the 330°C ITL signal might correspond to the 375°C TL peak in quartz. The ITL signal originated from the traps of higher temperature TL peaks. This gap was also observed in the K-feldspar results (Fig. 5). The De values of ITL appear to be shifted compared with the De(T) plots of TL. Within the range of ITL temperature investigated in this study, a 50–60°C temperature translation is appropriate for the ITL De values to agree with TL De values.
The ITL can give a more accurate De value, but takes more measurement time. The TL De values were measured at a wide temperature range of 200–450°C in one run; while for ITL only one De was measured in one run. At least 5 runs are required for ITL to determine the De values of 215–295°C range, with 20°C interval. This means ITL demands at least 5 times more measurement time than TL. ITL is more appropriate for a De determination at a designated temperature, and TL is more appropriate for a wide coverage of all TL peaks.
The advantages and disadvantages of five protocols were compared using thirteen criteria listed in the evaluation form (Table 1). The first criterion is whether the multiple TL peaks as well as multiple geothermometers can be measured in one run. The TL protocols can measure multiple signals in one run while the ITL protocols can only measure one ITL signal for one time (Aitken, 1985). The ITL protocols need more runs at different heating temperatures. The second criterion is whether the kinetics parameters were well studied. TL kinetics parameters have been studied for the last 50 years, but it is not the case for ITL (Aitken et al., 1964; Johnson, 1966). The third criterion is whether the protocol requires shorter measurement time. Because of repeating cycles, the single aliquot protocols need longer time than the multiple aliquot protocols. The fourth criterion is whether the thermal stability can be shown. The TL glow curves can indicate the thermal stability, while the ITL signals cannot give information by the signal itself. The fifth criterion is whether the signal is strong. The TL signals are normally stronger than the ITL signals, especially at low temperature. The sixth criterion is whether the sensitivity change can be minimized. The additive dose protocols can overcome the sensitivity change by using minimum reheating times, while the sensitivity change needs to be considered for regenerative dose protocols. The seventh criterion is whether the signal can be fitted as discrete components. The ITL signal is a decay curve that can be fitted with different decay components, and the components can be regarded as different traps with different thermal stability. Essentially, this decay curve fitting is the same as the TL peaks fitting, in principle. However, the resolution of TL peaks separation is relatively low as the formula is rather complicated. This would cause cross interference between individual peaks and increase the fitting difficulty. The ITL decay curve fitting has a higher resolution in separation because the exponential decay curve is easier to be separated. The eighth criterion is whether the protocol needs a normalization procedure. All multiple aliquots protocols need normalization between aliquot. This normalization could be influenced by the mineral grains luminescence property and sensitivity change after reheating. It is an advantage that SAR-ITL doesn’t need normalization. The ninth criterion is whether it can avoid the overlapping TL peaks. The ITL protocols can vary the heating temperature like a moving probe to closely examine signals, and thus to avoid the temperature range of complicated TL peaks to overlap. The tenth criterion is whether it would be influenced by the atmosphere protection of the TL oven at high temperature. The ITL protocols can use a lower temperature than TL, to avoid the occurrence of atmosphere protection of the TL oven. The eleventh criterion is whether it would be affected by the blackbody radiation. The ITL protocols can use a lower temperature to avoid the blackbody radiation at high temperature. The twelfth criterion is how much sample materials it needs in the measurement. The MAR and SAR protocols need less sample materials than MAA protocols. The thirteenth criterion is whether the De values are obtained by interpolating the natural signals onto growth curves. The De results of MAR and SAR protocols are obtained from the interpolation onto growth curves. This is more reliable than the extrapolation method used in MAA protocols, because there a non-linear portion may occur at the origin of growth curve and bring in extra errors (Aitken, 1985).
Table 1
Evaluation form of MAA-TL, MAR-TL, MAA-ITL, MAR-ITL and SAR-ITL protocols.
In the evaluation of protocols applied (Table 1), both MAR-TL and SAR-ITL protocols have seven advantages, respectively. Considering both the measurement efficiency and data accuracy in the determination, the MAR-TL and SAR-ITL protocols were more favorable than other protocols.
Application
The MAR-TL and SAR-ITL protocols were further evaluated using the field samples collected from the Fugong valley in the Nujiang River. The results are shown in Table 2. In the MAR-TL protocol results, no systematic dependence on elevation above the valley floor of De was observed. Three sections were found between 250 and 330°C. From 250 to 270°C, the FG-C De (29.5–65.2 Gy) was the greatest and the FG-A De (23.9–50.1 Gy) was the second, while the FG-B De (20.8–47.3 Gy) was the smallest; from 280 to 310°C, the FG-C De (99.4–276.1 Gy) was the greatest and the FG-B De (77.0–271.2 Gy) was the second, while the FG-A De (76.9–227.2 Gy) was the smallest; from 320 to 330°C, the FG-B De (361.4–449.9 Gy) was the greatest and the FG-C De (340.4–395.1 Gy) was the second while the FG-A De (287.5–342.4 Gy) was the smallest. Similar to the results of MAR-TL, no systematic dependence on elevation of De was found in the results of SAR-ITL protocol. The FG-C De (109.8–243.2 Gy) was the greatest and the FG-B De (73.7–203.7 Gy) was the second, while the FG-A De (56.1–146.0 Gy) was the smallest. Since the annual doses of rock samples were very difficult to estimate, the apparent ages were not obtained (Tang and Li, 2015; Martin et al., 2015, 2016). Provided that the annual doses were available, the De results would still indicate a notable samples’ age difference at the same heating temperature/thermometer. It is evident the FG-B has a greatest De at 330°C and a lowest De at 250°C, which would result in an old age at 330°C and a young age at 250°C. The cooling rate of FG-B was probably slower than FG-A and FG-C. This suggests these three samples experienced different thermal histories and cooling processes. Since the anomalous fading of K-feldspar TL signals is not in the scope of this paper, we assumed that the samples from Nujiang River faded in the same relative proportion. The anomalous fading is not a critical factor to thermochronological study.
Table 2
Fugong valley samples De results determined using MAR-TL and SAR-ITL protocols.
. Conclusions
The De values from the MAA-TL and MAR-TL protocols were consistent with each other, and the MAA-ITL, MAR-ITL and SAR-ITL protocols results showed a rough consistency, except for the De value at 295°C of MAR-ITL protocol. Within the range of ITL temperature investigated in this study, a 50–60°C temperature translation was necessary for the ITL De values to agree with TL De values. After evaluating the experiment results and the advantage-disadvantages of all protocols, the MAR-TL and SAR-ITL were considered more favorable because of their efficiency and accuracy. These two protocols were further applied to the samples from the Nujiang River valley. Both the MAR-TL and SAR-ITL results demonstrated the differences of thermal histories between samples. The results indicated that the MAR-TL and SAR-ITL are appropriate for the K-feldspar thermochronological dating and the MAA-TL and MAA-ITL protocols are with great potential for the K-feldspar thermochronological studies.