
. INTRODUCTION
Unlike conventional luminescence dating methods using thermoluminescence (TL) and optically stimulated luminescence (OSL) (cf. Aitken, 1985, 1998), where the signals of interest relate to complex recombination pathways, model-based studies believe that the infrared radiofluorescence (IR-RF) signal provides a direct measure of the fraction of empty electron traps (Trautmann et al., 1999a, b, 2000). The IR-RF signal intensity decays with increasing dose and is used for dosimetry and dating. Trautmann et al. (1998) characterised radioluminescence signals (emissions stimulated by ionising radiation) from various feldspar specimens to investigate their potential for dating applications. They reported that microcline and orthoclase (potassium-rich feldspar) had a dose-dependent signal with their emission centred at ~854 nm (1.45 eV). Later, Schilles (2002), Erfurt (2003a) and Erfurt and Krbetschek (2003b) reported the peak emission to occur at ~865 nm (1.43 eV). Erfurt and Krbetschek (2003a) proposed the term IR-RF instead of radioluminescence (cf. Murari et al., 2021).
The literature offers divergent views on the applicability of IR-RF as a dating method. IR-RF as a potential dating method was explored with home-made systems, for example, by Trautmann et al. (1998), Krbetschek et al. (2000), Schilles (2002) and Erfurt (2003a, b), as well as with commercial systems from Risø and Freiberg Instruments (Lapp et al., 2012; Richter et al., 2013) by Buylaert et al. (2012) and Frouin et al. (2015), respectively. Buylaert et al. (2012) recognised problems with this dating method, in particular (1) an overestimation of ages by 15% for younger samples (20–45 ka) and (2) an underestimation in ages up to 30% for older samples (~130 ka). Frouin et al. (2015, 2017) used a Freiberg Instruments lexsyg research system to demonstrate that the IR-RF signal fulfils the basic requirements of luminescence dating methods, e.g., signal bleachability, thermal stability and dose dependency. Recent methodological work on the optical resetting of the IR-RF signal and modified protocols for dose estimation yielded promising results (Frouin et al., 2015; Huot et al., 2015; Frouin et al., 2017; Kreutzer et al., 2017b; Kreutzer et al., 2018; Murari et al., 2018). Such observations and the recent progress towards IR-RF as a dating method demand further research on fundamental aspects such as signal resetting and the accessible dose range, as well as assessing the reproducibility of commercial devices. Both were achieved in this investigation by means of an interlaboratory comparison.
The present study follows the RF70 protocol introduced by Frouin et al. (2017), a variant of the infrared radiofluorescence single-aliquot regeneration (IRSAR) protocol developed by Erfurt and Krbetschek (2003a). In this protocol, signal bleaching and stimulation are applied at an elevated temperature (70 °C, Table 4). The measurement conditions were kept identical, e.g. the same detection window using comparable filter combinations, and the bleaching power of individual devices was normalized following the settings given by Frouin et al. (2015). Further, two reference samples were used for this study and distributed to all laboratories after testing the IR-RF dose recovery characteristics and the purity of the K-feldspar samples using Scanning Electron Microscopy with an Energy Dispersive X-ray (SEM-EDX).
This interlaboratory comparison was established to explore the following questions related to IR-RF:
To which extent does the IR-RF signal bleach in the laboratory compared to a naturally bleached modern analogue sample?
What is the potential upper dating limit of the IR-RF method?
How reproducible are the commercial instruments, and what is their range of variability?
Does an initial IR-RF signal rise exist for each device and both reference samples?
Eight laboratories participated in this comparative study. Measurements were carried out on seven lexsyg research devices from Freiberg Instruments (Freiberg, Germany) and one Risø TL-OSL device from the Center for Nuclear Technologies, DTU Risø (Roskilde, Denmark). The differences in the results among all machines are explored and discussed in detail.
. INSTRUMENT CONFIGURATION AND SETTING
The seven lexsyg research devices provided a comparison amongst readers from the same manufacturer, while the device from Risø allowed assessing the differences between the luminescence readers from two different manufacturers. Some parameters cannot be kept identical even for devices from the same manufacturer, e.g., the dose rate of the radiation source and the power of the solar simulator system (SLS) LEDs varies slightly from one device to another (Lapp et al., 2012; Richter et al., 2012, 2013). In the present study, for the lexsyg research devices, the dose rate values averaged to ~0.059 ± 0.001 Gy · s−1 (Table 1). The SLS power varied between devices such that even though the peak wavelength for each array of LEDs was similar, the maximum possible power for each LED array varied. Therefore, the total energy flux was variable amongst the devices. In Frouin et al. (2017), 3 h of SLS bleaching is recommended, followed by a 1 h pause. In the present study, each SLS bleaching time was fixed to the total bleaching energy equivalent to 6 h of SLS bleaching with the device used by Frouin et al. (2015), followed by a 2 h pause. In the Risø device, a bleaching time of 1500 s using a ultraviolet-light emitting diode (UV-LED) within a Risø TL/OSL DA-20 reader was used after Buylaert et al. (2012).
Table 1
Device parameters used for the interlaboratory comparison measurements.
| Laboratory | Device [manufacturing year] | PMT | Filter | Source dose rate [Gy · s−1] | Calibration date | Bleaching power density [mW · cm−2] | Bleaching time [h] |
|---|---|---|---|---|---|---|---|
| Bordeaux | Lexsyg [2012] | H7421-50 | D850/40 | 0.065 ± 0.006 | 04.04.2015 | 375 | 6.00 |
| Bayreuth | Lexsyg [2011] | H7421-50 | HC857/30* | 0.051 ± 0.002 | 18.08.2016 | 313 | 7.20 |
| Freiberg | Lexsyg [2013] | H7421-50 | D850/40 | 0.055 ± 0.003 | 07.10.2014 | 208 | 10.80 |
| Giessen | Lexsyg [2013] | H7421-50 | D850/40 | 0.066 ± 0.002 | 01.02.2016 | 326 | 6.89 |
| Köln | Lexsyg [2011] | H7421-50 | D850/40 | 0.053 ± 0.005 | 27.08.2015 | 326 | 6.90 |
| Leipzig | Lexsyg [2014] | H7421-50 | D850/40 | 0.058 ± 0.004 | 01.08.2016 | 228 | 9.86 |
| Oxford | Lexsyg [2014] | H7421-50 | D850/40 | 0.057 ± 0.003 | 27.11.2017 | 293 | 7.67 |
| Hannover | Risø [2017] | H7421-50 | D900/100* | 0.116 ± 0.006 | 01.10.2020 | 1000# | 0.42# |
* Filters used for the devices at Bayreuth and Hannover have slightly different bandpass for IR-RF measurement.
# The Risø device has a UV-LED bleaching unit, therefore the bleaching time was set to 1500 s after Buylaert et al. (2012)
The Risø device has a few technical differences compared to the lexsyg research device, e.g., the radiation source is not a ring-type module as in the lexsyg research (Richter et al., 2012). Therefore, IR-RF signal detection is facilitated through an optical light guide (Lapp et al., 2012), which reduces the amount of signal from the sample compared to the lexsyg research devices. On the other hand, in the Risø device, the photomultiplier tube (PMT) does not sit directly above the beta source, resulting in a lower background signal. The dose rate of the radiation source for the Risø device is 0.119 ± 0.006 Gy · s−1. Furthermore, as mentioned above, the Risø reader uses the bleaching unit, which consists of a monochromatic UV-LED of 395–410 nm with an optical power of ~1 W (~700 mW · cm−2 at the sample position; Lapp et al., 2012). The parameters of the SLS used for this study are listed in Table 2.
Table 2
Solar simulator spectra settings for each LED normalized to the Bordeaux solar simulator settings.
| LEDs wavelength [nm] | Bordeaux [mW · cm−2] | Bayreuth [mW · cm−2] | Freiberg* [mW · cm−2] | Giessen [mW · cm−2] | Köln [mW · cm−2] | Leipzig [mW · cm−2] | Oxford [mW · cm−2] |
|---|---|---|---|---|---|---|---|
| 365 | 10 | 8 | 6 | 9 | 9 | 6 | 8 |
| 462 | 63 | 53 | 35 | 55 | 55 | 38 | 49 |
| 525 | 54 | 45 | 30 | 47 | 47 | 33 | 42 |
| 590 | 37 | 31 | 21 | 32 | 32 | 23 | 29 |
| 625 | 115 | 96 | 64 | 100 | 100 | 70 | 90 |
| 850 | 96 | 80 | 53 | 84 | 83 | 58 | 75 |
Note: Each solar simulator’s power is normalized to the settings of the lexsyg device from Bordeaux. The bleaching time for every device is estimated using the total flux equivalent to the bleaching of six hours of the device in Bordeaux used by Frouin et al. (2015).
The IR-RF data analysis for this manuscript was carried out using the R (R Core Team 2021) package ‘Luminescence’ (Kreutzer et al., 2012; Kreutzer et al., 2017a).
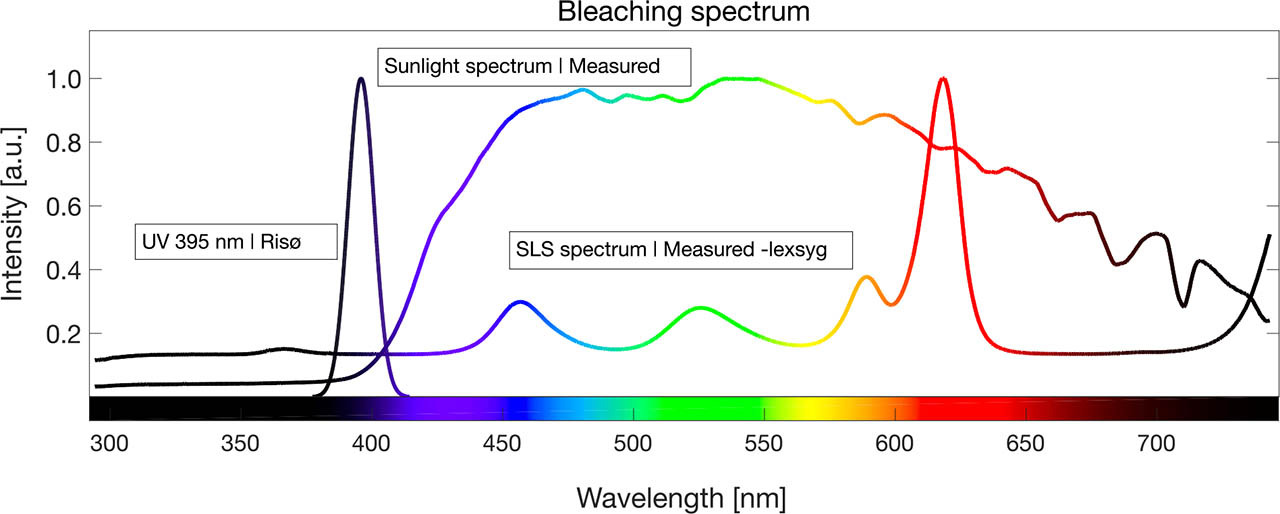
Frouin et al. (2015) optimised the SLS settings at the Bordeaux device for a power density of ~375 mW · cm−2 by maintaining low induced heat on the sample, and these authors suggested the use of minimal flux from UV wavelengths. Bleaching spectra for the sunlight, SLS of lexsyg research devices and the UV-LED for the Risø device are shown in Fig. 1. The parameters of the SLS settings used for this study are tabulated in Table 2, as suggested by Frouin et al. (2015). The spectra of the SLS of the lexsyg device and the sunlight were measured on 9 October 2018, using the spectrometer installed on lexsyg research at the Giessen luminescence laboratory, Germany. The spectrometer system used a Shamrock-163 spectrograph and a Newton 920 BU CCD camera manufactured by Andor, an Oxford Instruments company. An ND10B glass filter (neutral density filter, a product of Thorlabs, 2020) was used to reduce the light intensity. The normalised intensity spectra for sunlight and SLS are plotted against the wavelength in Fig. 1.
Fig. 1
Spectra for sunlight and solar simulator of lexsyg at Giessen measured with the spectrometer while for Risø device, a computer-generated gaussian profile centered at 395 nm plotted for UV-LED (395 nm). The spectrometer is a combination of a spectrograph (Shamrock-163) and a CCD camera (Newton 920 BU) manufactured by Andor, an Oxford Instruments company. To facilitate easy comparison, spectra are normalized to the maximum intensity. Spectra for sunlight and solar simulator were measured with the same spectrometer settings, and light intensity was reduced using the neutral density filter ND 10B.
. SAMPLE CHARACTERISTICS
For the present study, the IR-RF was measured on coarse grain (sand-sized) K-feldspar, extracted from a well-bleached and a geologically old sample (Table 3). The well-bleached sample LUM1225 (150–200 μm, CUD 1-E in Kunz et al., 2010) from a coastal dune from Cuddalore (south-east India) was provided by the Leibniz Institute for Applied Geophysics (LIAG Hannover, Germany). Sample bleaching was confirmed by quartz OSL giving a residual dose of 0.1 ± 0.01 Gy (Kunz et al., 2010). The geologically old sample GI326 was extracted from a Triassic sandstone near Bayreuth, Germany, with an expected age of ~250 Ma (Röhling et al., 2018), having accumulated an estimated dose of ~500 kGy (see Section 4.3). The extraction of K-feldspar involved sampling of the light-shielded inner part of the sandstone (Herman et al., 2010), which was treated with HCl (30%) for 2 days to disaggregate the mineral grains, then following standard preparation methods for extracting the 160–200 μm K-feldspar grain size fraction (e.g., Preusser et al., 2008). This sample was prepared at the luminescence laboratory in Giessen, Germany (Table 3).
Table 3
Samples used for the intercomparison IR-RF measurements.
| Sample code | Sample preparation | Grain size [μm] | Sediment type | Expected age [a] | Method | Reference |
|---|---|---|---|---|---|---|
| LUM1225 | Hannover | 150–200 | Beach dune sand | 0 | Quartz OSL dose | Kunz et al. (2010) |
| GI326 | Giessen | 160–200 | Sandstone | 108 | Stratigraphy | Röhling et al. (2018) |
[i] Note: Sample LUM1225 is GI361 in Murari et al. (2018) and CUD 1-E in Kunz et al (2010).
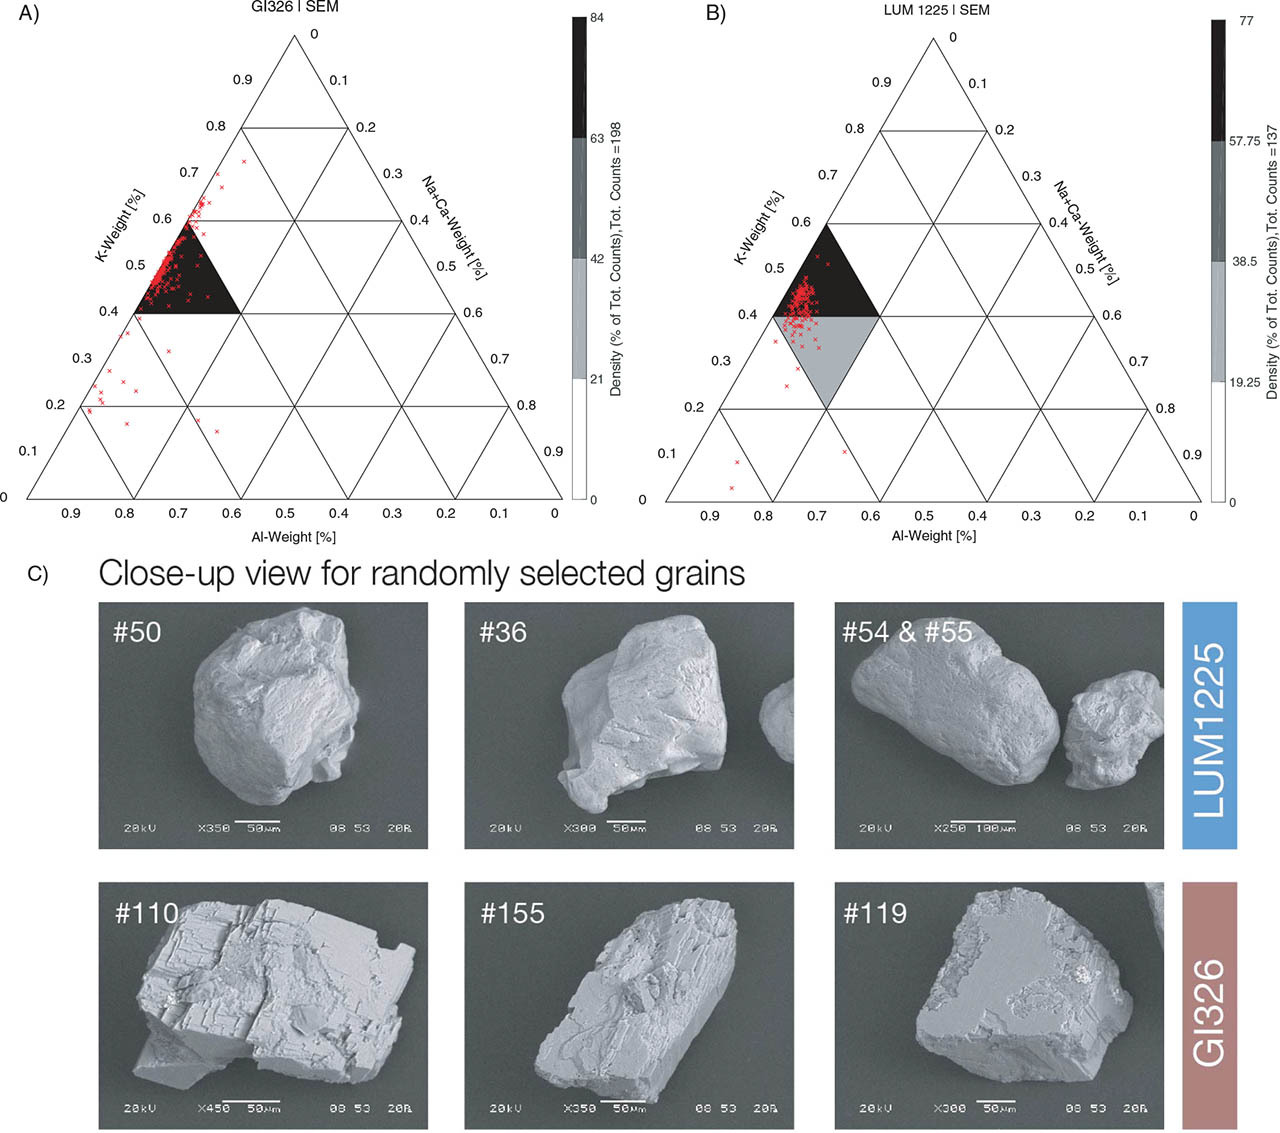
Scanning Electron Microscope Energy Dispersive X-Rays (SEM-EDX) analysis was used to identify the presence of K-feldspar. The prepared sample grains were scanned to detect the abundance of K-feldspar in the sample at the SEM-EDX facility at Bordeaux, France (EOL JSM-6460LV, detector: Oxford Instruments X-Max (51-XMX0002), accelerating voltage 20 kV, beam current 55 μA, automated grain recognition, software: Oxford Instruments INCA version 4.11). A ternary diagram Al-Ca+Na-K was used to infer the K-feldspar concentration (e.g., Nesbitt and Young, 1984), and the elemental concentration was plotted for both samples (Fig. 2). The higher concentration of K (mass%) than the combined content of Ca+Na (mass%) and Al suggests that the samples are dominated by K-rich feldspar grains.
Fig. 2
A) and B) are ternary diagrams for elemental concentration obtained from the SEM analysis. A total of 137 grains for sample LUM1225 and 198 grains for sample GI326 were examined. The ternary diagram shows the atomic weight percentage of potassium (K), combined calcium and sodium (Ca+Na), and aluminum (Al) for each grain. Al was kept as a common element in each feldspar. C) SEM images of randomly selected grains.
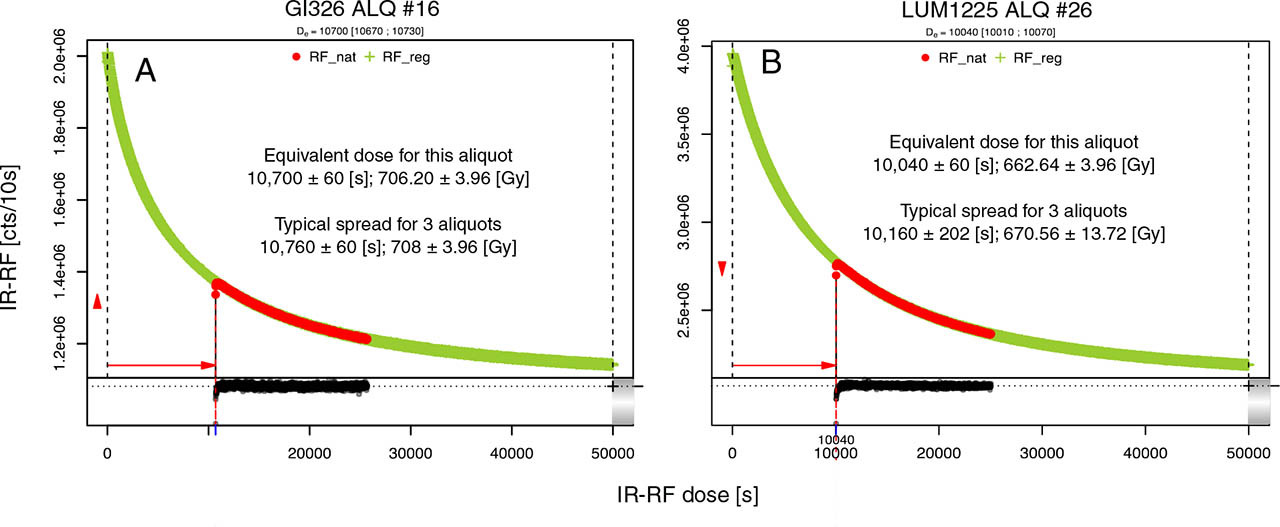
To test the suitability of samples for our interlaboratory comparison, a dose-recovery experiment was carried out using the RF70 protocol (Frouin et al., 2017) at the Giessen laboratory. Prior to the dose-recovery test, both samples were bleached for ~7 h using the SLS. A dose of ~660 Gy (~10,000 s of irradiation) was then given to the samples and determined by the vertical sliding method (Murari et al., 2018). Fig. 3 shows the dose-recovery results, and, in both cases, the given dose of ~660 Gy could be recovered within ±10% uncertainty limit.
Fig. 3
A) and B) show the dose recovery for a given dose of 10 ks (660 Gy) for samples GI326 and LUM1225 measured on lexsyg research at Giessen. Dose was recovered using the vertical sliding method (Murari et al., 2018). The dose rate of used device was 0.066 Gy · s−1 (calibrated on 01.02.2016). Each aliquot for both samples resulted in a dose recovery difference between ca 1.6 % and 7.6 % from unity. Both plots have same units for x-axes and y-axes.
. EXPERIMENTS AND OBSERVATIONS
For the interlaboratory comparison study, two sets of experiments were performed on all devices: (1) background measurement on three empty sample carriers and (2) IRRF measurements for natural (RFnat) and regenerated (RFreg) signals on both samples. Bleaching was conducted using the SLS in the lexsyg research devices, and the Risø device’s UV-LED. Measurement protocols are listed in Table 4.
Table 4
The applied IR-RF protocols.
| Steps | Treatment | Comment |
|---|---|---|
| ## | Protocol for background measurement | |
| 1. | Preheat (70 °C for 900 s) | Temperature stabilization |
| 2. | IR-RF (70 °C for 1 ks) | Background measurement |
| ## | IR-RF Protocol for sample measurement | |
| 1. | Preheat (70 °C for 900 s) | Temperature stabilization |
| 2. | IR-RF (70 °C for 10 ks) | IR-RF Natural (RFnat) |
| 3. | Bleach (70 °C, varying time)* | 8.1 kJ · cm−2 equivalent to Bordeaux |
| 4. | Pause (2 h) | To avoid phosphorescence after bleach |
| 5. | IR-RF (70 °C for 65 ks) | IR-RF Regenerated (RFreg) |
| ## | IR-RF dose recovery measurement protocol at Giessen | |
| 1. | Bleaching (70 °C, 7 h) | 8.1 kJ · cm−2 equivalent to Bordeaux |
| 2. | Pause (2 h) | To avoid phosphorescence after bleach |
| 3. | Preheat (70 °C for 900 s) | Temperature stabilization |
| 4. | IR-RF (70 °C for 10 ks) | IR-RF dose to be recovered |
| 5. | Pause (2 h) | – |
| 6. | Preheat (70 °C for 900 s) | Temperature stabilization |
| 7. | IR-RF (70 °C for 15 ks) | 15 ks IR-RF signal to recover given dose of 10 ks [step 4] |
| 8. | Bleaching (70 °C, 7 h) | 8.1 kJ · cm−2 equivalent to Bordeaux |
| 9. | Pause (2 h) | To avoid phosphorescence after bleach |
| 10. | Preheat (70 °C for 900 s) | Temperature stabilization |
| 11. | IR-RF (70 °C for 50 ks) | IR-RF regenerated curve |
. Background Measurement
To check the overall reliability of the data from the individual devices, background measurements on three empty cups were carried out, following the protocol given in Table 4. In the case of IR-RF measurements, a major source of noise is the radiation source inducing bremsstrahlung. Due to the different ways of signal detection for the lexsyg research and Risø devices, the IR-RF may also have different background signals (see Section 2). It is expected that the Risø device has a reduced background signal, as the PMT is at a fair distance from the beta source (Lapp et al., 2012).
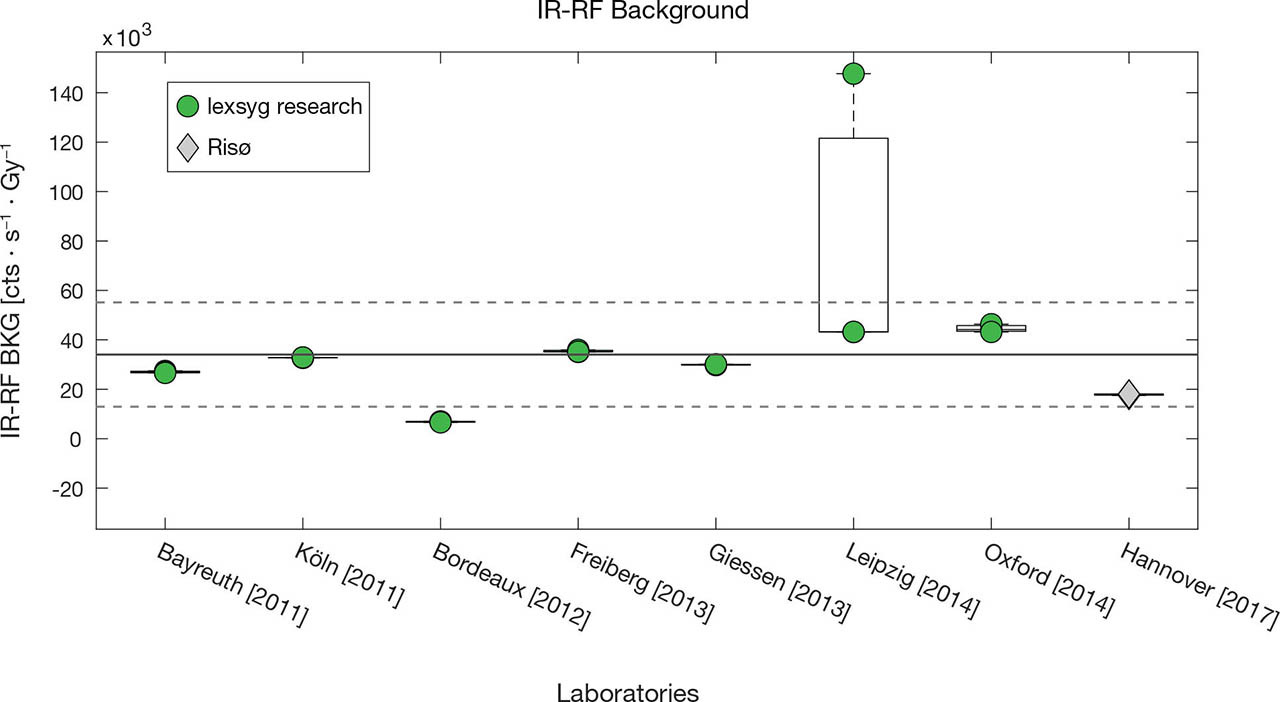
The background data is presented in a box plot in Fig. 4, showing the scatter among all devices from the different laboratories. The average background counts for the five lexsyg research devices amount to 33,932 ± 6729 cts · s−1 · Gy−1, excluding the Bordeaux and Leipzig devices with 6840 ± 160 cts · s−1 · Gy−1 and 78,020 ± 49,265 cts · s−1 · Gy−1, respectively. Given the age of the reader (manufacturing year 2012; installation date at the beginning of 2013), the lower background of the Bordeaux device might be caused by radiation-induced degeneration of the used filter, resulting in a significantly reduced optical transmission (e.g. Gusarov et al., 2005 for investigations on the radiation-induced degeneration of optical components). The Leipzig device’s high average background results from only one extreme value (147,691 cts · s−1 · Gy−1 of one out of three aliquots) and could be attributed to a contaminated aliquot. We observed no signal shape change with respect to measurement time for this particular aliquot, and also, the temperature readings for each measurement remained within 70 ± 1 °C as observed for the other aliquots. Further, the background counts for the Risø device amount to 17,858 ± 250 cts · s−1 · Gy−1, which is, in general, lower as compared to the lexsyg research device. The lower background counts for the Risø device is probably due to the different IR-RF measurement design (Lapp et al., 2012).
Fig. 4
The instrumental background counts for each device are shown in boxplots. The scatter in background counts is measured for three aliquots. Background counts for each device are normalized to the device dose rate. The background levels for the lexsyg research device at Bordeaux (6840 ± 160 cts · s−1 · Gy−1) and the Risø device at Hannover (17,858 ± 250) were on the lower side compared to the average background counts (33,932 ± 6729 cts · s−1 · Gy−1 excluding outlier of Leipzig and lowest background of Bordeaux device). One aliquot out of three from Leipzig shows 1,47,691 cts · s−1 · Gy−1, which is exceptionally high and can be considered an outlier. Further, the background level for the newly installed lexsyg research devices at Leipzig (~43,000 cts · s−1 · Gy−1; excluding one outlier; manufactured in 2014) and Oxford (~45,000 cts · s−1 · Gy−1; manufactured in 2014) is elevated as compared to the average background. (Note: the detection method for the Risø system is different from the lexsyg research device, for more details, see main text).
The observations on the background measurement are:
The average background signal is 33,932 ± 6729 cts · s−1 · Gy−1 for lexsyg devices, except for the Bordeaux device being exceptionally low and for the Leipzig device being exceptionally high. The latter observation might be attributed to a contaminated cup.
The background signal for the lexsyg research devices manufactured in 2014 supplied to Leipzig and Oxford are on the higher side (Leipzig ~ 43,000 cts s−1 · Gy−1 excluding outlier and Oxford ~ 45,000 cts · s−1 · Gy−1) compared to the average background signal of the other five lexysg devices (33,932 ± 6729 cts · s−1 · Gy−1).
The Risø device background signal (17,858 ± 250 cts · s−1 · Gy−1) was lower than the average background signal (33,932 ± 6729 cts · s−1 · Gy−1) of five lexsyg devices, attributed to the different way of signal detection.
. Naturally Bleached Sample: Modern Analogue
A naturally bleached modern dune sand sample (Kunz et al., 2010) was used to test the IR-RF signal’s bleachability. Buylaert et al. (2012) have observed an overestimation of IR-RF ages for young samples, an underestimation for older samples and modern samples (i.e., zero doses) resulting in negative dose values. These results raised doubts about the controlled bleachability of the IR-RF signal. Frouin et al. (2015) observed that IR-RF was bleachable with different SLS wavelengths, following the protocol given in Table 4. Frouin et al. (2015) showed that the SLS of the lexsyg research device with adjusted LEDs settings could achieve a bleaching plateau within 3 h (cf. Fig. 5 in Frouin et al., 2015). Further, a comparison of the bleaching with other variants of luminescence e.g. infrared stimulated luminescence (IRSL) and post infrared-infrared stimulated luminescence (post-IR-IRSL), showed that a 3 h bleaching with a Hönle SOL 500 lamp could reduce the IR-RF signal to its residual level (cf. Fig. 6 in Frouin et al., 2017). In order to minimize phosphorescence, a 2 h pause was given after each bleaching (Erfurt and Krbetschek, 2003a suggested > 1 h).
Fig. 5
The behaviour of natural (RFnat) and regenerated (RFreg) IR-RF curves for a modern sample for all devices. Most of the devices show a noticeable difference between RFnat and RFreg IR-RF signal except for those at köln and Oxford.
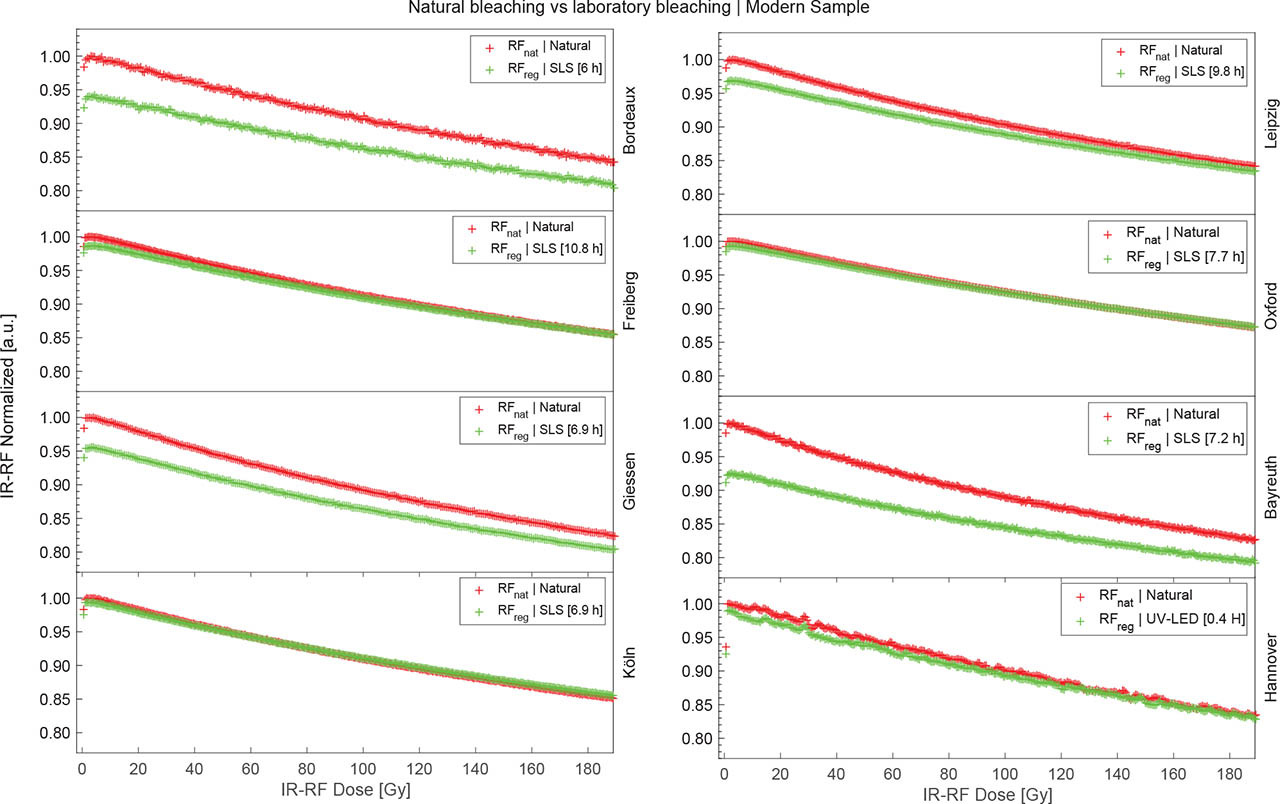
Fig. 6
A) A typical behaviour of IR-RF signals for RFnat and RFreg. B) Dose estimation by sliding the RFreg onto the RFnat signal. C) Boxplot shows the scatter in dose values for individual devices, estimated using vertical sliding of the RFnat signal onto the RFreg signal.
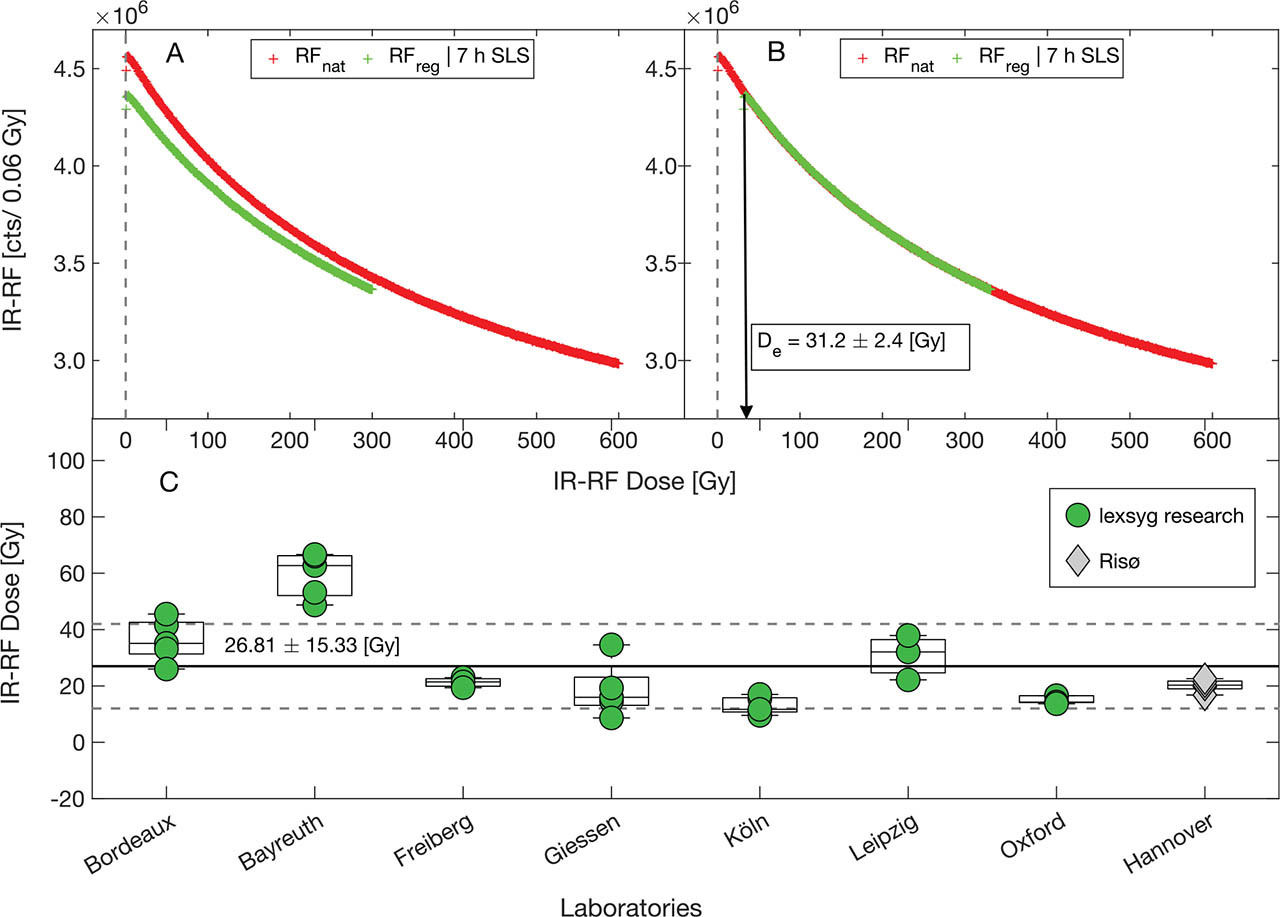
In order to compare the IR-RF bleaching behaviour, the signal from the naturally bleached modern sample (RFnat) and the corresponding regenerated signal after laboratory bleaching (RFreg) were contrasted in the same plot (Fig. 5). It is demonstrated that RFnat is higher in some cases than RFreg and bleaching of the sample in the laboratory with the SLS (lexsyg research) or UV-LED (Risø) cannot reproduce the value of the RFnat signal of the modern analogue sample. Except for the devices at Oxford and Köln, all devices showed a value of the RFnat signal larger by 1–5% compared to RFreg (Fig. 5). The offset of the high natural signal was also estimated in terms of dose value in gray using the vertical sliding method, and the scatter in dose values for the individual equipment is shown as a boxplot in Fig. 6.
The observations on the bleachability for the modern analogue sample are:
Except for the devices at Oxford and Köln, all the devices showed higher RFnat than RFreg signals even after bleaching for a 6 h equivalent flux recommended by Frouin et al. (2015).
Most of the devices showed a difference between RFnat and RFreg up to ~2%. This finding implies a dose offset of ~30 Gy, except for the devices at Bordeaux and Bayreuth.
The maximum difference between RFnat and RFreg was noticed for the devices at Bordeaux and Bayreuth, and the corresponding dose offset was up to ~40 Gy and ~70 Gy, respectively.
. Saturation of IR-RF: Triassic Sandstone Sample
The Triassic sandstone with an age of ~250 Ma (Röhling et al., 2018) was used to assess the saturation level of the IR-RF dating method. Assuming a natural dose rate of 2–2.5 Gy · ka−1, the sandstone sample’s minimum equivalent dose should be ~500 kGy. The data from all devices were analysed using the horizontal and vertical sliding method (Kreutzer et al., 2017b; Murari et al., 2018). All estimated dose values were consistent and provided an average dose of 1265 ± 329 Gy (median 1172 Gy), with the scatter in the dataset caused by some exceptionally high dose values (Fig. 7). The sandstone sample was expected to have a much larger dose value, also because it could be shown that the laboratory-induced IR-RF decays beyond ~3.3 kGy (50,000 s; RFreg in Fig. 2). A similar observation was made by Trautmann et al. (1999a), measuring the dose of a sediment sample from Germany (Ook1). This sample was expected to be >2.6 Ma old, but the authors reported an IR-RF age of 745 ± 144 ka, which would result in an equivalent dose of ~1490 ± 288 Gy to 1860 ± 360 Gy, assuming typical natural environmental dose rate of 2–2.5 Gy · ka−1 (Trautmann et al.,1999a).
Fig. 7
Dose distribution of all measurements for the Triassic sandstone sample (~250 Ma). The dose value ranges from ca 1000 Gy to ca 1700 Gy for the lexsyg research devices except for one outlier (2798.8 Gy) for the device at Freiberg. The dose value for the Risø device is 1080 ± 150 Gy, which is also comparable to the average dose value obtained for the lexsyg research devices. The dashed line indicates the central value, here the weighted mean of the values on a log scale. The grey polygon displays the area of ±2 standard estimates around the central value.
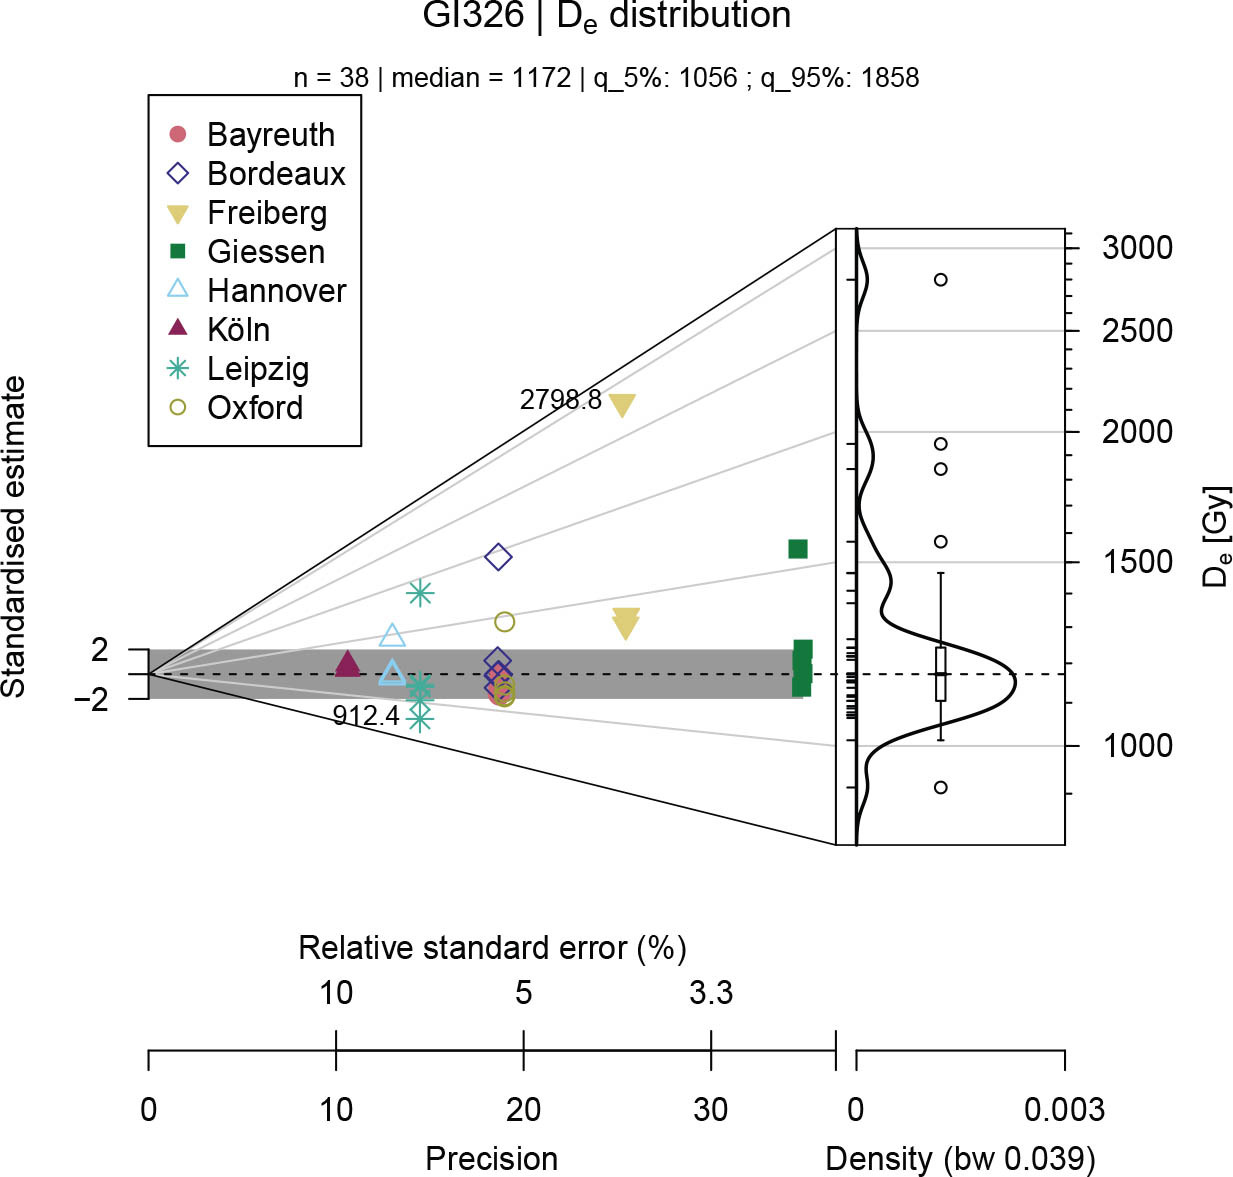
The major observations on the Triassic sandstone sample are:
Determined equivalent doses range from ~1000 Gy to 1700 Gy, excluding the extreme dose value (2798.8 Gy) for one measurement at Freiberg.
The measured average dose value for all laboratories for the sandstone sample with an anticipated minimum palaeodose of ~500 kGy is limited to 1265 ± 329 Gy. This observation is similar to the maximum IR-RF dose range ~1490–1860 Gy estimated from the IR-RF age provided by Trautman et al. (1999a).
The average IR-RF dose value for the Risø device was 1081 ± 117, which was comparable to the lexsyg research device.
. IR-RF Initial Rise
The initial rise behaviour of the IR-RF signal was first reported by Schilles (2002) and later detailed by Huot et al. (2015). Frouin et al. (2017) reported a dependency of the initial rise on the equivalent dose. Its origin is not clear but could be explained by several phenomena possibly coinciding, such as (1) a slow electron trapping rate at the beginning of the stimulation (irradiation), (2) a contribution from radiation-dependent signals other than the central IRRF peak (865 nm) and (3) a contribution from the shallow traps due to temperature variation during the measurement (Huot et al., 2015).
Huot et al. (2015) suggested that a rapid increase in RF at the beginning of the irradiation could be explained by thermally assisted phosphorescence. ‘Minute variations in sample temperature’ (Huot et al., 2015, p. 241) can cause this peak due to shallow traps, which emit phosphorescence in the near-infrared. To avoid this peak, their recommendation was to include a pause for >1 h after bleaching, enabling the sample to lose the low-temperature signal or to measure the RF at an elevated temperature of ~70 °C. In this study, IR-RF was measured at 70 °C with a pause of 2 h after bleaching to circumvent phosphorescence. Despite these steps, the initial rise behaviour was observed for all the devices and for both samples (Fig. 8).
Fig. 8
A) and B) A typical behaviour of Initial rise for IR-RF measurements on Triassic sandstone sample GI326. IR-RF data was normalized to its maximum IR-RF value and smoothed. Every device showed an initial rise in the signal before decaying monotonically. An equivalent dose corresponding to the initial rise point was approximated from the smoothed data as there was a significant amount of noise in the original data. C) Boxplot shows the scatter in estimated dose values for individual devices for 5 aliquots (except Freiberg which has 3 aliquots). The average value of dose for initial rise was equivalent to 19.01 ± 4.24 Gy, and it was slightly lower (15.8 ± 2.3 Gy) for the Risø device. Further, the first IR-RF point for all lexsyg research devices stays at ~3 % lower than its maximum IR-RF point while it was ~6% for the Risø device.
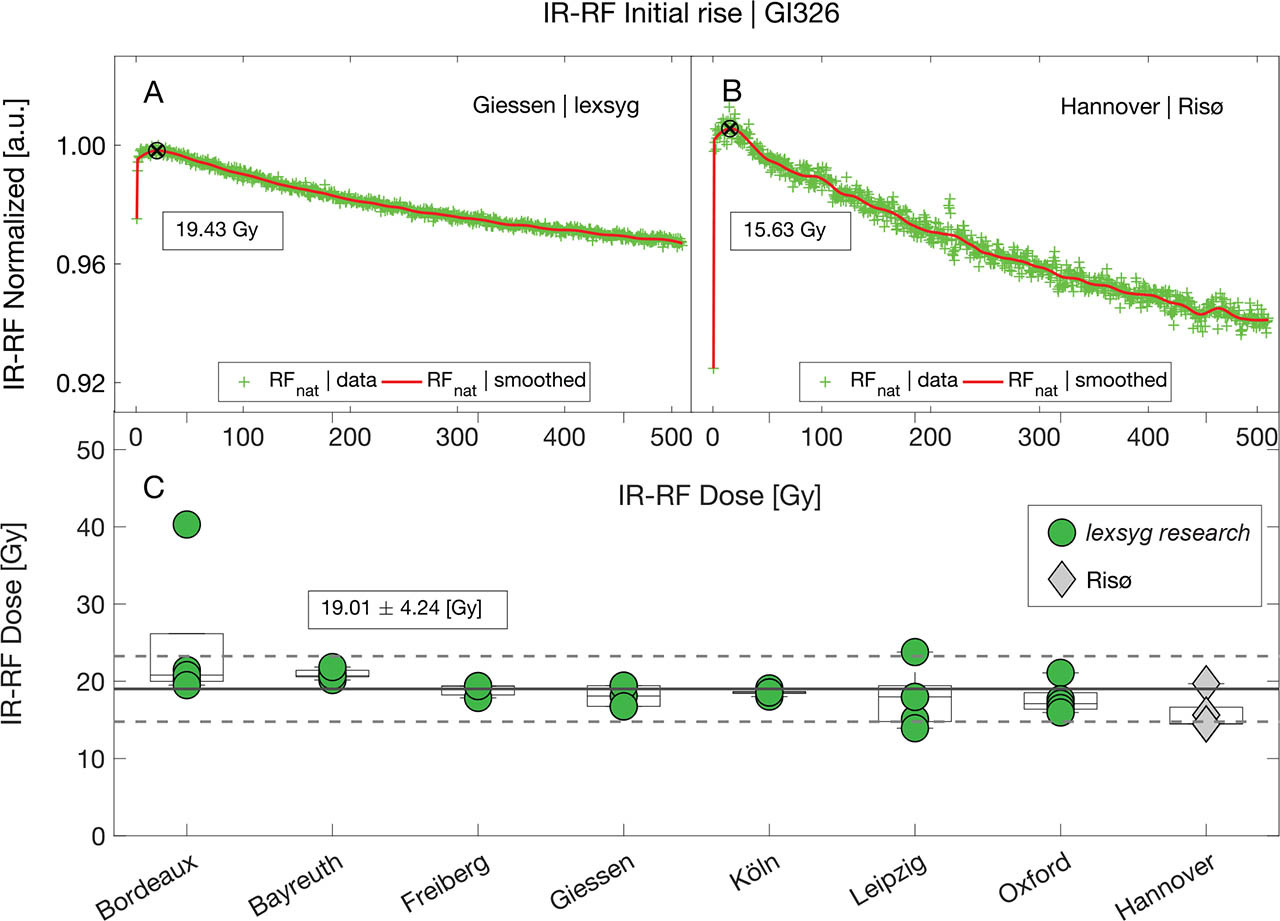
The observations on the initial rise behaviour from all devices are:
Every device exhibits the initial rise at the beginning of the IR-RF signal, measured at 70 °C on a lexsyg and Risø device.
Measurements on a Risø device showed that the first IR-RF measurement point stays lower by ~6% of the maximum IR-RF point while it is limited to ~3% for all lexsyg research devices.
The IR-RF signal typically starts decreasing after ~3 Gy for the naturally bleached sample (see Table 5 for sample LUM1225). For the old sandstone sample GI326, all the devices exhibit an initial rise equivalent to 19.04 ± 4.24 Gy. A slightly higher initial rise equivalent to 24.4 ± 8.9 Gy was observed for the Bordeaux device while it was 15.8 ± 2.3 Gy and thus slightly lower for the Risø device.
Table 5
The observations made on all devices for background, initial rise, bleaching of the modern analog dune sand sample LUM1225 and the sandstone sample GI326 which was ~250 Ma old.
| ##Initial rise IR-RF dose [Gy] | Modern sample [LUM1225] | Old sample [GI326] | |||||||||
|---|---|---|---|---|---|---|---|---|---|---|---|
| Labs | Device [manufacturing year] | +Background [cts · s−1 · Gy −1] | RFreg [0 Gy] | RFnat [~1200 Gy] | *Δ IR-RF [%] | #Equivalent IR-RF dose [Gy] | IR-RF Dose [Gy] | ||||
| Bordeaux | Lexsyg [2012] | 6840 ± 160 | (n = 3) | 3.1 ± 0.5 | 24.4 ± 8.9 | (n = 5) | 4.2 ± 1.5 | 36.3 ± 7.6 | (n = 5) | 1539 ± 438 | (n = 5) |
| Bayreuth | Lexsyg [2011] | 26627 ± 406 | (n = 3) | 3.5 ± 1.4 | 20.9 ± 0.6 | (n = 5) | 5.1 ± 1.7 | 59.5 ± 8.1 | (n = 5) | 1115 ± 49 | (n = 5) |
| Freiberg | Lexsyg [2013] | 35417 ± 456 | (n = 3) | 3.2 ± 0.8 | 18.9 ± 0.9 | (n = 3) | 0.8 ± 0.5 | 21.3 ± 1.8 | (n = 3) | 1599 ± 591 | (n = 6) |
| Giessen | Lexsyg [2013] | 29912 ± 183 | (n = 3) | 2.9 ± 0.4 | 18.1 ± 1.3 | (n = 5) | 1.3 ± 1.8 | 18.6 ± 9.7 | (n = 5) | 1259 ± 179 | (n = 5) |
| Köln | Lexsyg [2011] | 32788 ± 91 | (n = 3) | 2.9 ± 0.3 | 18.6 ± 0.4 | (n = 5) | 0.2 ± 0.4 | 12.9 ± 3.1 | (n = 5) | 1234 ± 30 | (n = 5) |
| Leipzig++ | Lexsyg [2014] | 43185 ± 62 | (n = 2) | 2.9 ± 0.3 | 17.8 ± 3.8 | (n = 5) | 2.2 ± 1.3 | 30.7 ± 7.9 | (n = 5) | 1199 ± 383 | (n = 5) |
| Oxford | Lexsyg [2014] | 44567 ± 1598 | (n = 3) | 3.0 ± 0.3 | 17.7 ± 2.0 | (n = 5) | 0.1 ± 0.5 | 15.1 ± 1.4 | (n = 5) | 1163 ± 176 | (n = 5) |
| Hannover | Risø [2017] | 17858 ± 306 | (n = 3) | 2.6 ± 0.5 | 15.8 ± 2.3 | (n = 5) | 1.3 ± 0.6 | 20.2 ± 2.2 | (n = 5) | 1081 ± 117 | (n = 5) |
+ Background: All devices have different dose rates, therefore background counts per second were normalized to the dose rate of each device.
++ Leipzig background values were estimated without the outlier aliquot, which had background counts of ~147,691 cts · s−1 · Gy−1.
* Δ IR-RF: The percentage change between the RFnat and RFreg was estimated from the maximum value of IR-RF signal and the uncertainty is the standard deviation of the aliquots used for the measurement.
# Equivalent IR-RF dose: An estimation of offset in terms of dose using the vertical slide method, but RFreg was slided on RFnat as RFnat > RFreg.
## Initial rise IR-RF dose: The dose value equivalent to the initial rise was estimated using the maximum of the IR-RF signal where the signal starts to decay normally. Estimation of maximum IR-RF point was approximated by smoothing IR-RF data. It was estimated for both samples, LUM1225 modern analogue (bleached) sample and GI326 old sandstone (saturated) sample.
. DISCUSSION
. Why is the RFnat Signal Elevated for the Naturally Bleached Sample?
The naturally bleached modern analogue sample shows an RFnat signal > RFreg. The difference between RFnat and RFreg was equivalent to a dose offset of ~20 Gy. The reasons could be (1) a loss of grains from the aliquots, (2) a geometry change of the sample in relation to the detection unit (Erfurt and Krbetschek, 2003a) and (3) a change in sensitivity of the sample due to laboratory bleaching, irradiation or a combination of both factors; or (4) simply that sunlight bleaching is more effective than the SLS and UV bleaching, except for the Oxford and Köln devices (Table 5).
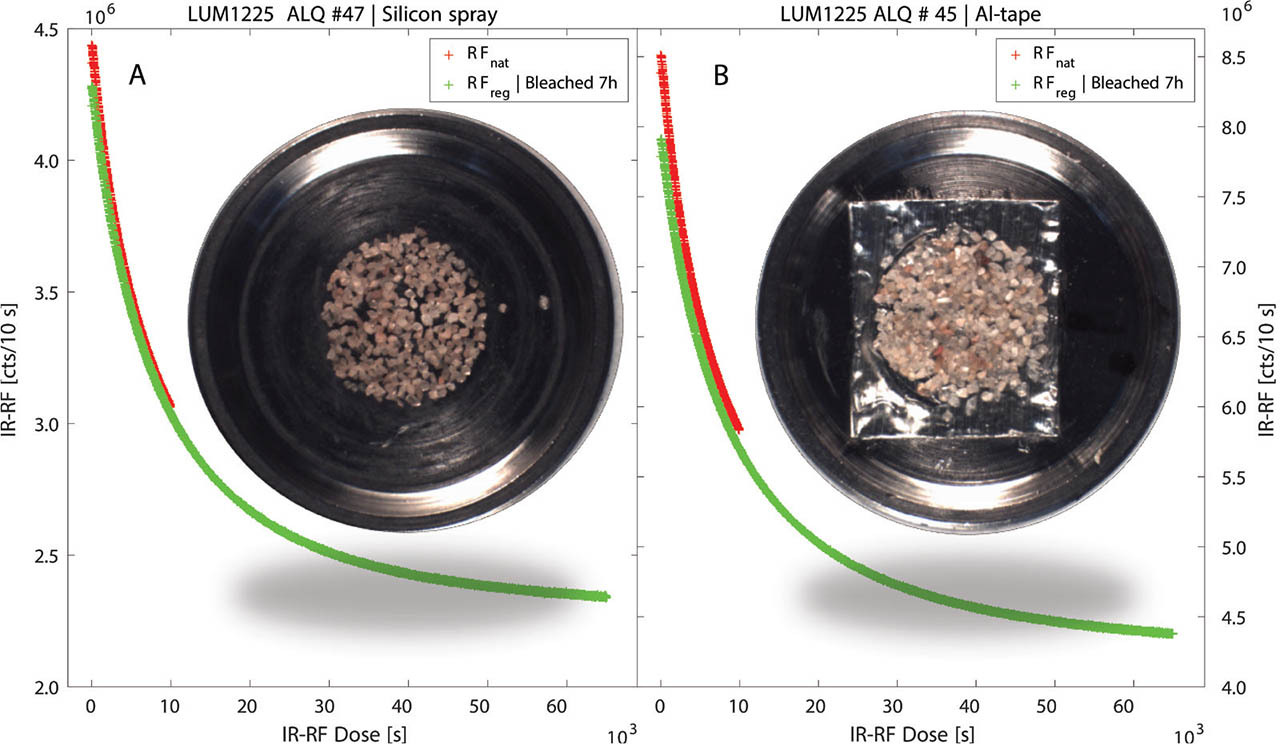
Loss of grains: To exclude grain loss as a cause, an additional experiment was conducted by mounting the sample using aluminium tape as an adhesive. IR-RF measurements with the lexsyg research device at Giessen using conventional sample mounting showed ~1–4% change in signal. The same values were observed for the aluminium-tape mounted sample, while the RFnat signal was still higher than the RFreg. This implies that loss of grains is not responsible for the observation RFnat >> RFreg signal (Fig. 9).
Fig. 9
A) IR-RF signal from the modern analog sample LUM1225, mounted with silicon oil on the cups. B) IR-RF signal when the same sample is mounted with aluminum adhesive tape (Tesa company), heat resistant up to 140 °C. The Al tape prevents grain loss or further lateral dispersion of grains on the sample carrier during the measurement. However, the RFnat intensity is always higher than RFreg for both cases.
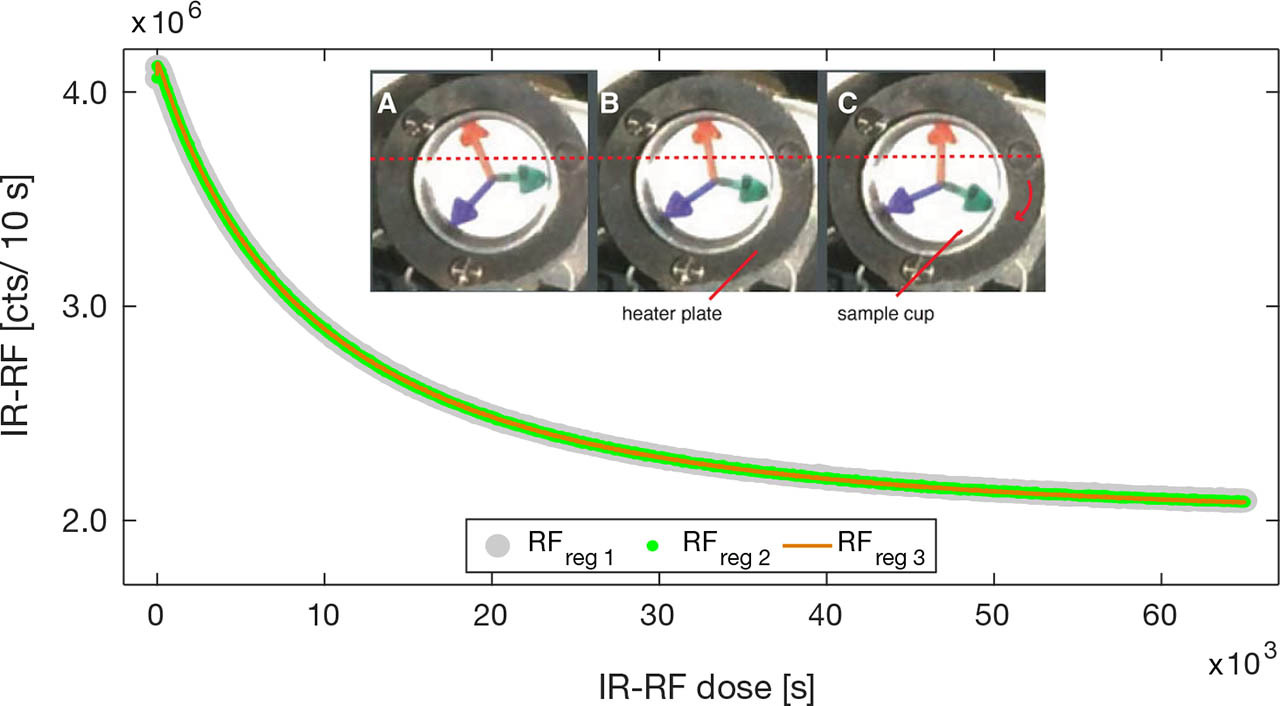
Change of geometry:Erfurt and Krbetschek (2003a) emphasised that the sample geometry during measurement must be maintained. In this study, a sample cup was marked for testing this, and its position was recorded on the lexsyg research device at Giessen. However, although a slight rotation occurred during the sample cup movement between measurement and bleaching position, multiple measurements of the RFreg signal after bleaching did not show any significant change (Fig. 10). This experiment confirms that, despite having a change in rotation, it does not significantly affect the signal and cannot explain the high levels of RFnat.
Fig. 10
A series of photos from A to C showing the change in sample geometry. A sticker was placed in a sample cup with markings of three arrows. The arrows’ different positions clearly show the movement of the cup when the arm moves from one position to another. The IR-RF curves blue, yellow, and red are the repeated measurements of RFreg of the same aliquot. The sample was bleached for 7 h with the solar simulator followed by a pause of 2 h before measurement of RFreg. All three repeated regenerated RFreg curves do not show any significant change in shape and intensity. The overlapping three repeated RFreg curves confirm that the rotation geometry change has no significant effect on the IR-RF signal.
Sensitivity change or incomplete bleaching: IRSL sensitivity change for feldspar upon light exposure has been reported in the past, and Li and Wintle (1992) observed a sensitivity decrease of 27% for colluvial samples bleached with a SLS. Further, Richardson (1994) has reported that light exposure does not affect the sensitivity, but heating at 450 °C showed a significant decrease in sensitivity. Similar observations were noticed for the IR-RF measurements in this study (Fig. 5). In most cases, RFnat is higher than RFreg, except for the Oxford and Köln devices, but multiple cycles of SLS bleaching inside the lexsyg research device could reproduce RFreg intensities without significant difference (Fig. 10). However, unlike conventional feldspar luminescence, the IR-RF signal is believed to be a direct measure of the fraction of empty electron traps, and sensitivity change might relate to different mechanisms. For instance, IRSL or TL involve complex transition pathways between traps and recombination centres (TL; cf. Aitken, 1985; IRSL; Hütt et al., 1988).
An RFnat signal of higher intensity than the RFreg signal may imply that natural sunlight is more effective in optical signal resetting than SLS bleaching and that after laboratory bleaching, a residual signal remains. However, the reproducibility of RFreg intensities suggests that the same level of bleaching can be achieved repeatedly with the built-in SLS of the device (Fig. 10). Furthermore, previous experiments confirmed that complete bleaching could be achieved from a fraction of an hour to a few hours, e.g. 30 min using a 250 W OSRAM metal halide (Krbetschek et al., 2000), 25 min using a 700 mW cm−2 UV-LED, ~4 h using a Hönle SOL 2 SLS (Buylaert et al., 2012) and 3 h using an SLS in lexsyg research devices (Frouin et al., 2015, 2017). If we assume complete optical RF signal resetting, another possible cause for RFnat > > RFreg signal could be the sensitivity change due to laboratory treatments (bleaching or irradiation or due to both). Schilles and Habermann (2000), Erfurt and Krbetschek (2003a), Varma et al. (2013) and Murari et al. (2018) have observed IR-RF sensitivity changes in their studies. Erfurt and Krbetschek (2003a) found that it may lead to an equivalent dose deviation of ~3%.
. Why do we Observe Early Saturation for Old Samples?
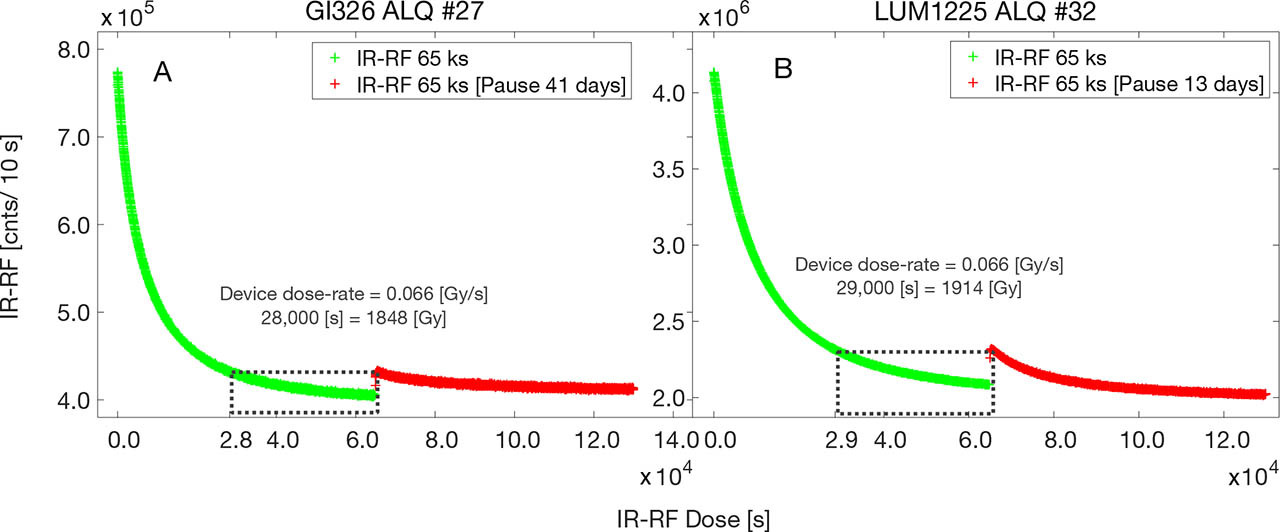
Shallow traps: The observations on the saturated sample suggest that the IR-RF dose value (1265 ± 329 Gy) determined is significantly underestimated for the sandstone sample from Bayreuth, Germany, which is of Triassic age (~250 Ma). Therefore, this sample should have a minimum De of ~500 kGy assuming a minimum natural effective dose rate of 2 Gy · ka−1. One of the possible underlying reasons is the participation of shallow traps in IR-RF signal production. Since IR-RF is measured directly under continuous radiation stimulation, shallow traps also contribute to the signal and drain their charge when the sample is cut off from the radiation. Hence, one experiment was designed to detect the potential effect of shallow traps: both samples were first bleached with the SLS for 7 h. IR-RF was measured for 65 ks (4.29 kGy) and then measured again for the same duration (dose) after a pause of a few days. This preliminary examination shows that a given dose of 4290 Gy resulted in a De of ~1900 Gy after 13 days and 41 days of pause. This experiment suggests that the IR-RF signal for these samples approaches saturation earlier than the given dose of ~4290 Gy (Fig. 11) and indicates a kind of signal loss for large doses. However, further experiments will be required to establish its characteristics and determine the typical saturation dose.
Fig. 11
Early saturation of the geological sample. A) and B) show two measurements of IR-RF before and after a pause. Green-coloured IR-RF for a dose equivalent to 4,290 Gy is recorded just after bleaching of the sample for 7 h, and red-coloured IR-RF is recorded after the pause of several days. The units of the y-axes are similar for both figures.
. CONCLUSIONS
The interlaboratory comparison carried out on eight IR-RF systems suggests the following:
The instrumental background for all devices is 33,932 ± 6729 cts · s−1 · Gy−1, except the device from Bordeaux, which yields 6840 ± 160 cts · s−1 · Gy−1. The background of ~45,000 cts · s−1 · Gy−1 and ~43,000 cts · s−1 · Gy−1 is higher for the newly manufactured lexsyg research at Oxford (in 2014) and Leipzig (in 2014), while it is lower for the Risø device (~17,853 cts · s−1 · Gy−1), likely due to the difference in signal detection conditions. As expected, background levels are higher than other variants of luminescence (e.g., OSL or IRSL) since signal detection takes place close to the beta source.
For the naturally bleached sample, RFnat > RFreg in all systems, except for the Oxford and Köln devices, which show significantly lower differences. The signal difference for most devices equates to an average dose offset of ~26.8 Gy, except for the devices at Bordeaux and Bayreuth, showing offsets of up to ~40 Gy and ~70 Gy, respectively.
Loss of grains and/or a change in the geometry during multiple measurements do not explain the higher RFnat in comparison to RFreg. It is concluded that the sensitivity changes due to laboratory procedures, which may cause such differences. However, the devices at Oxford and Köln do not show this change, and the reason for it is unclear.
As determined for the Triassic sandstone sample (~250 Ma), the saturation dose is in the range of 1265 ± 329 Gy. This is far lower than the expected minimum dose of ~500 kGy for this particular sample.
Preliminary examination of shallow traps showed that after giving a laboratory dose of 4290 Gy, the dose determined with IR-RF amounts to ~1900 Gy after a few days of storage. This finding needs a more detailed investigation.
Every device exhibits an initial rise even after measurement at an elevated temperature of 70 °C. It corresponds to an average dose of 19.01 ± 4.24 Gy for all the devices for the older sample GI326. The device at Bordeaux (24.4 ± 8.9 Gy) is on a slightly higher side while the Risø device ranges a little bit lower (15.8 ± 2.3 Gy) than the average. However, the initial rise is limited to ~3 Gy for all the devices for the modern sample LUM1225.