
. Introduction
Poland is relatively rich in brick buildings that are potentially valuable for reconstruction of changes of geomagnetic field parameters during the last millennium. The brick buildings have been constructed here since the beginning of the 13th century and they are still quite numerous. Despite this, the archeomagnetic studies of baked clay from Poland stopped in the 80th year of the last century (Czyszek and Czyszek, 1987). There are no archeomagnetic points in Poland marked on the more recent maps of archeomagnetic sites of Europe (Schneep and Lanos, 2006). A substantial progress in laboratory techniques and methodology of elaboration of data causes ca. 40-year-old archeomagnetic results from Poland now seem to have mainly historical value. It should be stressed, however, that due to a very stable thermoremanent magnetisation of bricks, the inclination curve constructed for the Gdańsk area (N Poland) on the base of the data from 30 sites (Czyszek and Cyszek, 1987) is most probably at least partly credible.
One of the biggest problems with application of the bricks in archeomagnetism is the risk of reusing them for longer time after their production and first utilization. Another difficulty is the limited access to statistically representative number of independently oriented samples, i.e. single ancient brick, since archeomagnetic method is invasive and leads to destruction of a part of each brick used. A considerable number of samples are necessary because the bricks were not sometimes precisely (i.e. horizontally) oriented during burning, and because of this, the mean inclination of ancient geomagnetic field obtained from them should be sufficiently averaged.
Extensive archeomagnetic studies of paleosecular variations of geomagnetic field in Western, Southeast and Central-West Europe provided data for the construction of the reference curves for the last three millennia (e.g. Pavón-Carrasco et al., 2009). One of the common features of all averaged regional curves with secular variation of inclinations during the last 800 years is consistent increase of inclination from ca. 1400 AD to ca. 1600–1700 AD and its stepwise decrease up to the end of the 19th century (i.e. Goff, 2002; Schneep and Lanos, 2006; Schnepp, 2008, Schnepp et al., 2009).
The construction of regional curves of secular variations of the geomagnetic field is not only valuable for the definition of changes of its basic features in time and space but also a valuable dating tool for ceramic and other backed artefacts. This method can be especially productive if archeomagnetic data from artefacts of unknown age are correlated with the reference archeomagnetic curves presenting changes of more than one geomagnetic field parameter. Usually, for the bricks from historical building, the intensity and inclination curves are used for this purpose. The third parameter, i.e. the declination of ancient geomagnetic field, needs an in situ position of the backed artefacts with respect to the firing place. Because of this any brick building cannot provide it.
The aim of this paper is to reconstruct the variations of inclination of the geomagnetic field in SE Poland between 1200 and 1800 AD. The samples for this purpose were taken from selected historical brick buildings. This is the first part of our studies dedicated to the secular variation of intensity and inclination of geomagnetic field during the last millennium in SE and N Poland. In this paper, we estimate the amplitudes of inclination secular variation, ages of its minima and maxima, and the velocity of its change in particular time intervals enclosed between 1200 and 1800 AD. The similarities and differences between the reference curve from SE Poland and coeval archeomagnetic recorded from selected regions of Europe are shown and discussed.
. Material and Methods of Study
A set of drill core and hand samples (pieces of separate bricks) were taken from 26 historical brick buildings: castles, palaces, churches, town halls, monasteries, tenement houses, and military walls constructed in SE Poland (Fig. 1; Table 1). Sixty-seven bricks of known age were sampled in total. All samples were cut into 1 inch diameter and 22-mm-long cylindrical specimens that were demagnetized thermally in nonmagnetic oven MMTD (Magnetic Measurements Ltd.). The alternating field demagnetization has not been done because the same samples were used for the analysis of geomagnetic field intensity. The remanent magnetization (RM) was measured after each level of demagnetization by means of the JR-6A spinner magnetometer (Agico S.r.o.). The magnetic susceptibility and its anisotropy of the studied bricks were estimated using the MFK1-FB kappabridge (Agico S.r.o). The AMS attributes (Jelinek, 1981) were calculated by applying the ANISOFT package. The level of their uncertainty was computed by adopting the linear perturbation test (Jelinek, 1978). The semi-axis of the uncertainty ellipse ɛ was described by symbols 1, 2, and 3 that were attached to the main axes of anisotropy ellipsoid Kmax, Kint, and Kmin, respectively. The results of demagnetization were analysed using orthogonal vector plots (Zijderveld, 1967). The directions of their linear segments were calculated using principal component analysis (Kirschvink, 1980).
Fig 1
(a) Location of sites selected for archeomagnetic studies in SE Poland and listed in Table 1. (b) Drilling of bricks in the ruins of Discalced Carmelites monastery at Zagórz (locality no. 22).
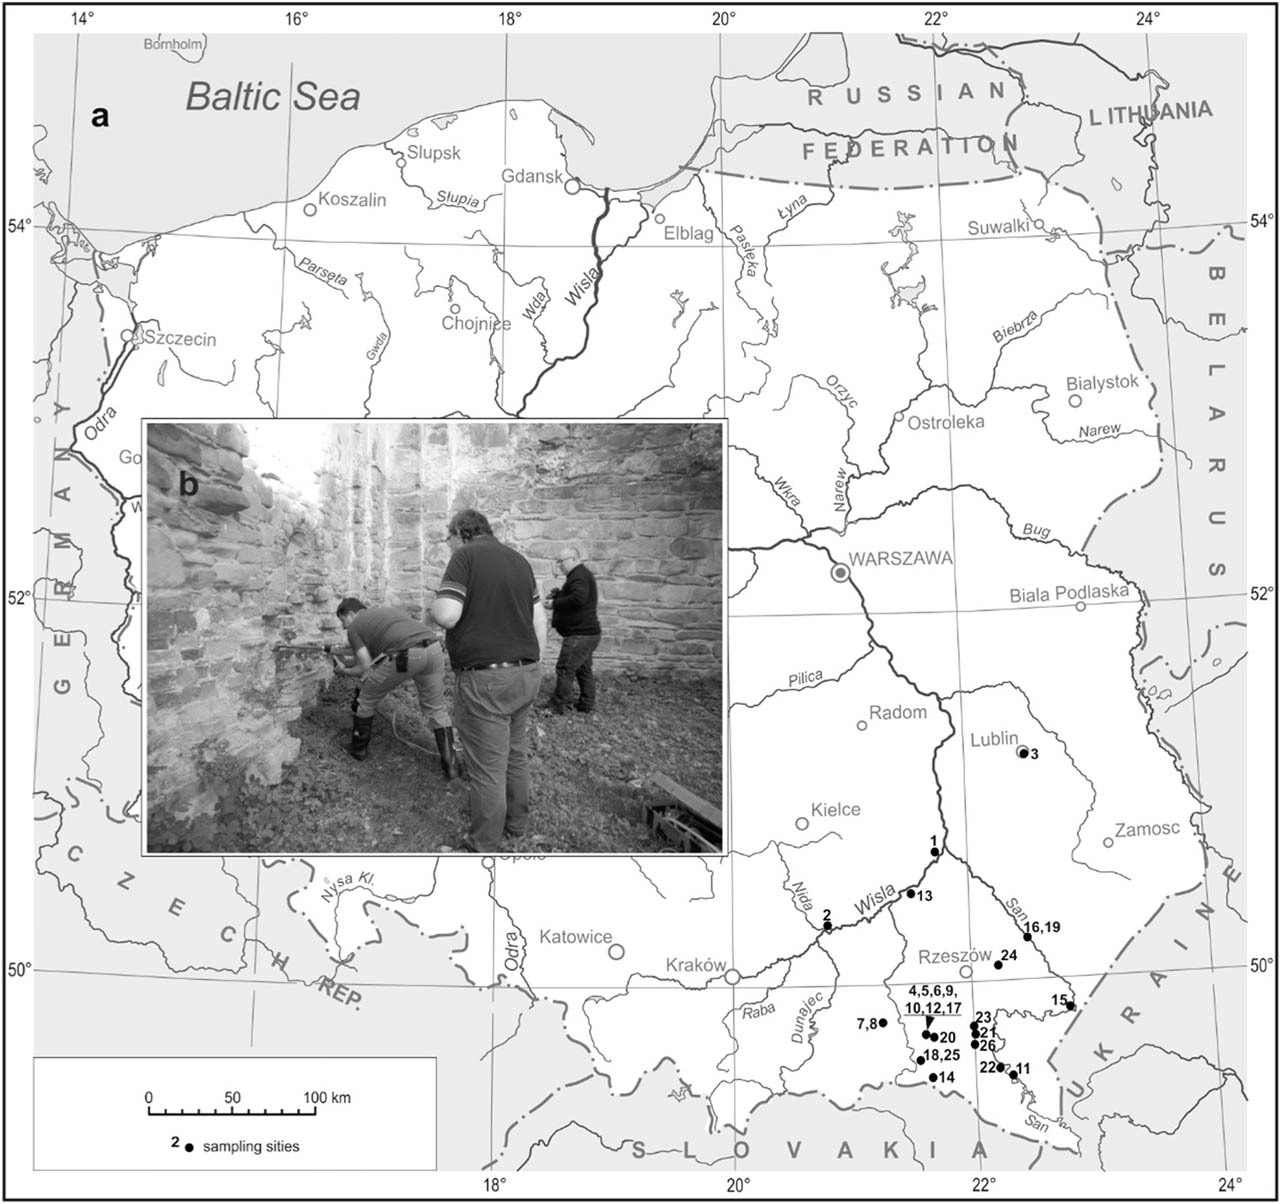
Table 1
Brick buildings in SE Poland and characteristic inclinations of geomagnetic field isolated from them and recalculated for the city of Rzeszów geographic coordinates.
Magnetic mineralogy was determined for the selected samples by applying parameters of hysteresis loops obtained in the fields of 0-1T using the AGM 2900-02 Micromag alternating gradient magnetometer (Princeton Magnetic). The changes in magnetic susceptibility during subsequent heating and cooling at range 20–700 °C with KLY5 kappabridge and CS4 high temperature unit (Agico S.r.o.) were also applied for this purpose.
The graphs of inclination secular variations were obtained from the approximation of the measured values by means of polynomial of the 8th degree that allows a good accuracy of fitting and smoothing of data. For this calculation, the Origin Pro 9.0 software was used.
We assumed that the orientation of bricks in the ovens was the same in each epoch of the last century, i.e. all were positioned horizontally on their narrow long sides. Most probably, bricks in the oven deviated slightly from this position. The averaging of inclinations obtained from more than one brick should limit this problem. The ages of particular historical buildings were estimated according to the existing historical sources. However, their accuracy was defined arbitrarily as not less than 5 years even if historical sources give more precise ages. This is due to a possible time gap between the production of bricks and their use for the construction of buildings. In the case when information about the age of a particular building was not direct, e.g. referred to its funding, we assumed the age accuracy of ± 15 years.
. Results
. Magnetic carriers and anisotropy of magnetic susceptibility
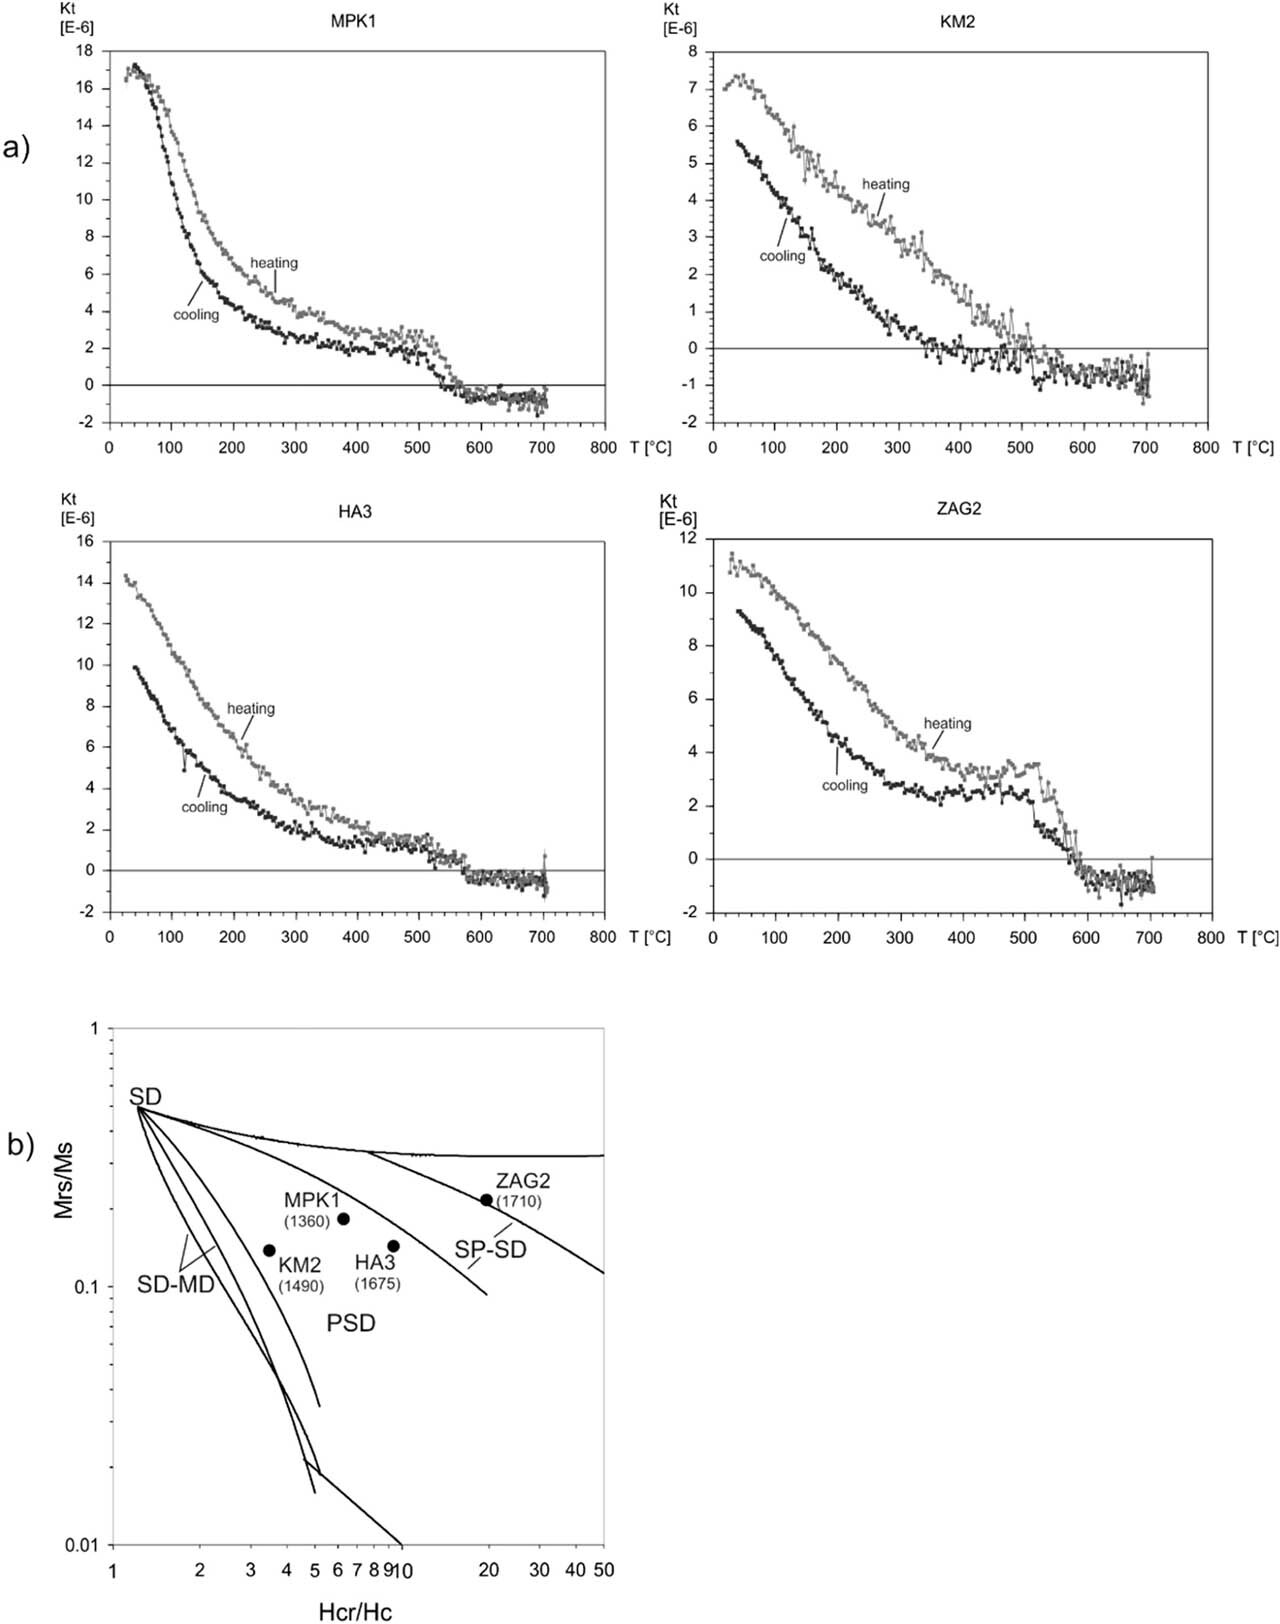
All heating curves for magnetic susceptibility at 20–700°C indicate that in the studied brick samples, the magnetite with unblocking cooling temperature enclosed between 550 and 580 °C is the main carrier of magnetic susceptibility (Fig. 2a). The magnetic susceptibility is predominantly carried on ferromagnetic fraction as it can be inferred from hysteresis parameters, and therefore, we can state that magnetite is also the main carrier of remanent magnetization of studied bricks. Its grains are of pseudo-single domain to superparamagnetic/single-domain type (Fig. 2b). The cooling curves repeat the heating ones and because of this, we can assume that no significant chemical changes (oxidation) of magnetic fraction took place during thermal demagnetization.
Fig 2
(a) Changes of magnetic susceptibility during heating and cooling at 20–700 °C range observed in selected brick samples from historical buildings of SE Poland (MPK1 – Krosno, defensive wall; KM2 – Krosno, defensive wall near Franciscan monastery; ZAG2 – Zagórz, Discalced Carmelites monastery; HA – Haczów, mansion). (b) Day plot (Day et al., 1977) for the same brick samples. Hysteresis parameters: Mrs/Ms versus Hcr/Hc rations for single-domain (SD), pseudo-single domain (PSD) and multi-domain (MD) grains, indicated by broken lines (SD/MD and SD/superpara-magnetic (SP) grains) are shown after Dunlop (2002).
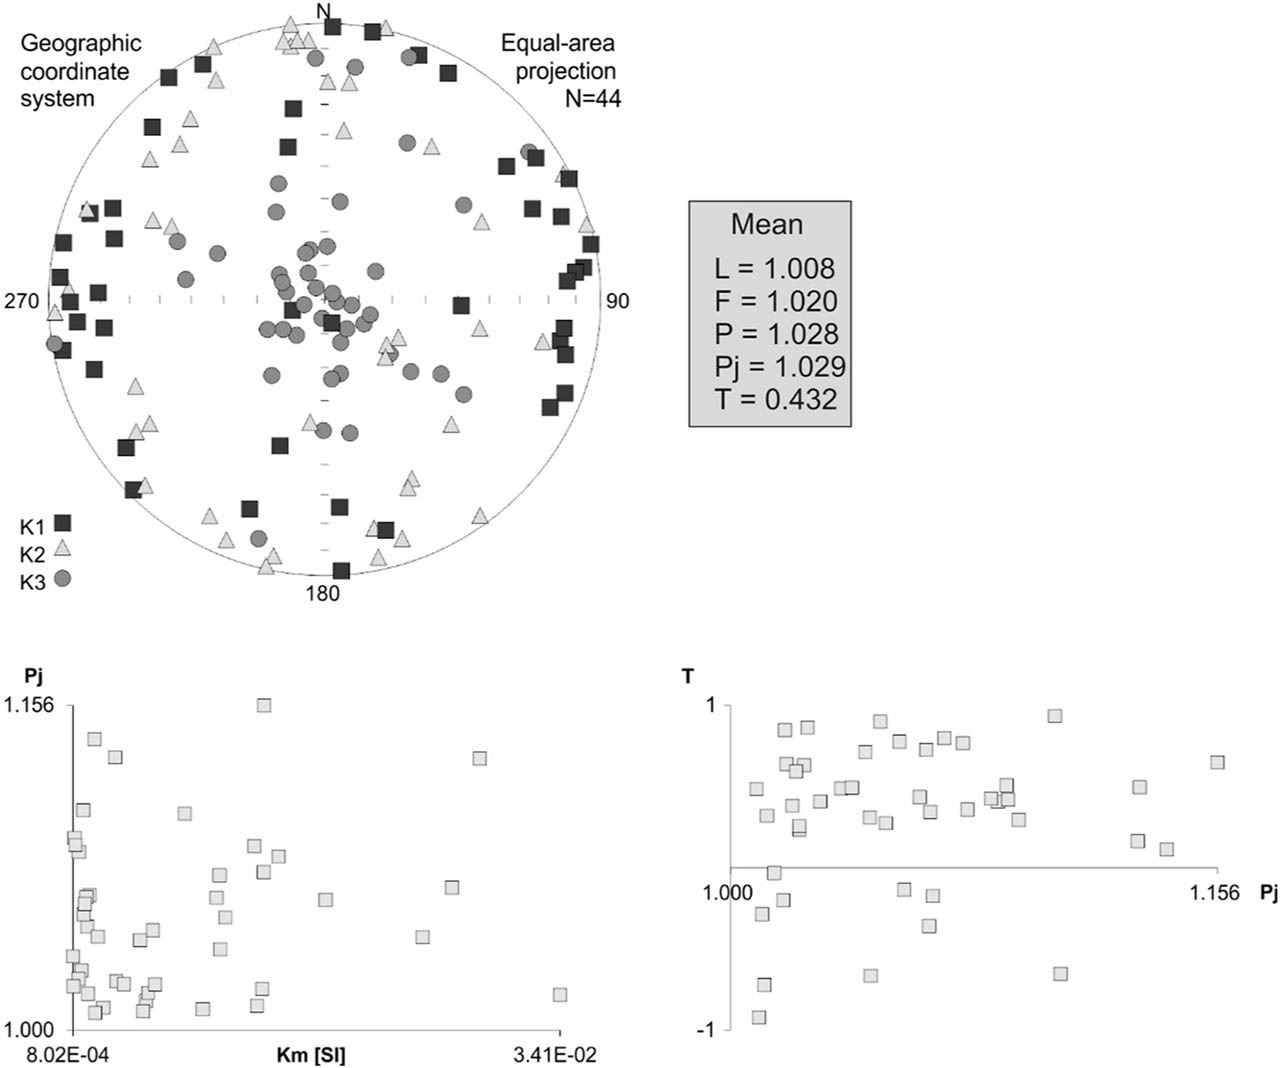
The mean value of corrected anisotropy factor Pj calculated for 44 brick specimens is 1.029 (Fig. 2). For 38 specimens, it is less than 1.10, being comparable with that noted, for example, in sedimentary rocks like loess from Eastern Europe (Nawrocki et al., 2019). In most of the specimens, the AMS ellipsoid is oblate, i.e. the magnetic foliation is predominant. Vertical and nearly vertical orientations of minimum susceptibility axes (Fig. 3) indicate that the foliation plane is approximately parallel to the narrow long side of a brick. This side was horizontal during firing.
Fig 3
Results of the AMS studies of 44 brick samples presented as equal area projection of AMS principal axes and relationships between the AMS parameters T (shape parameter), Pj (corrected anisotropy factor), and Km (volume magnetic susceptibility). The mean values of L (lineation), F (foliation), P (anisotropy factor), Pj, and T are listed in the table.
. Thermal demagnetization
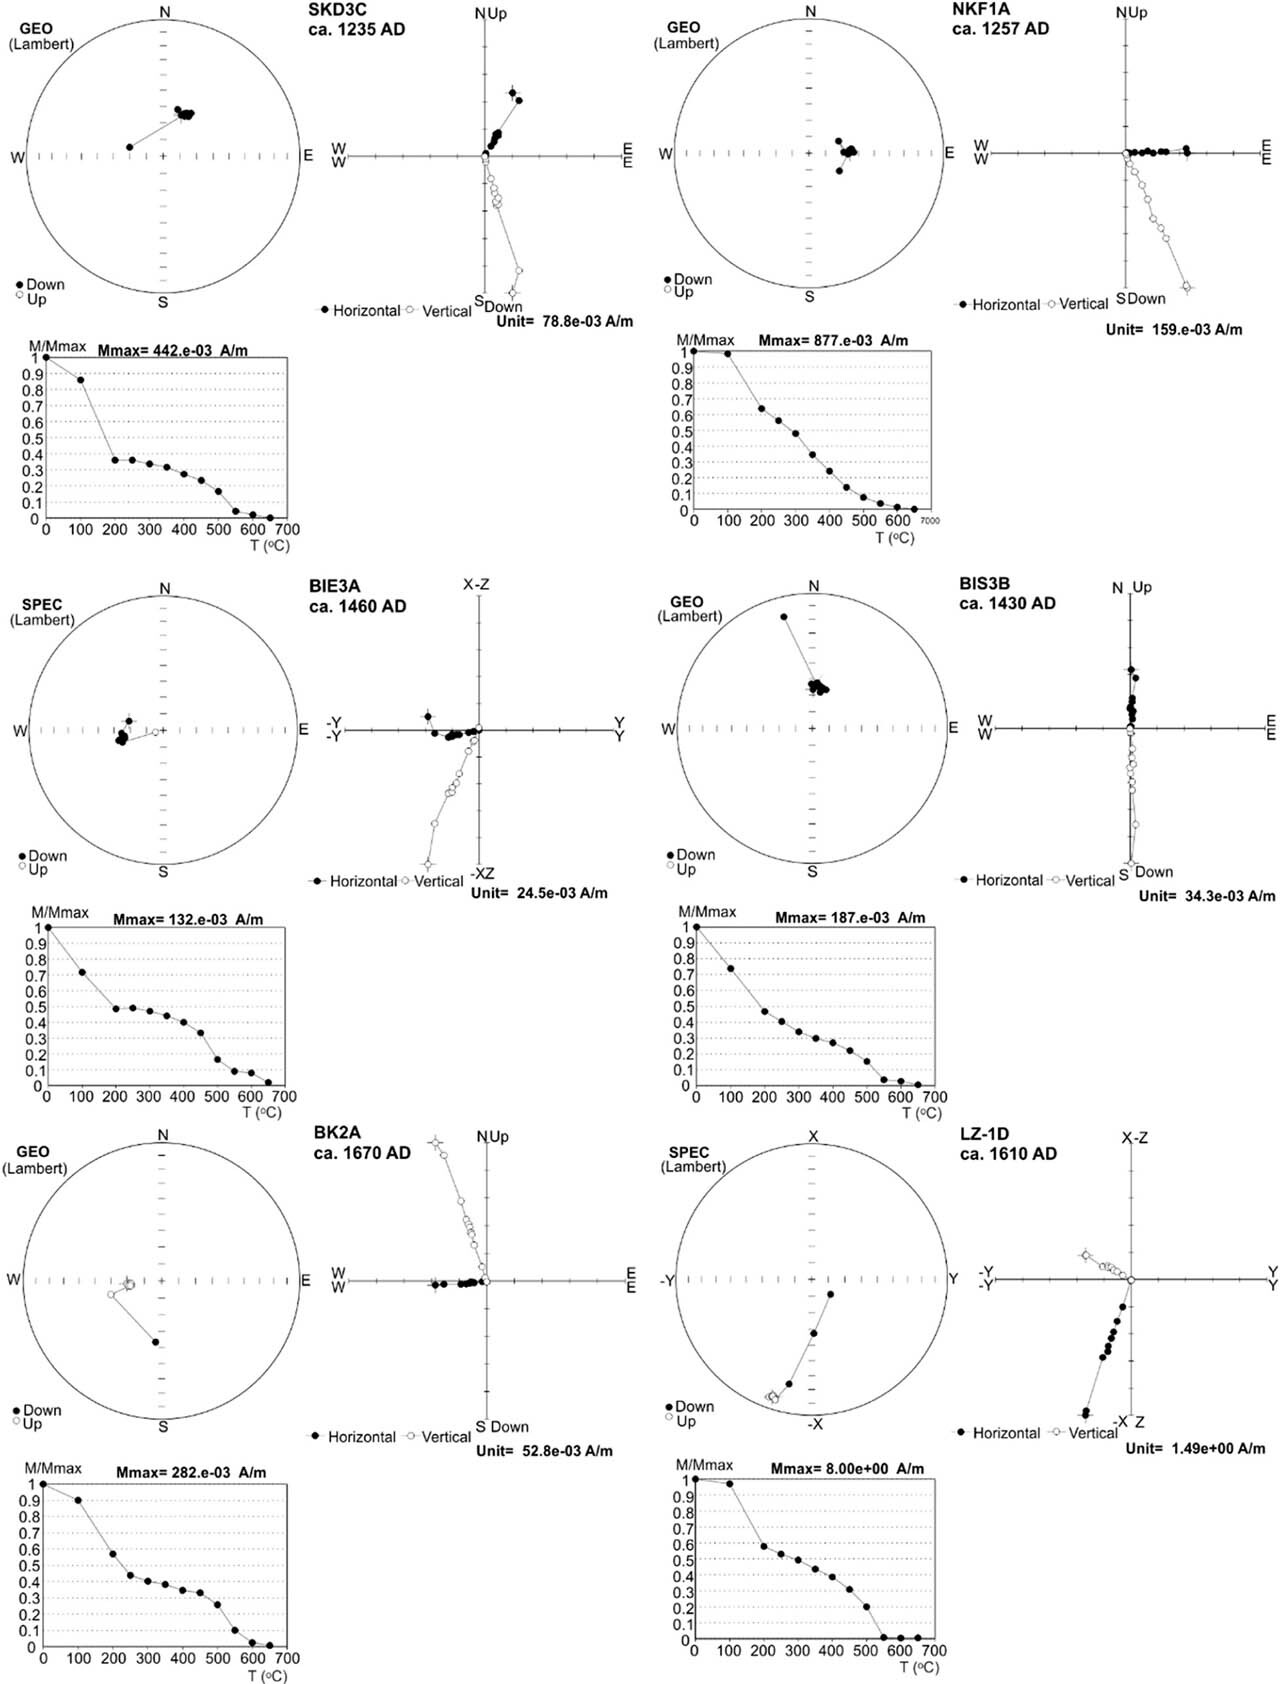
The initial intensity of RM of most of the studied brick specimens varies between 0.9 and 0.1 A/m. Single specimen displayed higher intensities of RM, i.e. up to 8.3 A/m. The structure of RM is very simple in all specimens. Only a part of them revealed the presence of low-stable component of magnetization, probably of viscous origin. It was removed at temperatures not higher than 200 °C when 40 to 60% of initial intensity of the RM was demagnetized (Fig. 4). After elimination of this component, the characteristic magnetization with inclination enclosed between 50 and 80° was defined. In most of the specimens, it was demagnetized completely at temperature of about 550 °C. In part of them, however, this component carried on by a very small portion (1 – 8%) of the initial RM remained after demagnetization at 550° C. It was fully demagnetized at temperatures between 600 and 650 °C. Part of the studied specimens displayed negative values of inclinations (Fig. 4, specimen BK2A). They were drilled on the bottom surface of the bricks with respect to their primary orientation in the oven of brick factory. The angular standard deviation error calculated during determination of inclination by line-fit method was less than 3° in c.a. 90% of specimens. In the remaining 10% of them, it was enclosed between 3 and 7°. The mean values of characteristic inclination for particular localities calculated at the brick or core (in the case of one brick from a locality) levels were determined with the errors enclosed between 0.5 and 9.8° (Table 1). In total, the characteristic inclinations were defined for 237 specimens representing fragments of 67 bricks from 26 historical buildings in SE Poland.
Fig 4
Results of thermal demagnetization of representative brick samples from SE Poland (demagnetization paths, intensity decay curves and orthogonal plots). SKD3C – Sandomierz, Dominican monastery; NKF1A – Nowy Korczyn, Franciscan monastery; BIE3A – Biecz, church Corpus Christi; BIS3B – Biecz, defensive wall; BK2A – Brzozów, church; LZ-1D – Leżajsk, basilica.
. Discussion
. Inclination curve for SE Poland
The mean inclinations were recalculated to the coordinates of the city of Rzeszów (50.04 N and 22.00 E) and used for the construction of the regional “Rzeszów” curve of secular variation. Two versions of this graph with 95% confidence band are presented in Fig. 5. One of them was constructed without three inclinations defined for three buildings dated at ca. 1510, 1520, and 1560 AD (Table 1). This is because of their rapid lowering at that time and inferred from this fact possible uncertainty of the origin of the bricks. The mean inclinations obtained from them are comparable with each other but significantly lower than these noted in the bricks from slightly older and newer buildings. Maybe the bricks used for the construction of these buildings were derived from any older objects like defensive walls. Low values of the AMS factor do not speak for a significant influence of magnetic anisotropy on the inclinations obtained from the bricks.
Fig 5
Two inclination curves at the Rzeszów reference site presented with grey belt of 95% confidence of polynomial of 8th degree fitting. The lower curve was calculated without data obtained from sites 10, 11, and 12 (see text and Table 1). The age and inclination errors for the data from each archeomagnetic site are presented by bars.
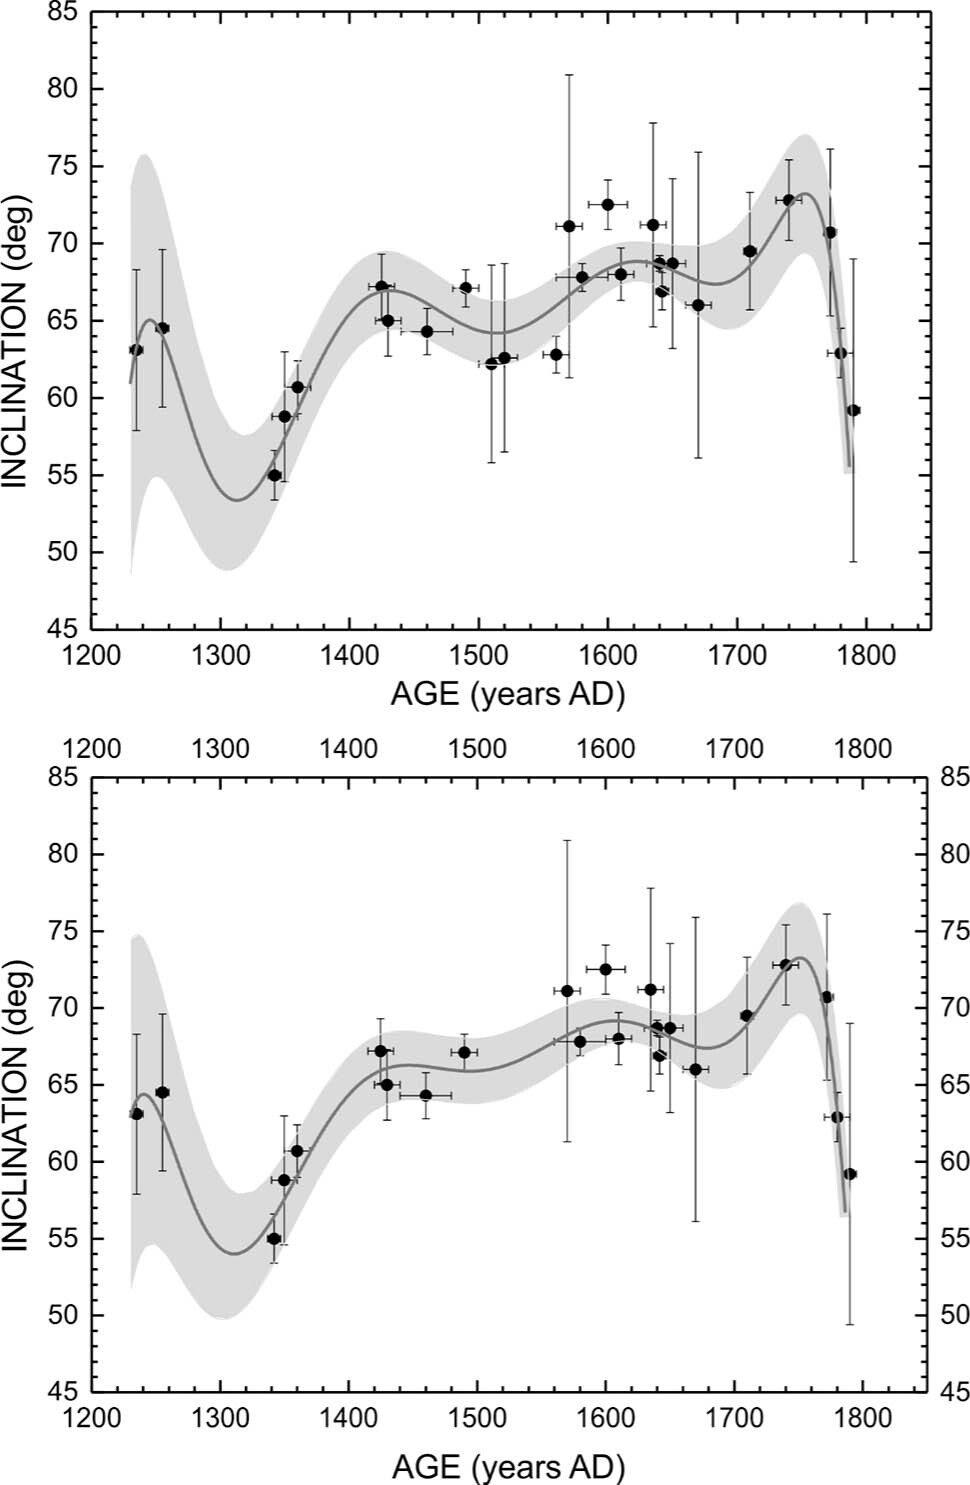
Specimens from a single brick only gave five mean inclinations used for the construction of our regional curve. It should be noticed, however, that three of them calculated for the bricks from the 14th century (dated at ca. 1342, 1350, and 1360 AD) have similar values with respect to this parameter (Table 1). Two others do not differ from inclinations determined for buildings of nearly the same age of construction but derived from more than one brick.
The amplitude of inclination change in the regional curve for SE Poland is ca. 18°. The lowest values of this parameter were obtained from the bricks dated at the 14th century and the end of the 18th century. The highest inclinations were isolated from the bricks as old as the 17th and 18th centuries. Apart from the end of the 18th century, a rapid change of inclination can be observed at the turn of the 14th and the 15th centuries when it was raised to about 10°.
. Comparison with existing data
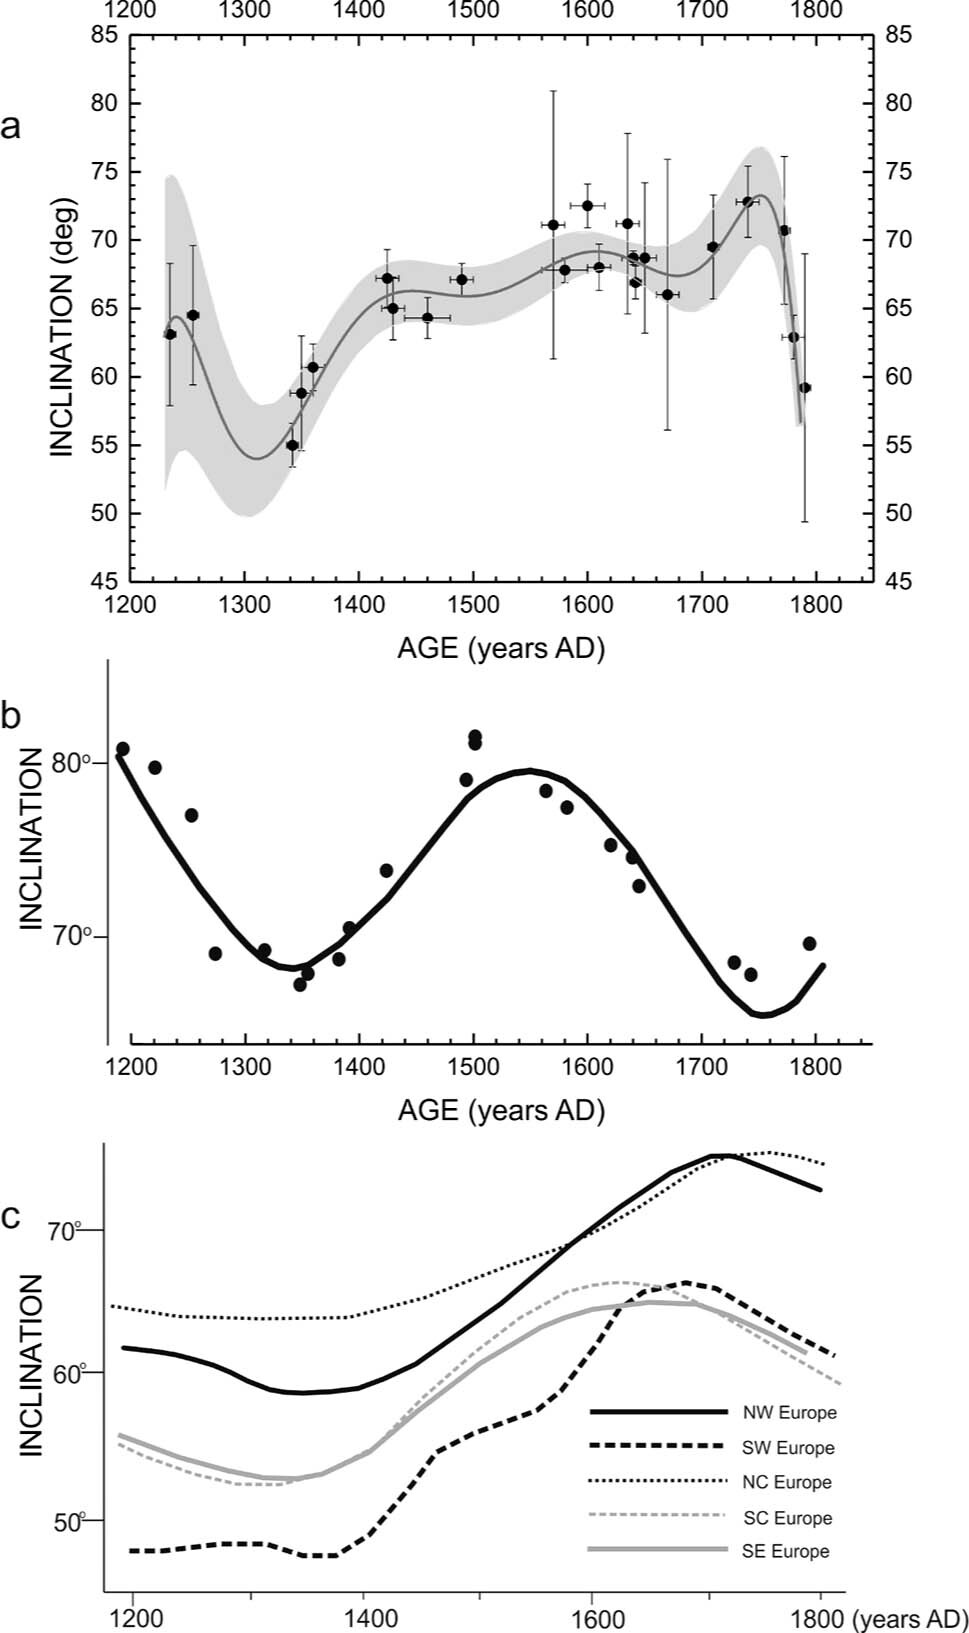
The regional inclination curves calculated for Rzeszów and Gdańsk (Czyszek and Czyszek, 1987) have the same course in the 13th, 14th, and 15th centuries. and after the period when this parameter is decreased, its stepwise increase can be observed (Fig. 6a and b). However, in their segments dated at the 17th and 18th centuries, these curves are different, even opposite. It is not easy to explain the extremely low geomagnetic field inclination in Gdańsk obtained from two objects dated at the first half of the 18th century because this phenomenon is not observed in the Rzeszów curve and in any existing regional curves from other parts of Europe (Fig. 6c; Schnepp, 2008; Pavón-Carrasco et al., 2009). The same characteristic inclinations for the 14th century and the first half of the 18th century in Gdańsk could be explained by the reuse of medieval bricks during the construction of these objects or by secondary heating of original bricks during unrecognized fire in the 19th century, when inclination was relatively low.
Fig 6
The regional curves of secular variations of inclination between 1200 and 1800 AD for Rzeszów (a), Gdańsk (b), after Czyszek and Czyszek (1987), and for five other regions of Europe (c), after Schneep (2008) and Pavón-Carrasco et al. (2009).
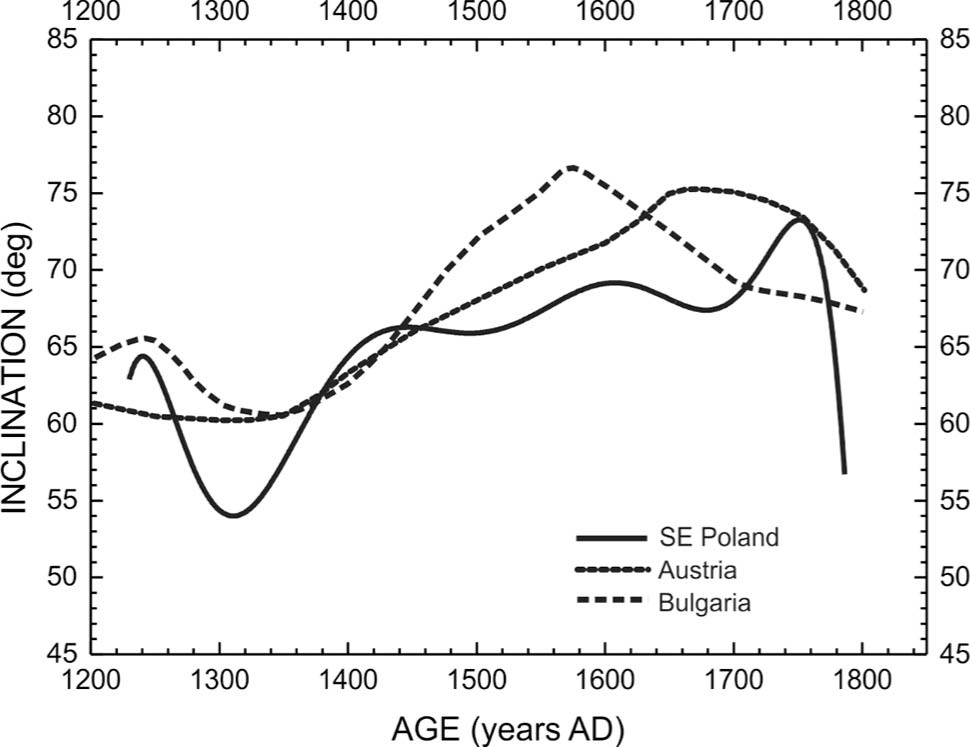
What are the dissimilarities between graphs with the changes of characteristic inclination between the 13th and 18th centuries defined for other regions of Europe (op. cit.) and for SE Poland? First of all, the amplitudes of secular variations of inclination in the curves defined for Central and Southern Europe are smaller, not exceeding 14°. It should be stressed, however, that the amplitudes of characteristic inclination changes for the curves prepared for the western parts of Europe are higher, similar to that of SE Poland. Another difference between our inclination graph and the graphs determined for all other regions of Europe is the ratio of decrease of inclination noted in the 18th century. According to the data from SE Poland, this parameter dramatically decreases from ca. 70 to 60° between 1780 and 1800 AD. This drop is two times smaller in the case of compared curves from other regions of Europe, where it started earlier, i.e. ca. 1700–1750 AD and in the case of the country curves defined for Bulgaria (Kovacheva et al., 2014) and Austria (Schneep et al., 2015) even ca. 1580–1660 AD (Fig. 7). More objects from SE Poland should be studied to confirm these specific features of our regional curve and to fill some intervals without sufficient amount of data. These gaps occur especially around 1300, 1400, 1520, and 1700 AD.
Fig 7
The regional curves of secular variations of inclination between 1200 and 1800 AD for SE Poland (this study), Austria (Schneep et al., 2015), and Bulgaria (Kovacheva et al., 2014).
. Conclusions
Our main conclusions are as follows:
1) The record of secular variations of archeomagnetic inclination in SE Poland between 1200 and 1800 AD, based on the studies of bricks from historical buildings, is generally similar to that obtained outside Poland and in other parts of Europe. The only remarkable difference is a more rapid and deeper drop of inclination noted in SE Poland at the end of the 18th century.
2) The regional inclination curves calculated for SE Poland (Rzeszów) and N Poland (Gdańsk) are similar in their parts dated at the 13th, 14th, and 15th centuries. They are completely different in their segments as old as the first half of the 18th century, where a deep minimum of inclination was defined in the bricks from N Poland. This fact could be explained by the reuse of medieval bricks during the construction of two objects from N Poland dated at the first half of the 18th century and applied for the construction of reference curve or by later secondary heating of original bricks.
3) More brick objects have to be studied to confirm some specific features of our regional curve of secular variations of inclination between 1200 and 1800 AD. Four data gaps should be filled by further studies of bricks dated at ca. 1300, 1400, 1520, and 1700 AD.