
. INTRODUCTION
Based on the radiocarbon dating (14C) method, it had been announced that lakes with highstand widespread in northwestern China, even in desert area during Marine Isotope Stage 3 (MIS 3) period (Chen and Bowler, 1986; Zhang et al., 2004). In the last decades, when the optical dating (OSL) method was widely applied, a serious of studies questioned the previous dating results (Long and Shen, 2015; Yu et al., 2019). For the lacustrine deposits from several deserts suggesting the high lake level appeared mainly in MIS 3 by 14C dating (Zhang et al., 2006; Wünnemann and Hartmann, 2002; Zhu et al., 2004), the OSL dating of quartz suggested the deposit ages beyond the 70 ka (Madsen et al., 2008; Long et al., 2012; Li et al., 2008). For the more, when the high temperature infrared stimulated luminescence (pIR IRSL) dating of K-feldspar was developed, studies believed that high lake level should be existed before 100 ka in north China (Long et al., 2015; Li et al., 2015) For example, the 14C age of Tengger Desert lacustrine deposit sequences indicated the lake existed during 35–30 ka (Pachur et al., 1995; Zhang et al., 2004) but the OSL age is about 100–70 ka (Long et al., 2012); same debates can also be draw in the Qinghai Lake (Madsen et al., 2008; Liu et al., 2010) and Ejina Basin (Wünnemann et al., 1998; Wünnemann and Hartmann, 2002; Li et al., 2015). However, another study believed that high lake level existed during both of MIS3 and MIS5 by using OSL dating method to shorelines of paleo-lakes from north Chine (Fan et al., 2010; Liu et al., 2010). So there still have controversies for the lakes evolution times in the late Pleistocene. The inconsistent high lake level period caused by the different dating methods is remain the question and need further study. It is important to identify the paleo-lakes evolution period for reconstructing the climate changes in the arid/semiarid regions of north china in the late Pleistocene.
The Badain Jaran desert (BJD) is located on the northwestern Alashan Plateau of Inner Mongolia, north China. It is well known by its unique landscape that over 100 modern deserts lakes combined with hundreds huge megadunes. There are also lots of lacustrine deposits relics distributed widely in BJD, some of them just beside the modern lakes. This indicates the existence of the paleo-lakes and the past environmental changes in the desert. The ages of these lacustrine sediments could give the clue of the evolution of these paleo-lakes and also the environmental/climate changes of BJD. The organic lacustrine sediments from some modern lakes were dated by using radiocarbon (14C) dating and indicated that the lakes appeared during MIS3 and the Holocene (Yang et al., 2003; Hofmann, 1996). Optically stimulated luminescence (OSL) ages obtained using quartz fraction from some of lake sediments showed that high stand lakes also occurred during MIS5 (Bai et al., 2011; Fan et al., 2014). The thermoluminescence (TL) dating in an early study of lacustrine sediment from north margin of BJD shows that there are lakes may exist during 190–100 ka (Mischke, 2005). Wang et al. (2015) obtained a 310 m drilling core of the sediments in the lower land of a megadune, the OSL dating results of two layers of lacustrine sediments indicated extensive lakes existed in BJD during MIS5 and Holocene. However, most of the lacustrine relics in BJD are still limited studied.
For the lacustrine relics in BJD, 14C dating could only obtain the deposit age younger than 40 ka; the unbleachable signals may result the overestimation age by using TL dating. OSL dating is applied widely since it was proposed (Huntley et al., 1985), especially after the development of the single-aliquot regenerative-dose (SAR) procedure (Murray and Wintle, 2000; Galbraith et al., 1999; Roberts et al., 1999). Over the last decade, quartz is the main mineral used for OSL dating of sediments. A serious study shown that the single aliquot regeneration (SAR) protocol applied to quartz grains has good performance and can give highly precise and accurate results (Wintle and Murray, 2006). However, due to OSL signals from quartz has relative low saturate doses of about 200 to 400 Gy, it only can be used for dating sediments younger than about 100 thousand years (Li et al., 2014). For the loess samples with age about 130 ka from Chinese Loess Plateau, OSL dating using quartz grains can yield 30–50% underestimation even no natural OSL signal saturation was observed (Qin and Zhou, 2007). Compared to quartz, potassium-rich feldspars (K-feldspar) can also be used for optical dating and it has several advantages. Firstly, as the IRSL signal from K-feldspar have relatively high saturation dose (over 1000 Gy) it can be used for dating old deposit events. Secondly, the relatively brighter IRSL signal from K-feldspar grains can lead to higher luminescence measuring precision (Li et al., 2007). Thirdly, the internal dose rate of K-feldspars (Zhao and Li, 2005) grains can reduce the effective of the changes of the external environment dose rate during deposit and improving age estimation accuracy (Li et al., 2008). Although IRSL dating using K-feldspar has numerous advantages, its application was hampered by the anomalous fading of the IRSL signal which is lead to underestimation of dating results (Huntley and Lamothe, 2001; Huntley and Lian, 2006). For overcoming the anomalous fading of IRSL signals, a lot of efforts have been made over the last decade. Huntley and Lamothe (2001) and Auclair et al. (2003) proposed a method to correct anomalous fading by measuring the fading rate (g-value) but it only can be used for relatively young samples, the great errors will be introduced and the calibrated results would unreliable for the older samples. Thomsen et al. (2008) found that IRSL signal stimulated at elevated temperature could significantly reduce the apparent fading rate. Based on this, post-IR IRSL dating method has been developed (Thomsen et al., 2008). In this dating method, IRSL signals were obtained at different two stimulate temperatures such as 50°C and 225°C (Thomsen et al., 2008) or 50°C with 290°C combination (Buylaert et al., 2009; Thiel et al., 2011). Although the fading rate decreased significantly using elevated temperature post-IR IRSL signals, the anomalous fading rate is still present (Buylaert et al., 2009). To obtain the negligible anomalous fading IRSL signal, multi-step post-IR (MET-pIRIR) dating method was proposed (Li and Li, 2011), a serials IRSL signals could be obtained under a serials stimulated temperatures (etc. 50, 100, 150, 200, 250°C), the signals obtained at 200°C and 250°C shows stable character and negligible fading rate present (Li and Li, 2011; 2012).
In this study, the OSL dating for quartz grain, two-step pIRIR50,290 and MET-pIRIR protocols for K-feldspar grains were employed to get the reliable optical dating ages of one lacustrine sediments section which located in the southeastern part of BJD. Based on the chronology and grain size analysis, the understanding of the paleo-lake evolution history and the related the paleoclimate condition in BJD will be discussed.
. STUDY POINT
Badain Jaran Desert
The Badain Jaran desert (BJD) is located on the northwestern Alashan Plateau of Inner Mongolia, north China (Fig. 1), covering about 5×10⁴ km2 (Zhu et al. 2010). The desert is surrounded by the Beida Mountains to the southeast, the Yabulai to the east, the alluvial fan formed by the Heihe River to the northwest, and Guaizihu Wetland to the north (Dong et al., 2004). There is not any surface runoff in the desert. About 100 lakes of various sizes (from hundreds square meters to ~1 km2) and salinities (0.01–345.0 g/L) are distributed across the lowland of megadunes in the southeastern part of the desert (Zhu et al., 1980; Dong et al., 2013). Climatically the area is an extremely arid continental type and located in the marginal area of East Asian Summer Monsoon (Gao et al., 2006). In winter, the desert frequently undergoes the affected by cold and dry continental air masses originating from mid-Siberia and Mongolia, while in the summertime the desert under influence of the East Asian monsoon which responsible for the most rainfall in desert. The annual mean temperature of BJD is 7.7°C in its southeastern edge, the mean annual precipitation decrease from 118 mm in the southeastern to 37 mm in the northwestern and most of precipitation concentrated in July and August (Yang et al., 2003). Contrast the low precipitation, the potential evaporation in BDJ is more than 1000 mm on the lake surface (Yang et al., 2010). The northwest wind and west wind are prevailed with an annual velocity from 2.8 m/s to 4.6 m/s and the strongest wind occurred in April and May (Dong et al., 2013).
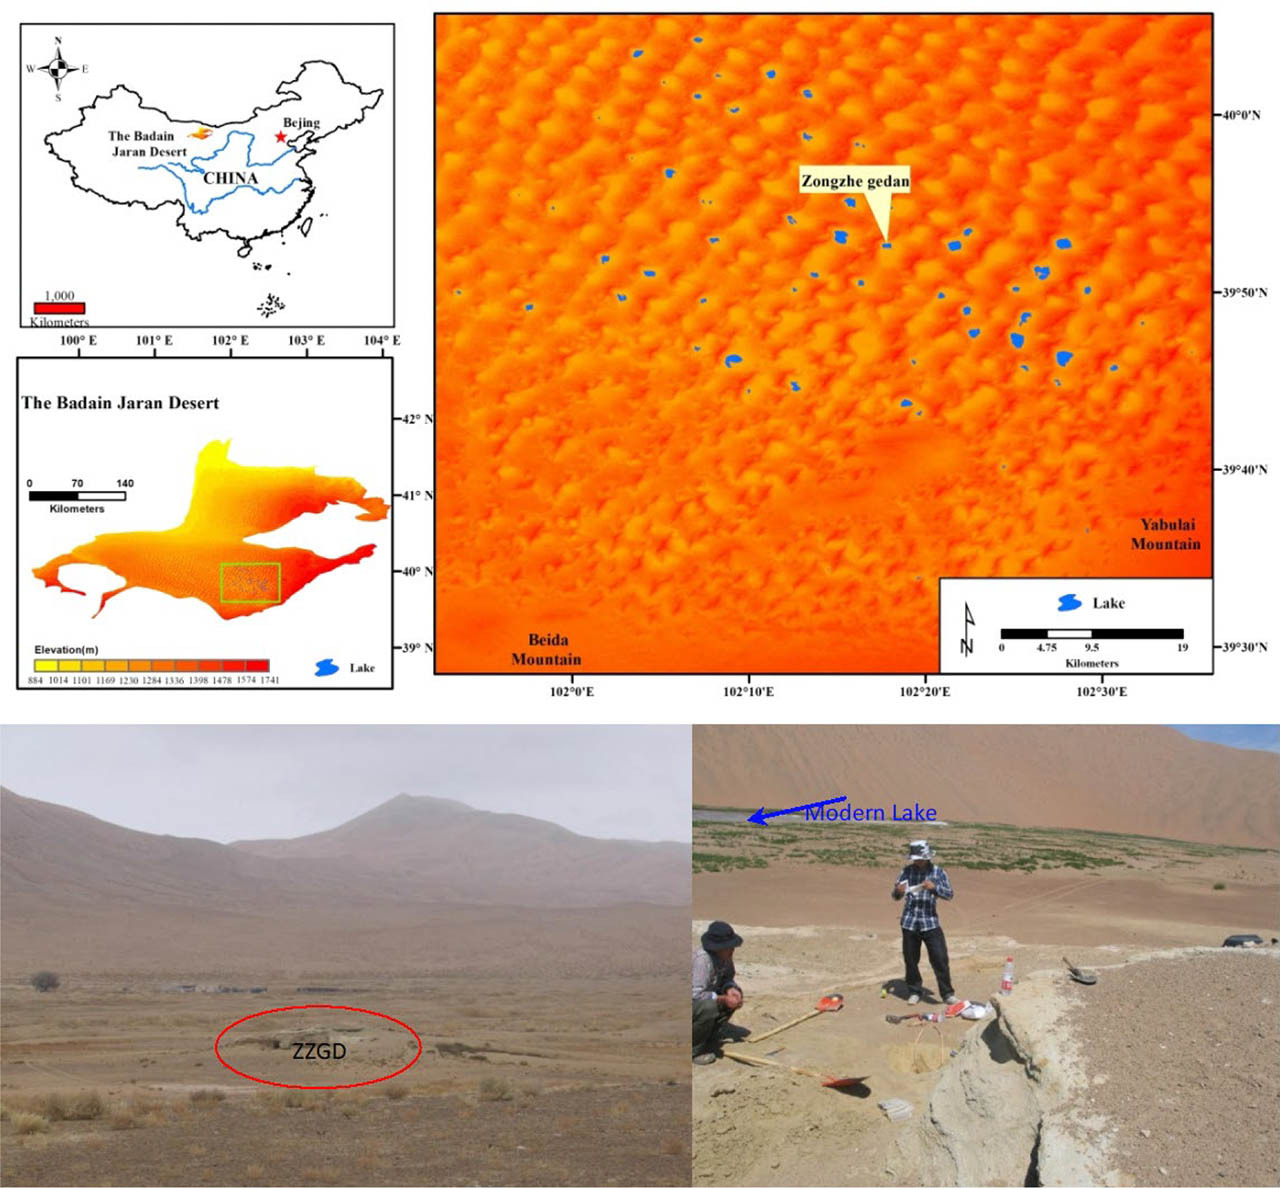
The Zongzegedan (ZZGD) section and samples collection
The Zongzegedan (ZZGD) section (N 39°51’57”; E 102°17’55”) is located about 1 km to one modern Lake Zongzegedan (Fig. 1), which is also in the lower land of megadune in the southeast of BJD. The section is composed by 3.9 m thickness lacustrine/aeolian sand deposits sequences, the top of the section is higher than the modern lake level about 7 m. Three layers were roughly divided by field observation from top to bottom as follows and Fig. 2:
1) 0~240 cm, gray and greenish cemented fine sand layer. At depth of 25 and 150 cm, about 2 mm diameter snail shells distributed in about 10 and 25 cm thick deposits layers, indicated shallow lake environment.
2) 240~360 cm, Greenish gray fine sand with horizontal layer, freezing thaw layer could be found at the depth of 170–200 cm, indicated the lake environment.
3) 360–390 cm, yellow and brown medium-fine sand layer, it is typical aeolian sand. This layer was not reached to its bottom.
Fig. 2
The ZZGD section and the typical deposits in the section. The red dots indicated the optical dating sampling points.
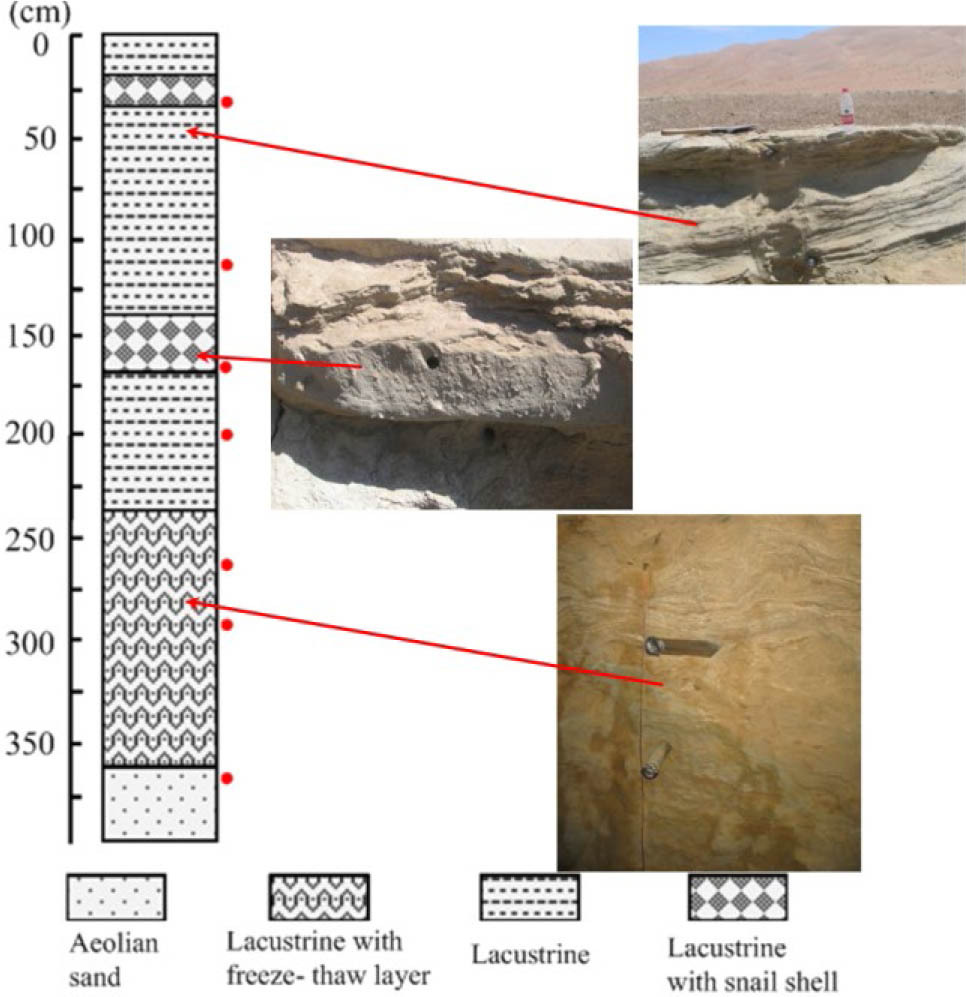
Seven OSL dating samples were collected from the ZZGD section at the depth of 0.45 m, 1.20 m, 1.65 m, 1.95 m, 2.90 m, 3.00 m and 3.65 m respectively (Fig. 2, red dots). All samples were collected by hammering 4 cm diameter stainless steel tubes into cleaned vertical profiles. Then pull out the tube and quickly covered with lid and sealed inside black plastic bags with tape to ensure the sample kept out of light and retained its original water content.
Raw samples were also collected at about 3 cm interval throughout the section for grain size analyze.
. SAMPLING PROCESS AND MEASUREMENTS
Optical dating
The quartz and K-feldspar grains were separated from raw samples in the laboratory for optical dating. All processes were carried out under subdued red light condition, the 3–4 cm material from each end of tube scraped away considering it may have been exposed to light and used for water content and radioactive element measurements. Sample preparation followed the methods described by Aitken (1998). Raw samples were first treated with 10% HCl and 20% H2O2 to remove carbonate and organic matters. The specific grain sizes of 90–125 μm were extracted by sieving the sample in water, and then the series densities of 2.62, 2.73 and 2.58 g/cm3 heavy liquids were used to separate the quartz and K-feldspar fractions. After drying, the quartz grains were etched with 40% HF for 40 min to remove the outer layer irradiated by alpha particles and any remaining feldspar grains. The K-feldspar grains were etched with 10% HF for 20 min to remove the outer layer. Finally all samples were treated with 1 mol/L HCl for 10 min to remove fluorides created during the HF etching.
The quartz and feldspar grains were mounted on the center of 9.7 mm diameter aluminum discs using silicone oil for equivalent dose (De) determination. All the luminescence signals measurements were carried out in the Luminescence laboratory of the Cold and Arid Environment and Engineering Research Institute, CAS, using an automated Risø TL/OSL-DA-15 reader (Markey et al., 1997). The quartz OSL signal was detected through two 3 mm thick Hoya U-340 filters and the IRSL signal was detected through one BG-39 and one Coring-759 filters using a photomultiplier tube. Laboratory irradiation was carried out using 90Sr/90Y sources built into the reader, with dose rates of 0.080 Gy/s.
To confirm the equivalent dose (De) in the age calculation, both of the OSL dating for quartz and IRSL dating for K-feldspar grains were applied. The single-aliquot regenerative-dose (SAR) protocols (Murray and Wintle, 2000; Wintle and Murray, 2006) has been applied to quartz grains to determine their De values. The preheat temperature in the SAR measurements process was determined to one typical sample (ZZGD-365) by using the test of preheat plateau. Preheat temperature from 200°C to 280°C with an interval of 20°C were applied, the cut-heat was kept at 220°C, both preheat and cut-heat using the heating rate of 5°C/s. For each temperature point, three aliquots were measured and its average value was calculated. The results showed that a plateau could be observed for temperature from 220°C to 260°C (Fig. S1). At the temperature of 240°C, the sample equivalent dose showed relatively lower inter-aliquot scatter and smallest recuperation of about 0.6%, thus we selected a preheat temperature of 240°C for routine De determination.
The validity of modified SAR procedure with the pre-heat of 240°C for De determination was further checked with a dose recovery test (Murray and Wintle, 2003). This test was applied to 6 aliquots of sample ZZGD-290 that had been bleached under the sunlight for 6 days. A laboratory dose of 160 Gy was given to each of the bleached aliquot as an unknown dose. Same SAR procedure was applied to the 6 aliquots and the measured De was 160.7 ± 0.70 Gy. The ratio of the given dose to the measured dose was 0.96 ± 0.04, indicated that the modified SAR procedures is able to recover a given laboratory dose, the modified SAR protocol used in this study is suitable for De determination.
The two-step post-IR IRSL (pIRIR50,290) (Thomsen et al., 2008) and the new multiple elevated temperature (MET) post-IRIR methods (Li and Li, 2011; 2012) were employed to K-feldspar grains, which could overcome the age underestimation from IRSL signals anomalous fading. Preheating of 320°C for 60 s was used in the origin of MET-pIRIR in this study. All protocols used in this study were summarized in the Table 1. Sensitivity changes corrected by the fixed test doses signals, the ratio of regeneration dose signals to test dose signals was used to construct sensitivity-corrected dose response curve and calculate the De value for all IRSL signals. For checking the bleaching situation of the IRSL signals from K-feldspar grains, at least 24 small aliquots (~1 mm diameter samples on one aliquot) of every samples was used in the measurements of the MET-pIRIR procedure. The De values could be drawn as function with the IR stimulation temperature. The De values increased with stimulation temperature, and a ‘plateau’ (shown as a dashed line in each plot of Fig. S2) is reached at higher temperatures (>200°C) for most of the samples, further confirming that a non-fading component is present at the elevated temperatures (Li and Li, 2011; 2012). We, therefore, calculated the final De values obtained from the signals measured at 250°C for all the K-feldspar samples.
Table 1
The OSL, pIRIR(50,290) and MET pIRIR dating protocols.
| Step | OSL protocol (Wintle and Murray, 2006) | pIRIR(50,290) protocol (Thiel et al., 2011) | MET-pIRIR protocol (Li et al., 2014) |
|---|---|---|---|
| 1 | Give regenerative dose, Dia | Give regenerative dose, Dia | Give regenerative dose, Dia |
| 2 | Preheat at 240°C for 10 s | Preheat at 320°C for 60 s | Preheat at 320°C for 60 s |
| 3 | OSL, 80 s at 125°C | IRSL, 200 s at 50°C | IRSL, 200 s at 50°C |
| 4 | Give test dose, Dt | IRIR, 200 s at 290°C | IRIR, 200 s at 100°C |
| 5 | Preheat at 220°C for 0 s | Give test dose, Dt | IRIR, 200 s at 150°C |
| 6 | OSL, 80 s at 125°C | Preheat at 320°C for 60 s | IRIR, 200 s at 200°C |
| 7 | OSL, 40 s bleaching at 280°C | IRSL, 200 s at 50°C | IRIR, 200 s at 250°C |
| 8 | Return to step 1 | IRIR, 200 s at 290°C | IRIR, 200 s at 300°C |
| 9 | IRSL, 100 s bleaching at 325°C | Give test dose, Dt | |
| 10 | Return to step 1 | Preheat at 320°C for 60 s | |
| 11 | IRSL, 200 s at 50°C | ||
| 12 | IRIR, 200 s at 100°C | ||
| 13 | IRIR, 200 s at 150°C | ||
| 14 | IRIR, 200 s at 200°C | ||
| 15 | IRIR, 200 s at 250°C | ||
| 16 | IRIR, 200 s at 300°C | ||
| 17 | IRSL, 100 s bleaching at 325°C | ||
| 18 | Return to step 1 |
Concentration of radioactive element U, Th, K that used for calculate the environment dose rate was determined by means of Neutron Activation Analysis (NAA). All results were converted to alpha, beta and gamma dose rates according to the conversion factor of Aitken (1998). The cosmic ray dose rate was calculated by the transition function of the sample burial depth and altitude (Prescott and Hutton, 1994). 12.5 ± 0.5% K content was adopted to calculate the internal dose rate of K-feldspar grain (Huntley and Baril, 1997; Zhao and Li, 2005). The observed water content in laboratory was 0.5–1.5% for all the samples, and the saturated moisture content of the sediment is about 30%, considering the lacustrine sediment water content may be changed strongly from saturate (in the lake period) to dry (after the lake disappeared) the water content of 10 ± 10% with large uncertainty was adopted to calculate dose rate for all samples in this study.
Grain size analysis
The grain size analysis was conducted in the Key Laboratory of Western China’s Environment Systems (Ministry of Education), Lanzhou University. The detailed sample pretreatment process was followed the method of Lu and An (1998). 0.5 g sample was firstly weighted and poured it into a 100 ml glass beaker. Then 10 ml of 30% H2O2 and 10 ml of 10% HCl were successively added to remove organic and carbonate at 105°C. The beaker was then filled with distilled water and left to deposit for 24 h. 10 ml of 0.05 g/L (NaPO3)6 was added to the sample after siphoning off the redundant water and dispersed for about 10 min in an ultrasonic vibrator. The Malvern Mastersizer 2000 laser grain-size analyzer with a measurement range of 0.02–2000 μm was used in this study. The prepared sample was transferred to the laser grain-size analyzer, producing measurements as a volume percentage.
. RESULTS AND DISCUSSION
OSL and IRSL dating
All the dosimetry and dating results are show in Table 2. It could be found that the OSL dating using SAR procedure from quartz show that the lacustrine sediments in the ZZGD section were deposit during about 34–65 ka. However, the IRSL dating results from K-feldspar using pIR50IR290 and MET pIRIR procedures show that the deposit age of lacustrine layers are during about 60–84 ka. This contradiction of dating results needs to check carefully.
Table 2
The results of the OSL dating using quartz and IRSL dating using K-feldspar. In the results of the IRSL dating, the upper line is the results by using pIR50IR290, and the lower line is the results using the MET pIRIR procedure.
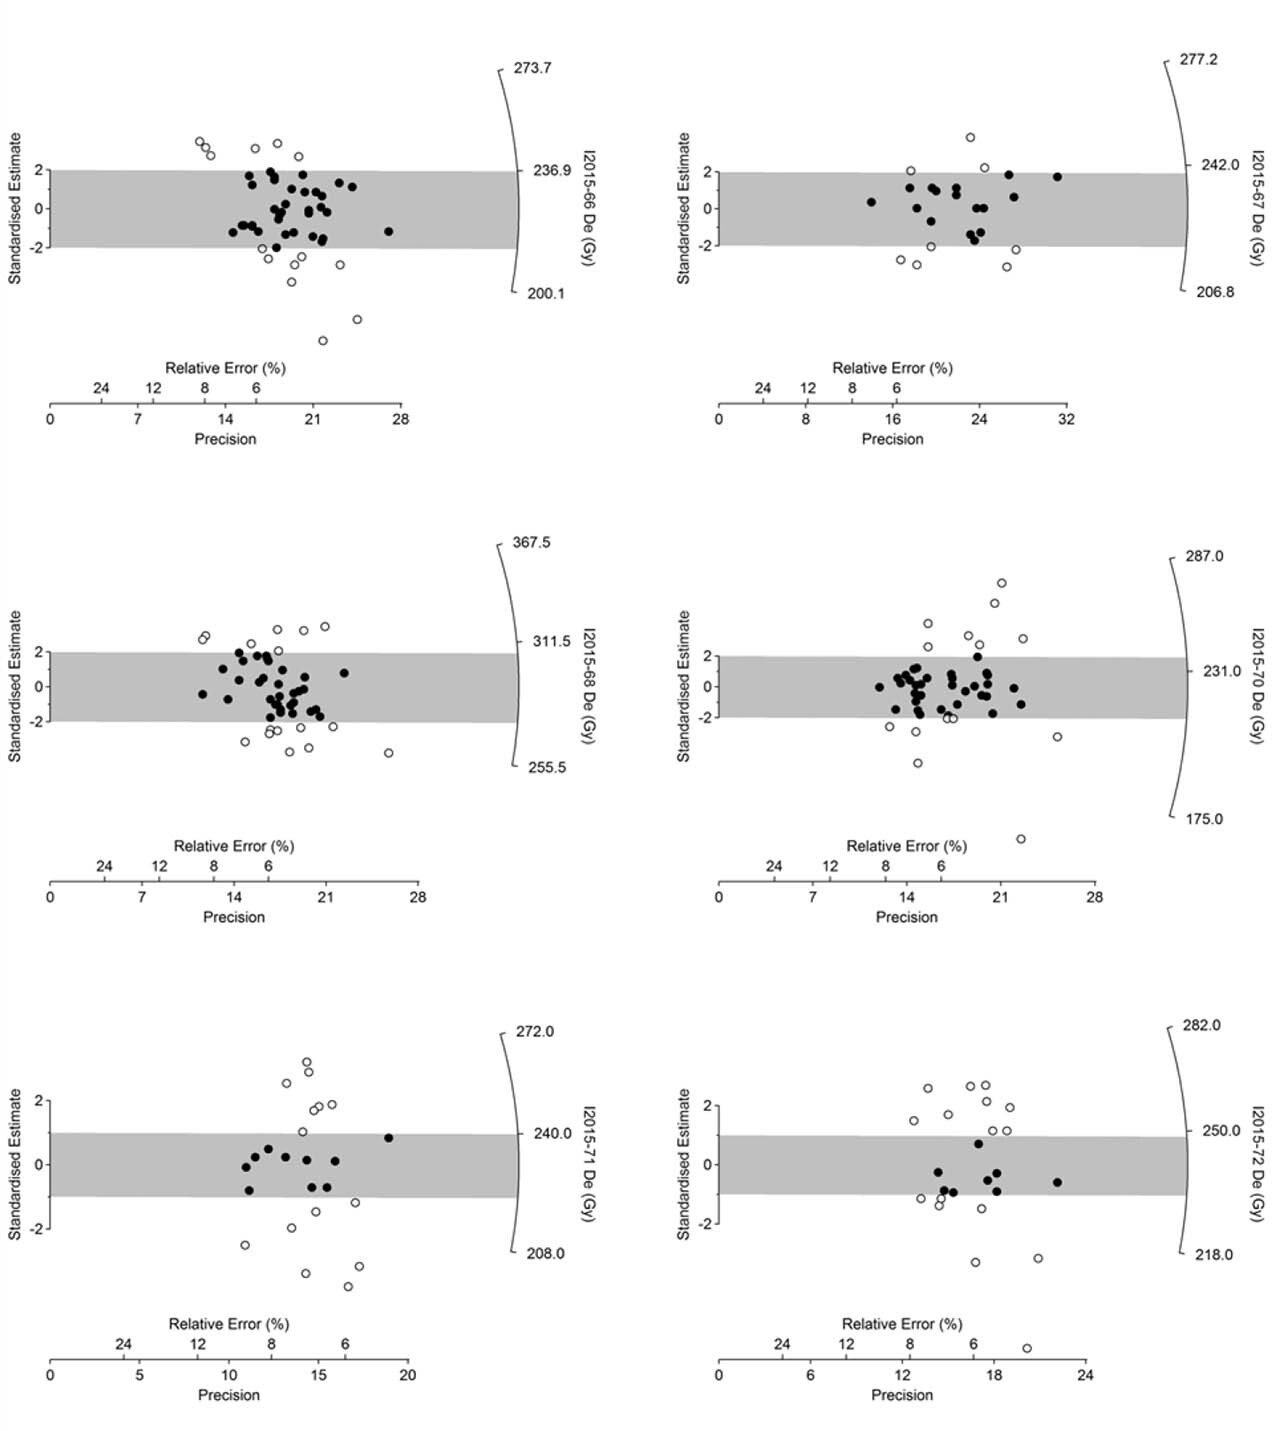
The poor bleaching of OSL or IRSL signals may lead age overestimation of deposit events. Normally, the bleaching of the IRSL signals from K-feldspar grains should be slower than the OSL signals from quartz grains when the two minerals from same sediments (Atiken, 1998). The De values of 250°C for 6 samples from lacustrine layer, which may experience poor bleaching, are displayed as radial plots in Fig. 3 respectively. All of the samples, with 24–48 aliquots, have De values distributed around a central value (Fig. 3). This indicated that well bleaching of all the samples. We determined the weighted mean De of the individual single-aliquot values using the Central Age Model (CAM) (Galbrith et al., 1999; Galbrith and Roberts, 2012). The unbleachable high temperature IRSL signals in pIRIR protocol may produce residual dose of De values and lead to overestimation of the deposit ages (Sohbati et al., 2012). In this study, four aliquots from sample ZZGD-45 were bleached under sunlight for 28 h and then measured using same protocol of MET-pIRIR in Table 1. The obtained residual dose is 2.31 ± 0.12 Gy, which is relatively small compare with the sample De values of >200 Gy. Nevertheless, it is still subtracted in K-feldspar age calculation.
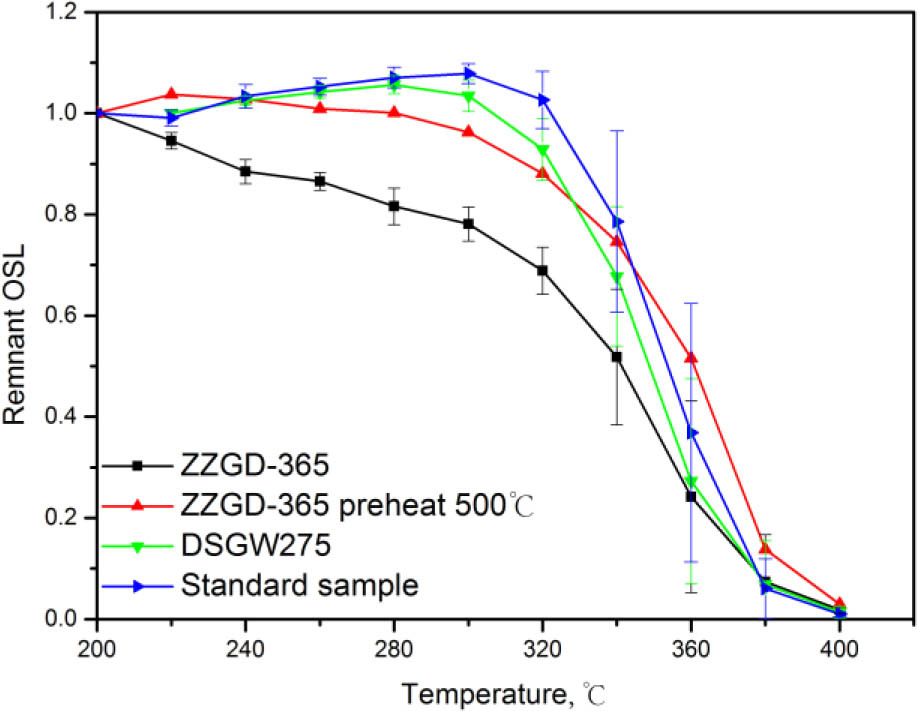
Thermal unstable OSL signal of fast components from quartz grains may lead to significant age underestimation (Steffen et al., 2009; Fan et al., 2011). Pulse-annealing experiments were carried out to the bleached (28 h under sunlight) three quartz aliquots from each of several samples: studied sample (ZZGD-365), sample ZZGD-365 but preheated 60 s at 500°C, the sample (DSGW275) that with thermal stable OSL signals (Zhao et al., 2016), and the standard quartz sample from Risø National Laboratory, Denmark, respectively. The detailed pulse-annealing experiment procedures are similar but modified from the SAR OSL protocol in Table 1. Each aliquot was given a regenerative dose of 32 Gy. The aliquot was then subject to a cut-heat temperature of T °C. And then the OSL signal was read 80 s at 125°C. Correction for sensitivity changes during the measurements was made using OSL created by a test dose of 8 Gy with a following cut-heat to 200°C. At the end of each run, the aliquot was bleached at 280°C to remove all potential signals. The measurement cycle was repeated with the cut-heat temperature T being increased from 200 to 400°C, in increments of 20°C. The OSL signal (in first channel ~0.5 sec) remaining after heating to each temperature was normalized to the initial value (at T=200°C), the average normalized remaining OSL signals from 3 aliquots of every samples were shown in Fig. 4. The normalized remaining OSL signals from ZZGD-365 showed an early decrease from relatively low temperature (240°C), but the aliquot endured a preheat 500°C showed much slower decrease after 320°C. The standard sample and sample DSGW 270 also showed obvious decrease after 320°C. This experiment indicated that the fast components natural OSL signals from quartz in BJD have thermal unstable and which may lead to significant age underestimation.
Fig. 4
Pulse-annealing curves for quartz aliquots from four samples. The remnant OSL signals are versus the annealing temperature.
The well bleached pIRIR signals from K-feldspar were used to establish the age framework of the ZZGD section.
MIS5 lacustrine deposits and implications
The dating results and the grain size analysis are shown in Fig. 5. It could be noticed that the pIR50IR290 and MET-pIRIR protocol yield consistence ages for most of the lacustrine deposits, except the bottom two samples older than 80 ka (Li et al., 2014). In this study, we used the MET-pIRIR results for discussion.
Fig. 5
The optical dating results of studied section ZZGD and the grain size analysis results. Over 80% of the sediments grains in the section are coarse grain larger than 63 μm as the bottom aeolian sand layer.
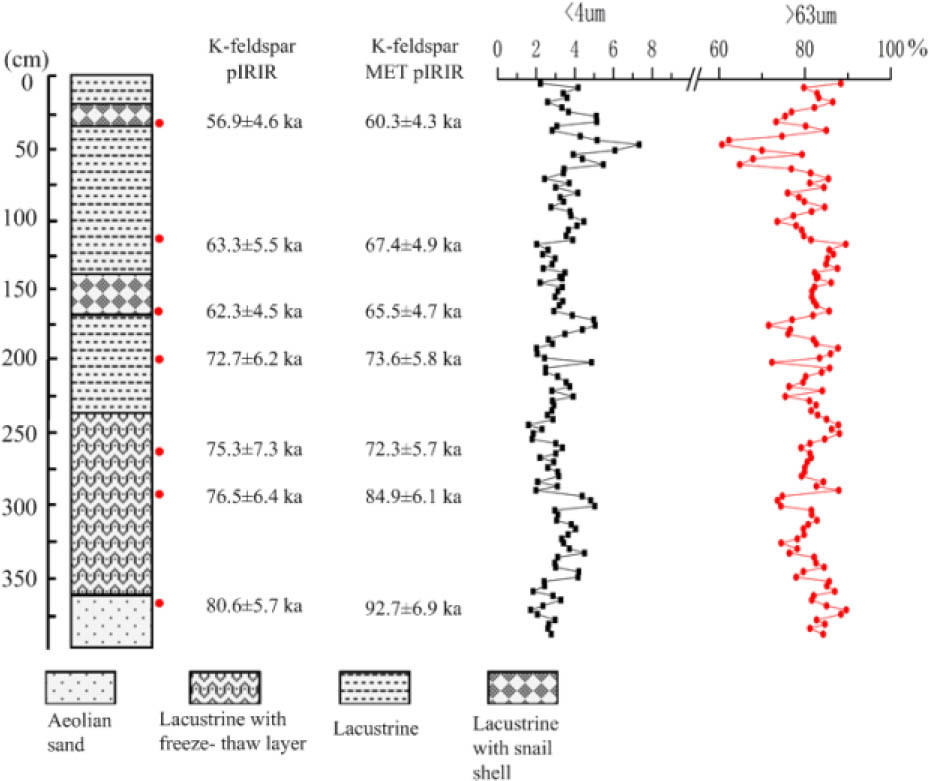
All the lacustrine layers were dated during about 85–60 ka, that means a lake existed in late MIS 5 till late MIS 4 (Martinson et al., 1987) and the bottom of the lake was higher than modern lake level about 7 m. The snail shells were appeared at about 65 ka and 60 ka indicated the shallow lake environments appeared at studied point during MIS4. The grain size analysis shows that the sediments from this section are uniform in both lacustrine and bottom aeolian sand layers. More than 80% sediments are coarse grains in most part of the section. This indicates that the sediments in the paleo-lake are mainly supplied by the surrounded aeolian dunes.
The IRSL dating results of the paleo-lake lacustrine relics beside the modern lake ZZGD in BJD indicate paleo-lake existing and also humid environment during 85–60 ka. This is similarity to the optical dating results for lacustrine deposit sequences indicated the lake existed during about 100–70 ka in the Tengger Desert (Long et al. 2012), Qinghai Lake (Liu et al., 2010) and Ejina Basin close to BJD (Li et al., 2015). Furthermore, the paleolake at late MIS5 appeared at a same position with the modern lake in BDJ have the geomorphological implications. The drilling core in the west of BDJ (Wang et al., 2015) showed that there was thick aeolian sand layer between the two MIS5 and Holocene lacustrine layers. That suggested the paleolake during MIS5 disappeared firstly, and then the aeolian sand layer indicated a long arid environment lasted in BDJ for about 60 ka. Till to the beginning of the Holocene, the modern lake was appeared at the same location with the paleolake during MIS5. There are two possibilities to explain this phenomenon, one is that the geomorphology in BJD were keep relatively stable that the wind field in the desert always eroded the same location of the desert, and form the lower sand land in the same position that could accumulate water to form lakes in humid periods. Another possibility is there were much larger/deep lakes in BJD in during MIS5 and these lakes distributed wildly in the desert. Section ZZGD is about 10 m higher than present lake level and other MIS5 lacustrine relics are also found beside modern lakes (Bai et al., 2011; Fan et al., 2014). These lakes left over lacustrine relics widely in the desert and some of them occasionally at same position with modern lakes. Further studies are still needed to explore the geomorphology process in BJD that the MIS5 lacustrine sediments could be found widely and beside the modern desert lakes.
. CONCLUSIONS
The thermal unstable of fast components of OSL signals from quartz grains may lead to the age underestimation of lacustrine relic sediments in BJD. However, MET pIRIRSL dating using K-feldspar could be well applied to the lacustrine relics in BJD and could build up reliable age frame work.
The studied lacustrine relics have deposit age about 65–80 ka, which belongs to late MIS5 period. That indicates a lake existed at that period and humid environment/climate condition in the desert at late MIS5. The paleolake had same position with modern lakes in the desert has geomorphological indications.
SUPPLEMENTARY MATERIAL
Supplementary material, containing additional figures is available online at http://dx.doi.org/10.2478/geochr-2020-0032.