
. INTRODUCTION
The Tibetan Plateau (TP), known as the “Water Tower of Asia” and “the Third Pole”, is highly relevant to Asian monsoon systems (East Asian monsoon and Indian monsoon), and global climate change due to its massive extension at high altitudes (Krause et al., 2010; Song et al., 2013). Instrumental data have recorded rapid warming during recent decades in this region, approximately three times faster than that of the global average (Zhang et al., 2017). Long-term records derived from paleoclimatic proxies are invaluable for improving our understanding of the natural range and causes of variability in regions compared with instrumental records. There are over 1000 lakes (larger than 1 km2) distributed across the TP (Wang and Dou, 1998; Ma et al., 2011). The storage of water in a closed lake basin reflects the balance between evaporation and water influx, referring to both runoff and direct precipitation (Benson and Paillet, 1989), and it has typically been used to infer the variation history in the regional effective moisture (e.g., Long et al., 2012; Zhang et al., 2016). Outcrops and landforms can provide direct evidence of sediment facies changes, and record details of lake-level fluctuations, geologic events such as catastrophic floods, drainage-basin changes and isostatic rebound (Reheis et al., 2014).
Several studies have been conducted to document the paleoenvironmental change on the TP by dating relict beach ridges and lacustrine sediments with optically stimulated luminescence (OSL), cosmogenic radionuclides and 14C methods (e.g., Kong et al., 2011; Long et al., 2012; Chen et al., 2013; Ahlborn et al., 2016; Alivernini et al., 2018). Particularly, the OSL method has increasingly been applied to lacustrine deposits, owing to readily available dating materials, i.e., quartz and feldspar. However, the problem of very dim natural and regenerative OSL signals from quartz samples has been reported in this region (Long et al., 2015); this makes it difficult to obtain reliable age solely using quartz (Long et al., 2015; Preusser et al., 2009). Moreover, anomalous fading rates of 2–4%/decade have been measured on beach sands from Tangra Yum Co on the southern Tibetan Plateau (Rades et al. 2015). Several reconstructions of the past lake levels in the catchment of Selin Co (Fig. 1a) based on OSL dating of the exposed paleoshorelines have yielded obviously inconsistent results. Li et al. (2009) and Xue et al. (2010) reported that the lake dropped at the periods of ∼12–9 ka, ∼7–6 ka and 2 ka, but Shi et al. (2017) claimed a highstand through the period between ∼8 and ∼4 ka. Those disagreements and uncertainties concerning the temporal patterns of past paleohydrological changes in this region could limit our understanding of the associated forcing mechanisms and the extent to which climate patterns could shift in response to future climate change (Hou et al., 2012).
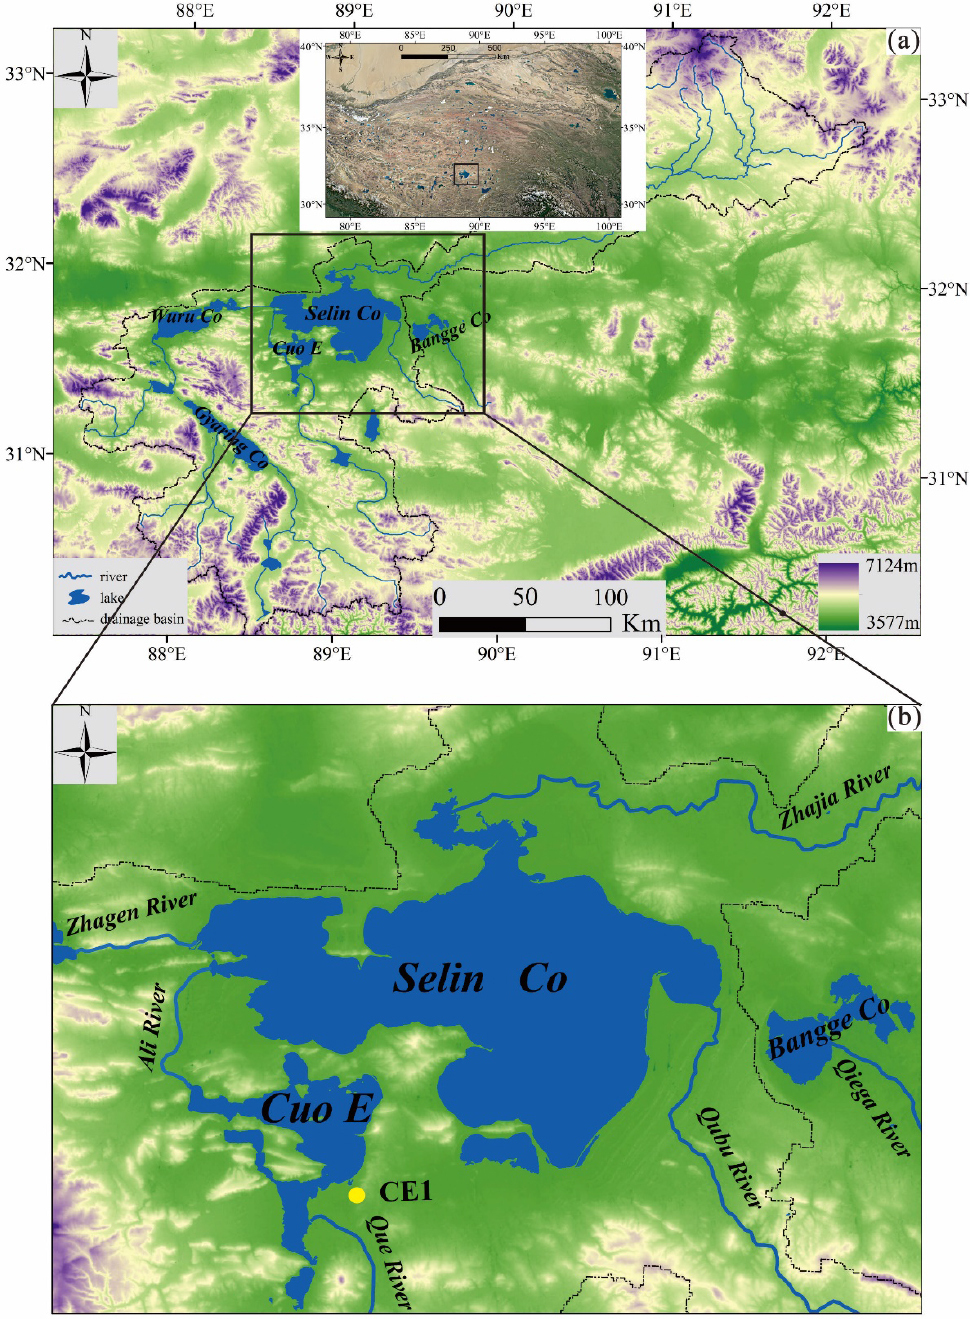
Fig. 1
(a) Map showing the distibution of major rivers flowing to Selin Co and Google Earth satellite image showing the locations of Selin Co and Cuoe lake (inset); (b) Location of CE1 profile. The base map in (a) and (b) were obtained from http://www.gscloud.cn/.
In this paper, we carried out a combined stratigraphic and chronological analysis on a lacustrine outcrop from Cuoe Lake on the central TP. Both luminescence and radiocarbon dating methods were used to reconstruct the evolution of the lake level during the Holocene.
. STUDY AREA AND RESEARCH MATERIAL
Selin Co Basin (Fig. 1a and inset) is located in the central part of the TP and contains several large lakes (e.g., Selin Co and Cuoe Lake); those lakes are presently connected through rivers. The largest lake in the basin is Selin Co (30° 7′–33° 17′ N, 87° 27′–92° 12′ E) (Fig. 1b), with the drainage area of ∼57,200 km2 and surface area of ∼2,320 km2. The elevation in the basin ranges from 4532 to 6406 m above sea level (Shi et al., 2017). There are four major subbasins (i.e., Zhajia River, Zhagen River, Ali River and Boqu River) with runoff inflows into the lake. The Zhajia River originating from the Tanggula Mountains has the largest drainage area of ∼16,130 km2, and the other three have areas of 16,073 km2 (Zhagen River), 6,859 km2 (Ali River) and 1,154 km2 (Boqu River), respectively (Tong et al., 2016). The annual average precipitation is approximately 315 mm and mainly occurs from May to September (Zhou et al., 2015). The climate of the basin is dry and cold, with a mean annual temperature of 0.7°C, relative humidity of 42%, and wind speed of 3.9 m/s from 1961–2009 (Zhang et al., 2011). The water level of Selin Co is dominantly regulated by the regional precipitation associated with the southwest Indian monsoon (Shi et al., 2017). Cuoe Lake and Selin Co have once existed as a large uniform lake with high-stand status (Zhu et al., 2004). The studied profile (CE1, Fig. 1b) was exposed due to the incision of a stream flowing into this lake.
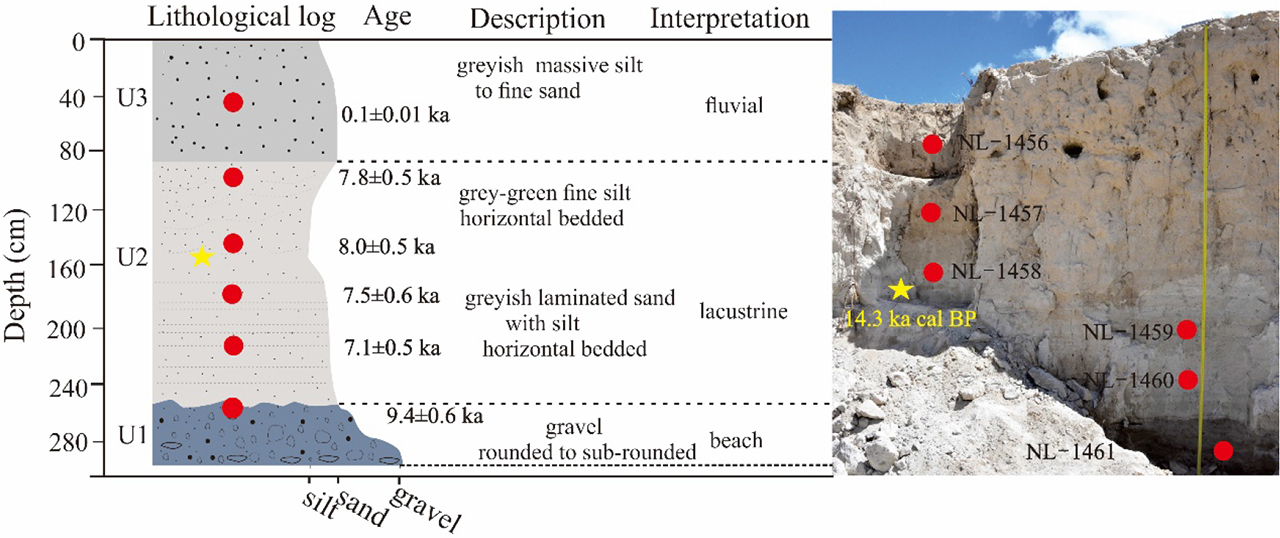
The CE1 site (31° 30′ 29″ N, 88° 48′ 20″ E) is about ∼18 m above present lake level (a.p.l.l.), and the ∼2 m thick section exhibits significant variations in sedimentary composition and structure. It can roughly be divided into three stratigraphic units (U1 from the bottom, U2 in the middle and U3 from the top) by apparent unconformities (Fig. 2). The lower part of U1 consists of coarse well-rounded, clast-supported pebbles with a thickness of 0.5 m (exposed part); its upper part consists of fine sand intercalated with a few pebbles characterised by slightly parallel laminations; this suggests shoreline deposits formed during high-energy processes. U1 is overlain by U2 with nearly sharp contact; U2 (∼2 m thick) is mainly composed of fine sand with sheet-like, plane-parallel laminations which can be observed over 20 m in horizontal extent; a striking feature of this unit is the presence of shells. The occurrence of shells rich sediments and plane-parallel laminations indicates that sediments were deposited in a typical lacustrine environment. The massive fine-grained sands in U3 are 1–2 m thick and are characteristic for fluvial channel deposits; the unit has a concave-up basal scour with low topographic relief, deposited under fluvial conditions. To build up a chronology of the CE1 profile, six samples were collected with steel tubes for luminescence dating. Additionally, for radiocarbon dating two shell samples (Beta-471695 and Beta-471698) were also taken, one from the CE1 section (162 cm depth) and another in a modern shoreline from a different location.
. DATING METHODS
Sample preparation
All luminescence samples’ preparation and measurement were performed at the Luminescence Dating Laboratory of NIGLAS (Nanjing, China). In subdued red light, the daylight-exposed outer layer of the samples was scraped off for water content and dose rate measurements. The remaining (un-exposed) material was prepared for the equivalent dose (De) measurements.
These six samples were wet sieved to extract the coarse grain size fraction (63–90 μm or 100–200 μm). Samples were firstly treated with 30% H2O2 and 10% HCl to remove organic material and carbonates, respectively. Subsequently, the K-rich feldspar fraction (<2.58 g/cm3), and the quartz-rich fraction (2.62–2.70 g/cm3) were separated with a heavy liquid solution (sodium polytungstate). The quartz grains were etched with 40% hydrofluoric (HF) acid for one hour to remove the outer alpha-irradiated layer of the quartz and to eliminate feldspar contamination, and then the etched fraction was rinsed with 10% HCl to remove fluoride. Considering that HF etching on feldspar tends to attack the cleavage planes of the mineral grains, instead of removing the outer rim uniformly (Duller, 1994), we did not etch the K-feldspar grains with HF. Instead, we took the external alpha-irradiated dose rate of the feldspar grains into account for total dose rate calculation. The pure quartz and K-feldspar grains were mounted as 6 mm and 2 mm diameter monolayers respectively on 9.8 mm diameter stainless steel discs using silicone oil as an adhesive for measurements.
De values were measured with an automated luminescence reader (Risø TL/OSL DA-20) equipped with a 90Sr/90Y beta source. For quartz OSL, blue LEDs (470 nm) were used for stimulating the aliquots and a 7.5-mm Hoya U-340 filter was used as the signal detection filter in front of the photomultiplier tube. For the infrared (IR) stimulation of K-feldspar, infrared LEDs (870 nm) were used and the infrared-stimulated luminescence (IRSL) signal was detected through a combination of Schott BG-39 and BG-3 filters in the blue-violet spectrum between 320 and 450 nm.
Dose rate determination
Approximately 60 g of sediments from each luminescence sample were dried for 4 days at 50°C until constant weight to determine the present-day water content. The dried material was homogenised, and a subsample of 5 g was ground to powder for the measurement of dose rate related elements, i.e., uranium (U), thorium (Th) and potassium (K), using neutron activation analysis (NAA) at the China Institute of Atomic Energy in Beijing. The cosmic ray contribution to dose rate for each example was estimated as a function of depth, altitude and geomagnetic latitude (Prescott and Hutton, 1994). An α-value of 0.15 ± 0.05 is used according to Balescu and Lamothe (1994) for external α-dose rate calculation of the outer 0.25 mm (following Aitken, 1998) of the feldspar grains. For the internal β-dose rate, a K concentration of 12.5 ± 0.5% (Huntley and Baril, 1997) and an Rb content of 400 μg/g (following Huntley and Hancock, 2001) are assumed. Finally, the total dose rates were calculated using the conversion factors of Guérin et al. (2011). We used the water contents measured from fresh sediments with an uncertainty of 10% for dose rate calculation of all samples.
Measurement protocol for equivalent dose estimation
The De of CG quartz was determined using a routine single-aliquot regenerative-dose (SAR) protocol (Murray and Wintle, 2000) with an additional step of IR depletion to monitor feldspar contamination (Duller, 2003) in the SAR sequence. A previous study pointed out anomalous fading on quartz samples from an adjacent region (Rades et al., 2015). Thus, we carried out an anomalous fading test according to the procedure described by Auclair et al. (2003).
Thomsen et al. (2008) firstly proposed the potential of an elevated temperature pIRIR SAR protocol. Afterwards, Madsen et al. (2011) modified and applied this protocol (Table 1). This study measured the IRSL signal at 50°C (IRSL50) for 100 s, followed by another IRSL measurement at an elevated temperature at 150°C (pIRIR150) for 100 s. For both the pIRIR150 and IRSL50 signals, intensities were calculated from the initial 10 s, less a background derived from the last 10 s to make it suitable for young samples.
Table 1
Protocol used to measure pIRIR150.
Radiocarbon dating
Radiocarbon dating was determined at Beta Analytic. The samples were processed using a conventional acid-alkali-acid treatment to remove carbonate and other contaminants. The alkali-insoluble organics were obtained and then prepared as graphite for AMS radiocarbon measurements. The measured 14C ages were calibrated to calendar years using the CALIB program with the IntCal 13 dataset after 13C/12C adjustment (Reimer et al., 2013) (Table 2).
. RESULTS AND DISCUSSION
Luminescence characteristics
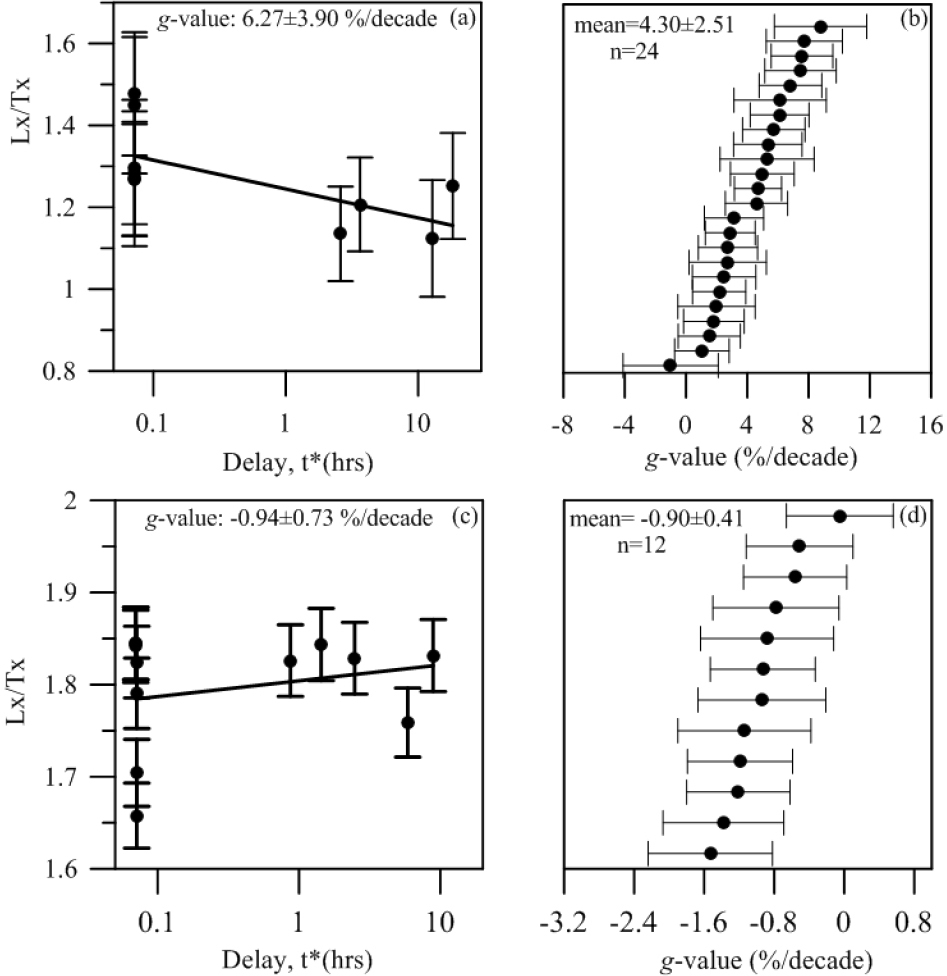
Fig. 3a demonstrates the decay curve of CG quartz OSL signals for one representative example (NL-1457), showing a minimal natural OSL signal. Similarly, other CG quartz samples also showed very dim natural and regenerated OSL signals. Only several tens of counts for the first 0.16 s of stimulation were obtained when a test dose of ∼10 Gy was applied. Meanwhile, anomalous fading tests were conducted on quartz grains of the six samples (four aliquots for each) from CE1. Unexpectedly, we found anomalous fading rates of 2–9 %/decade (mean 4.30 ± 2.51 %/decade) in our quartz samples (Fig. 4a and 4b). In addition, we carried out an anomalous fading test on Risø calibration quartz (Hansen et al., 2015) with an average result −0.90 ± 0.41 %/decades (Fig. 4c and 4d). Compared with calibration quartz, we conclude that the quartz samples from CE1 suffer from anomalous fading. Until now, there is no reliable method to fading correction of quartz ages (Rades et al., 2015). Therefore, we only use the pIRIR measurement of K-feldspar fraction to set up the chronological framework for the sediments of Cuoe Lake. Fig. 3b shows an example (NL-1457) for a natural IRSL50 decay curve and the subsequently measured pIRIR150 decay curve for the same aliquot.
Fig. 3
(a) The example decay showing very low natural quartz OSL signals; (b) Typical IRSL and pIRIR decay curves of K-feldspar of sample NL-1457.
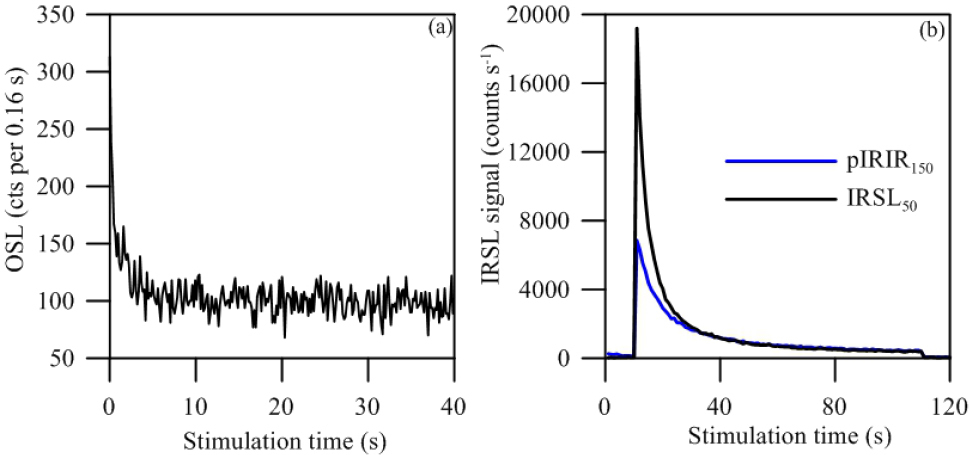
Fig. 4
(a) Fading rate (g-value) of CG quartz for a representative aliquot (NL-1456); (b) Summary of g-values of 24 aliquots from all samples; (c) The g-value determination for standard quartz sample; (d) Summary of g-values of standard quartz samples.
In order to confirm the suitability of the used measurement protocol, it is commonly accepted that three routine tests should be carried out for any new SAR protocol, i.e., the examination of the recycling ratio, recuperation and dose recovery tests (DRT) (Murray and Wintle, 2000; Buylaert et al., 2009). Fig. 5a summarises the recycling ratios for the pIRIR150 signal. The mean recycling ratio for all samples in this study is 1.10 ± 0.01, illustrating that the sensitivity correction is not so good but acceptable; the relatively high recycling ratios were probably due to lacking of elevated temperature cleanout at the end of our SAR cycles. Fig. 5b summarises the recuperation values, suggesting less than 5% for most measured aliquots (mean=3.50 ± 0.17%), which are considered relatively small.
Fig. 5
Histograms summarizing the recycling ratios (a) and recuperation values (b) of pIRIR150 measurements; Dose recovery ratio (c) and residual dose (d) on pIRIR150 signal for the six samples.

Furthermore, dose recovery tests were undertaken for all six samples (three aliquots for each). First, the aliquots were bleached with a solar simulator (Hönle SOL2) lamp for 4 h (e.g., Reimann and Tsukamoto, 2012; Buylaert et al., 2012). They were then given a beta-dose of ∼30 Gy and measured using the pIRIR protocol. The DRT results of all six samples are presented in Fig. 5c, showing that measured-to-given dose ratios for pIRIR150 signal ranged between 0.9 and 1.1 after subtracting the residual dose mentioned below. This further confirms that the SAR protocol applied to the pIRIR signals appears to be satisfactory.
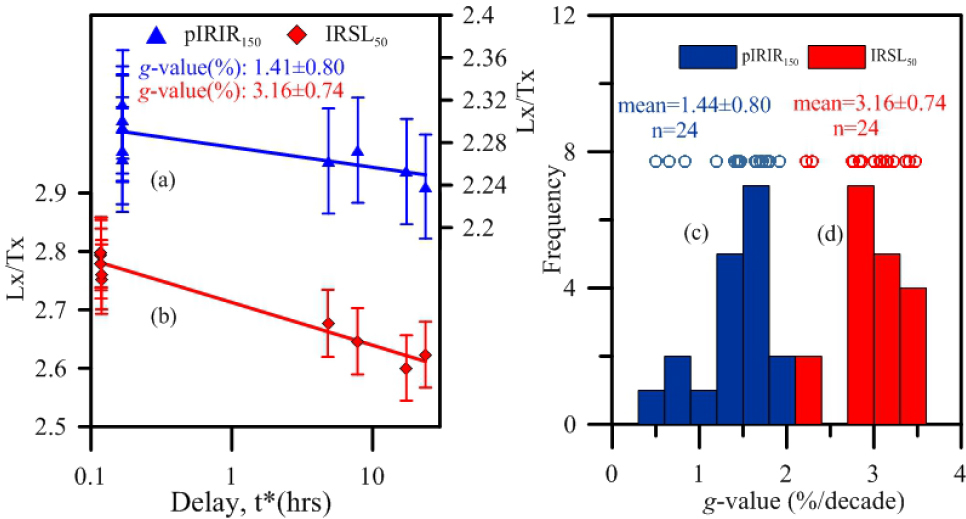
It is well known that most feldspar samples suffer from anomalous fading. Huntley and Lamothe (2001) showed that the luminescence signal decayed linearly with the logarithm of time and attributed this loss to anomalous fading which is usually quantified by the g-value. We determined fading rates (g-value) for pIRIR150 signals as well as IRSL50 using the procedure of Auclair et al. (2003). Fig. 6a and Fig. 6b show the g-values for both pIRIR150 and IRSL50 signals of a representative sample (NL-1459), ranging from 0.9 to 1.44 %/decade and from 2.3 to 3.4 %/decade, respectively. The pIRIR150 and IRSL50 g-value for all discs are summarised as histograms in Fig. 6c and Fig. 6d. The mean pIRIR150 g-value is 1.44 ± 0.80 %/decade, which is much lower than the mean IR50 g-value of 3.16 ± 0.74 %/decade. Thus, we propose that the use of the pIRIR150 signal is able to reduce anomalous fading even to a negligible level, and so we used the measured De values derived from the pIRIR150 signal for luminescence age calculation. Because the laboratory fading experiments should not be considered as convincing evidence for loss of trapped charge during storage, especially for such low fading rates of 1.0–1.5 %/decade; possibly these low apparent fading rates are an artefact of inaccurate sensitivity correction after storage (Buylaert et al., 2012; Roberts, 2012).
Fig. 6
A g-value determination of CG K-feldspar pIRIR150 in (a) and IRSL50 in (b) signals for a representative aliquots; Histogram summarizing pIRIR150 in (c) and IRSL50 (d) fading rates for all six samples (four aliquots for each sample).
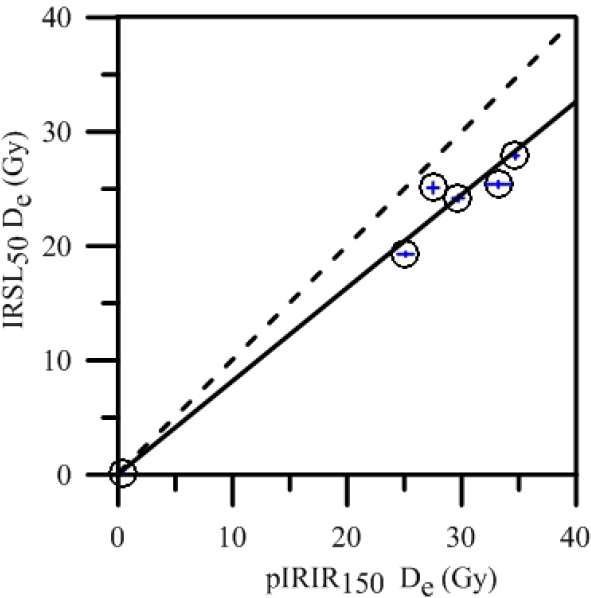
In order to investigate bleaching behaviour for the pIRIR150, residual doses were first measured using three aliquots for each sample after exposure to Hönle2 for 4 h (Zhang et al., 2015). The tests showed that the residual doses range between 0.6 and 0.9 Gy (Fig. 5d), corresponding to ∼200–300 years, which are considered as very young and even negligible compared with the Holocene age-scale of the current study. In addition, it is well known that for feldspar luminescence the elevated temperature IRSL bleaches more slowly than IRSL stimulated at low temperature (Murray et al., 2012; Buylaert et al., 2012; Reimann and Tsukamoto, 2012); thus the comparison of Des derived from signals with different bleaching rates has also been applied to examine the bleaching situation. As shown in Fig. 7, the ratios of IR50 to pIRIR150 doses generally lie on a smooth curve below a slope of 1; this meets the criterion of Buylaert et al. (2013) for identifying well-bleached sediments. Thus, we deduce that the pIRIR150 signals of our samples should be bleached prior to deposition.
For each sample, 12–24 aliquots were used for De measurement. All Des estimates derived from the pIRIR150 signal for the six samples are listed in Table 3, and after that, Des were divided by dose rates derived from NAA measurements to obtain luminescence ages.
Table 3
Luminescence dating results for six samples from CE1 profile.
Comparison between luminescence and 14C ages
It is essential to compare the data generated using luminescence with an independent age control (e.g., 14C dating). Terrestrial plant macrofossils are well known to be most suitable for radiocarbon dating of lake sediment, as they are not affected by old carbon reservoir effects (Long et al., 2011). Unfortunately, macroscopic fossils of terrestrial plants are lacking in this profile probably due to the very low vegetation cover. The luminescence and 14C ages of a sediment layer from CE1 section reveal an apparent offset between two kinds of dating methods by ∼7 ka, which might be caused by the age overestimate of 14C dating due to a reservoir effect in the study. As a previous study reported (Hou et al., 2012), the reservoir effects vary significantly from one lake to another over the TP, e.g., changing from 650 years (Ahung Co) to 6670 years (Bangong Co). In this study, the luminescence dating results revealed a reservoir effect of ∼7 ka for the early Holocene sedimentary unit, which appears much larger than that of modern sediments, i.e. ∼1.3 cal ka BP. This probably suggested temporal variation of reservoir effects in the same lake. The similar results from the same sediment core or profile have already been pointed out in the other lakes on Tibetan Plateau areas (e.g., An et al., 2012; Hou et al., 2012; Long et al., 2012). Therefore, the robust luminescence ages may provide a way to estimate the 14C age reservoir effect of lake sediments.
The chronostratigraphy of CE1 section and its implications on lake-level evolution
Based on the luminescence dating and stratigraphic analysis, we constructed the chronostratigraphy of the CE1 section (Fig. 2). Before ∼9.4 ka, the beach deposits in CE1 indicated that the lake level nearly reached at ∼16 m (a.p.l.l.). The lacustrine sediment formed between 9.4 ± 0.6 ka and 7.1 ± 0.5 ka, suggesting that the lake began extension and remained a relatively high lake-level (above ∼18 m a.p.l.l.). A prominent lake-level drop after 7.1 ka is indicated by a clear erosional surface followed by a layer of fluvial sediment dated to ∼0.1 ka. Our results are overall in phase with other published hydro-climate records from Selin Co. The isotope data provided evidence that the lake rose and expanded to reach its highstand condition from ∼10.5–9.5 ka (Gu et al., 1993; Kashiwaya et al., 1995). Similarly, a slight increase in the lake level from ∼11 to 8 ka was observed based on TOC content (Gyawali et al., 2019). The pattern of a high and stable lake during the early Holocene and relatively low lake level in the middle to late Holocene unveiled in Selin Co and other adjacent geological archives can be comparable with Indian Summer Monsoon (ISM) precipitation reconstructions derived from stalagmite δ18O (e.g., Tianmen Cave, Cai et al., 2012). He et al. (2017) investigated Linggo Co on the central TP and contended that the ISM had been strengthened significantly between 10 and 7 ka according to the leaf wax δD record. The TOC record from alpine wetland sequence (Dangxiong County) on central TP suggested wetland initiation at approximately between 8.7 ka and 7.2 ka, as an indicator of increased monsoon precipitation (Cheung et al., 2017). An early Holocene lake level maximum around 9–8 ka is also recorded for many lakes of the southern Tibetan Plateau (Kasper et al., 2015; Ahlborn et al., 2016). During the Middle to Late Holocene, the relatively low lake level might be related to the lower effective moisture which has been resulted by weakened monsoon (Herzschuh, 2006).
. CONCLUSION
This study reconstructed the sedimentary history of Cuoe Lake, mainly based on luminescence dating of outcrop CE1, and then lake level fluctuations were inferred. Luminescence characteristic tests show that quartz OSL signal is too dim to date and even suffers from anomalous fading, which limits the application of quartz mineral. Alternatively, the suitability of the pIRIR protocol measured at 150°C (pIRIR150) for K-feldspar fractions is confirmed by a set of luminescence tests. Compared with luminescence age, 14C dating of a shell sample recovered from the lake sediments yields much older age by ∼7 ka, which might be a result of hardwater reservoir effect. Combining the luminescence-based chronology and sedimentary analysis, we conclude that the Cuoe Lake has experienced peak water-level during the early Holocene (∼9.4–7.1 ka), and lake-level drop afterwards; this lake-level variation pattern is probably related to the changes of the dominant summer monsoon system.