
. INTRODUCTION
Yardang is a typical wind-erosional landform in the arid and hyper-arid areas on the Earth (Goudie, 2007; Al-Dousari et al., 2009), and is a common landform on the Mars as well (Xiao et al., 2017, Anglés and Li, 2017; Wang et al., 2018). Studies on the evolution of Yardang have made significant progress attributed to the development of methods, e.g. remote sensing and geographic information system (Goudie, 2007), exposure dating (Wu et al., 2019) and erosion rate testing (Rohrmann et al., 2013) of 10Be.
The yardang field in the Qaidam Basin (QB), with an area of 3.88 × 10⁴ km2, is the largest one on the Earth (Halimov and Fezer, 1989), and its extreme environments (high, cold, windy, arid and low pressure) make it an ideal terrestrial analogue site for aeolian geomorphologic studies on the Mars (Xiao et al., 2017, Anglés and Li, 2017; Wang et al., 2018). These yardangs indicate a transition from lacustrine to wind-eroded condition (Kapp et al., 2011; Rohrmann et al., 2013). The materials eroded from the yardangs can be redeposited into the downwind dune fields and loess in the eastern and southern QB (Yu and Lai, 2012, 2014; Yu et al., 2013, 2015a, 2015b) and also in the Chinese Loess Plateau (CLP) (Bowler et al., 1987; Kapp et al., 2011; Pullen et al., 2011; Rohrmann et al., 2013; Lai et al., 2014; Mischke et al., 2015). However, the time of the transition from lacustrine and wind-erosion environmental, i.e., the formation of yardangs, is still controversial. Earlier studies based on 14C dating proposed a mega-Qaidam Lake during Marine Isotopic Stage (MIS) 3 (Chen and Bower, 1986; Zhang et al., 2008), while the paleo-lacustrine sediments were dated to MIS5 by quartz Optically Stimulated Luminescence (OSL) dating (Lai et al., 2014). Depending on the regional geomorphological evolution, the formation time of the yardangs (onset of wind-erosion) is closely related to the above issues, but still unclear.
OSL dating has been applied in the QB to date both fluvial/lacustrine and aeolian sediments (e.g., Sun et al., 2010; Yu and Lai, 2012, 2014; Yu et al., 2013, 2015b, 2016; Lai et al., 2014). The quartz OSL signals, however, have been shown to saturate at relatively low doses of ~150 Gy on the CLP (Buylaert et al., 2008; Chapot et al., 2012), making it difficult to date the old (Pleistocene) lacustrine sediments in yardangs. Alternatively, the post-IR IRSL (pIRIR) dating of feldspars (Thomsen et al., 2008), with a much higher saturate dose up to ~1000 Gy (Li et al., 2018), has the potential advantages. Two-step pIRIR procedure (Thomsen et al., 2008; Buylaert et al., 2009) and multiple-elevated-temperature (MET) pIRIR procedure (Li and Li, 2011) have been proposed for feldspar pIRIR dating. Compared with the two-step pIRIR signals, the MET-pIRIR signals are less affected by fading but more difficult to be sufficiently bleached (Li and Li, 2012). However, no studies have shown which method is more suitable for such old sediments on the Tibetan Plateau (TP). In this study, both methods were applied to determine a proper dating method for the lacustrine sediments from yardangs in the central QB, and to offer reliable chronology for the transition from lacustrine to wind-erosional environment and geomorphic evolution (yardang formation).
. YARDANGS AND SAMPLES
QB is a tectonically controlled depression on the northeastern TP and surrounded by Mountains (Fig. 1). Nowadays, with a potential-evaporation/precipitation ratio of > 100 (Chen and Bowler, 1985, 1986; Bowler et al., 1986), the extreme arid QB is dominated by playas/salt lakes and aeolian landforms. Modern meteorological data of 1971–2010 showed that the gale (wind speed ≥17m/s) days reached 163 d/yr (Zhang et al., 2014). Consequently, the wind erosion prevails and now yardangs cover ca. 1/3 area of the QB (Kapp et al., 2011), with the estimated erosion rate as ~0.125–0.29 mm/yr (Kapp et al., 2011; Rohrmann et al., 2013) during the Quaternary. Yardang orientations change from NNW-SSE in the northwestern part to WNW-ESE in the southeastern part corresponding to the changes of wind direction (Li et al., 2016; Hu et al., 2017).
Fig. 1
Landform (A-B) and sampled yardangs (C-D) in the Qaidam Basin. The elevations measured by differential GPS were used in Fig. 1C as it's more accurate.
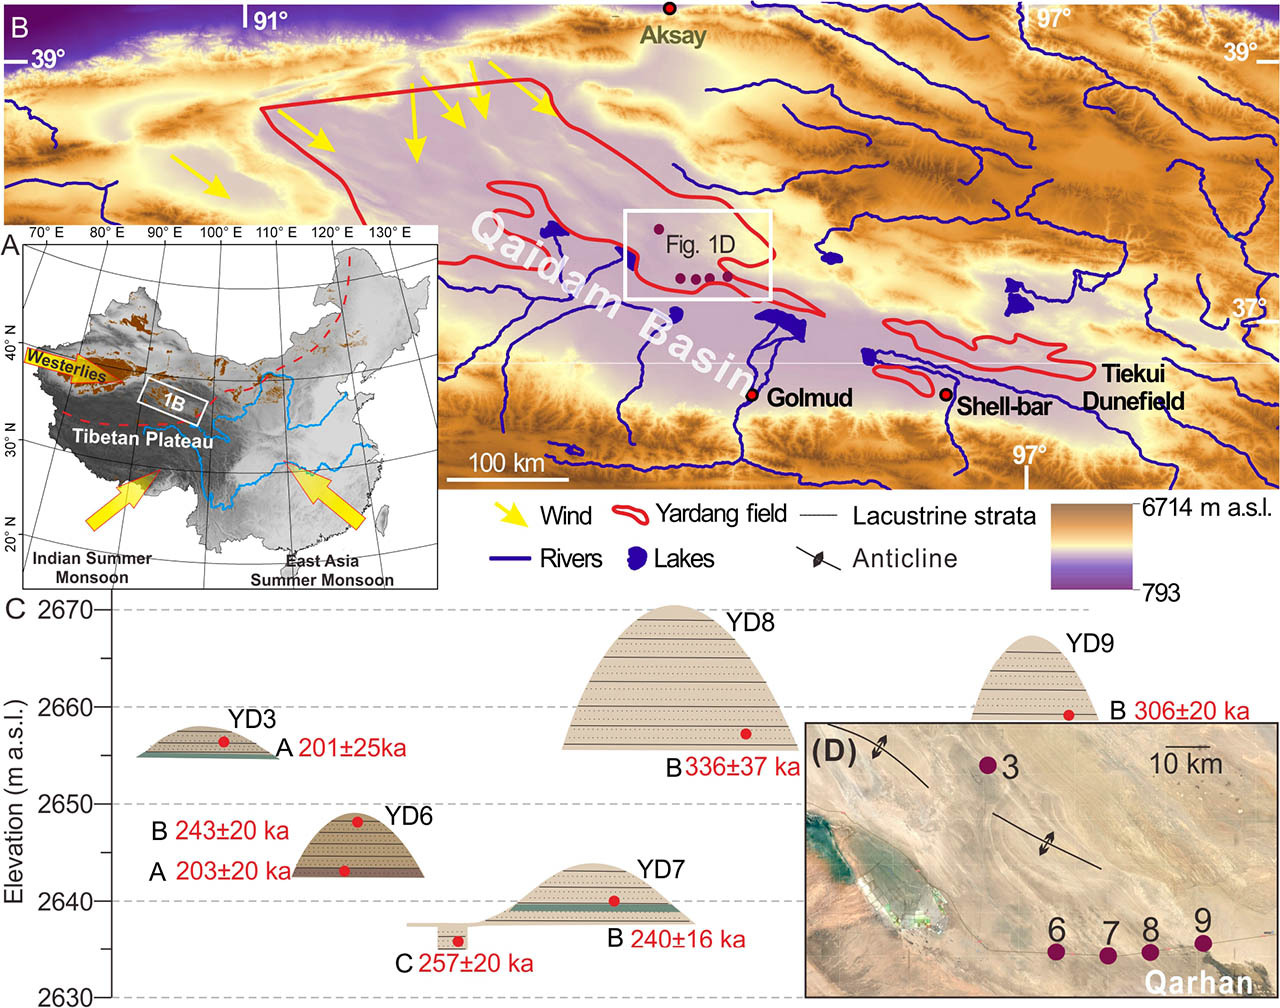
Some road-cut sections display the stratigraphy of yardangs (Fig. 2), with heights of ~5–15 m, in the north of Qarhan Salt Lake (QSL) region. All these sections show horizontal or sub-horizontal strata with greenish, reddish and brownish layers, indicating typical lacustrine characteristics. The horizontal beddings demonstrate the limited influences from tectonic activities, i.e., not too old, which was an important criterion for us to identify the relatively young stratigraphy in the field. To reveal the termination of lacustrine environment, OSL samples were mainly taken from the upper part of the higher yardangs, which might be less eroded. Seven OSL samples were collected from five sites (Fig. 1) with the top elevations of 2643–2671 m measured by differential GPS, which is ~50 m lower than that derived from Google Earth (2704–2721 m). Samples YD3-A, YD6-B and YD7-C are mainly composed of clay and silt, and YD6-A, YD7-B, YD8-B and YD9-B are mainly composed of silt and fine sand. The details of section lithofacies and sampling locations are shown in Table 1.
Fig. 2
Yardang landform and sampling sections. The filled red circles denote the positions of sampling.
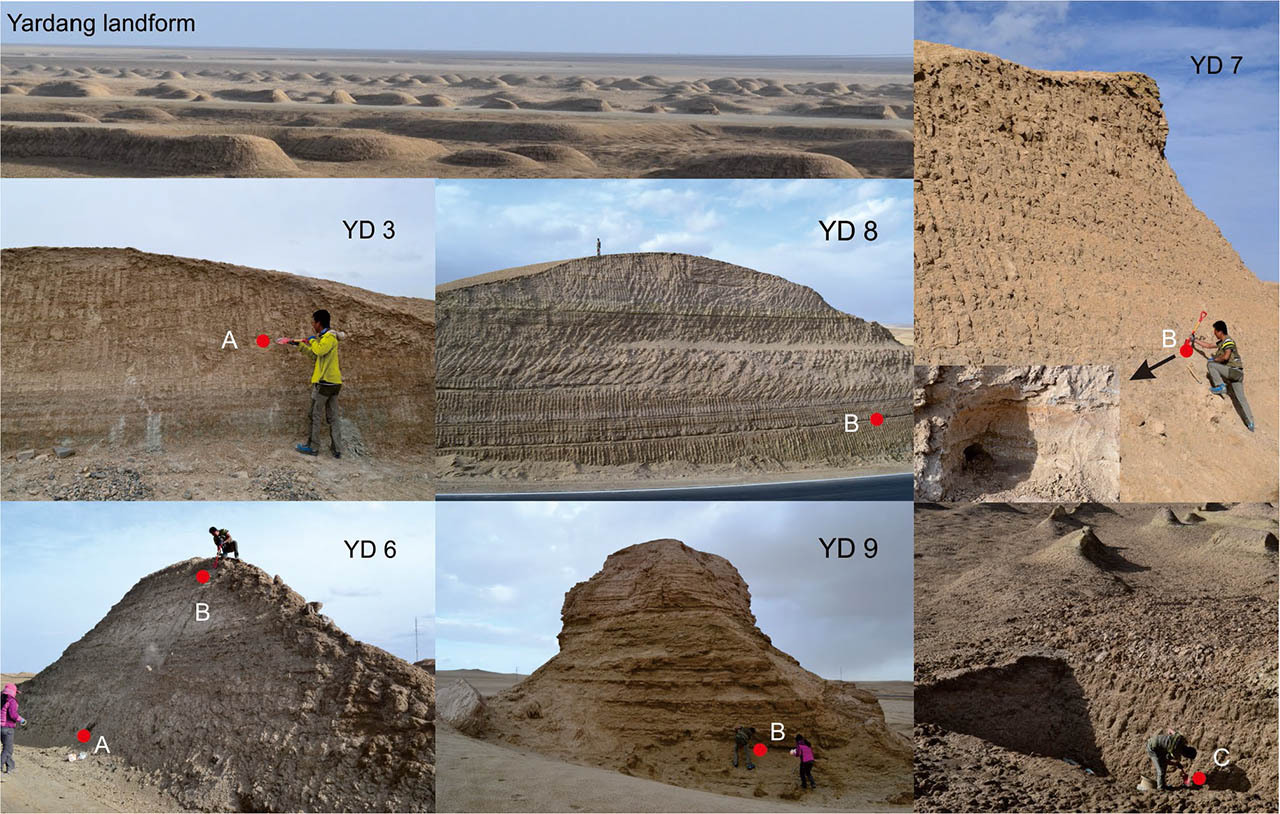
Table 1
Age results of MET-pIRIR250 with sample informations.
| Sample Lithofacies and structures | Yardang height (m) | Grain size (μm) | Depth (m) | Altitude (m) | Water content (%) | Environmental Dose Rate (Gy·ka−1) | MET-pIRIR250 | ||
|---|---|---|---|---|---|---|---|---|---|
| De (Gy) | Age (ka) | ||||||||
| YD3-A | Gray-brown clay, horizontal stratification | 3 | 4–11 | 1+10 a | 2656 | 15±5 | 5.4±0.6 | 1082±75 | 201±25 |
| YD6-A | Gray-brown sandy clay, horizontal stratification | 5.5 | 63–90 | 5+10 a | 2644 | 15±5 | 4.8±0.3 | 980±55 | 203±20 |
| YD6-B | Gray-brown clay, horizontal stratification | 4–11 | 0.5+10 a | 2648 | 15±5 | 4.1±0.2 | 985±74 | 243±20 | |
| YD7-B | Reddish-brown sandy clay, plane-parallel lamination | 6 | 150–180 | 4+10 a | 2640 | 15±5 | 2.8±0.1 | 673±37 | 240±16 |
| YD7-C | Clay-bank clay, horizontal stratification | 4–11 | 8+10 a | 2636 | 15±5 | 4.2±0.2 | 1061±75 | 257±20. | |
| YD8-B | Yellow sand, plane-parallel lamination | 15 | 150–180 | 13+10 a | 2658 | 15±5 | 2.7±0.1 | 902.2±92.2 | 336±37 |
| YD9-B | Yellow sand, plane-parallel lamination | 8 | 150–180 | 8+10 a | 2659 | 15±5 | 2.6±0.1 | 790.0±39.5 | 306±20 |
. MATERIALS AND MEASUREMENTS
Samples were treated with HCl and H2O2 to remove carbonates and organic materials, respectively. The fraction of 4–11 μm (by settling samples using Stokes’ Law) or 150–180 μm (by wet sieving) were selected according to the grain composition of sediments. K-feldspars (KF) were extracted from the coarse grains (150–180 μm) by density separation (2.53–2.58 g/cm3) using sodium polytungstate and without HF etching. The KF were made into small aliquots with a diameter of 2 mm, and the 4–11 μm fractions were made into large aliquots.
Luminescence measurements were made by automated Risø TL/OSL readers (DA-20) with 90Sr/90Y beta sources in Linyi University and China University of Geoscience (Wuhan). The IRSL signals were detected through Schott BG39 and BG3 filters combination. A heating rate of 5°C/s in a nitrogen atmosphere was employed, followed by a pause of 10 s. The Lx and Tx were calculated using the initial 8 s signals of decay curves, with a subtraction of the last 100 s from 500 s for two-step pIRIR or the last 20 s from 100 s for MET-pIRIR. The dose rates and ages were calculated with the online Dose Rate Calculator (Durcan et al., 2015). The internal K contents of KF were estimated as 12.5±0.5% (Huntley and Baril, 1997). The a-value is 0.15±0.05 for coarse grain size (Balescu and Lamothe, 1994), and 0.086±0.038 for fine grain size (Rees-Jones, 1995). The measured water contents range only 0.31–5.47%, which are extremely low, especially for the paleo-lacustrine sediments. Combining their saturated water content of ~20–40% and the alternation of humid and arid environments during the past interglacial-glacial cycles, an average range of measured and saturate values, 15±5%, were estimated for these lacustrine sediments during their burial history. Taking the average wind erosion rate of 0.125 mm/yr (Rohrmann et al., 2013) into account, an additional depth of 10 m was added to the sample depths to calculate the ages. This estimation should be reasonable because the results increase slightly when the depth increases > 10 m. Five samples (YD6-B, YD7-C, YD7-B, YD8-B and YD9-B) are used for methodological studies illustrated as follow.
. METHODS AND EXPERIMENTS
MET- pIRIR
In this study, the IR stimulations at 50, 100, 150, 200, 250, and 290°C with a preheat of 320°C were applied (Table 2a) after Li and Li (2011), using a single-aliquot regenerative-dose (SAR) protocol (Murray and Wintle, 2000; 2003), which is also for the two-step pIRIR.
Table 2
Age results of MET-pIRIR250 with sample informations.
Dose recovery test and luminescence properties
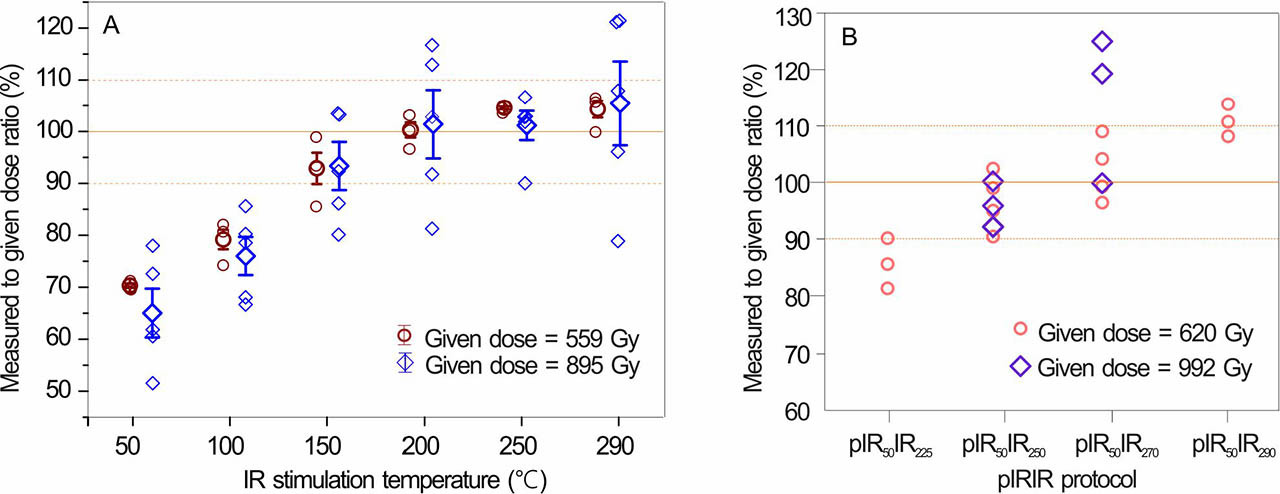
To examine the reliability of De estimation, dose recovery test was conducted on a well-bleached modern sand sample in the QSL region. For KF (150–180 μm), laboratory doses of 559 and 895 Gy were given to 3 and 5 aliquots (diameter of ~3 mm), respectively, followed by a measurement protocol in Table 2a. The ratios of measured to given dose for different MET-pIRIR signals were shown in Fig. 3A, which displays a plateau from 200°C to 290°C, with the best recovery ratio at 250°C.
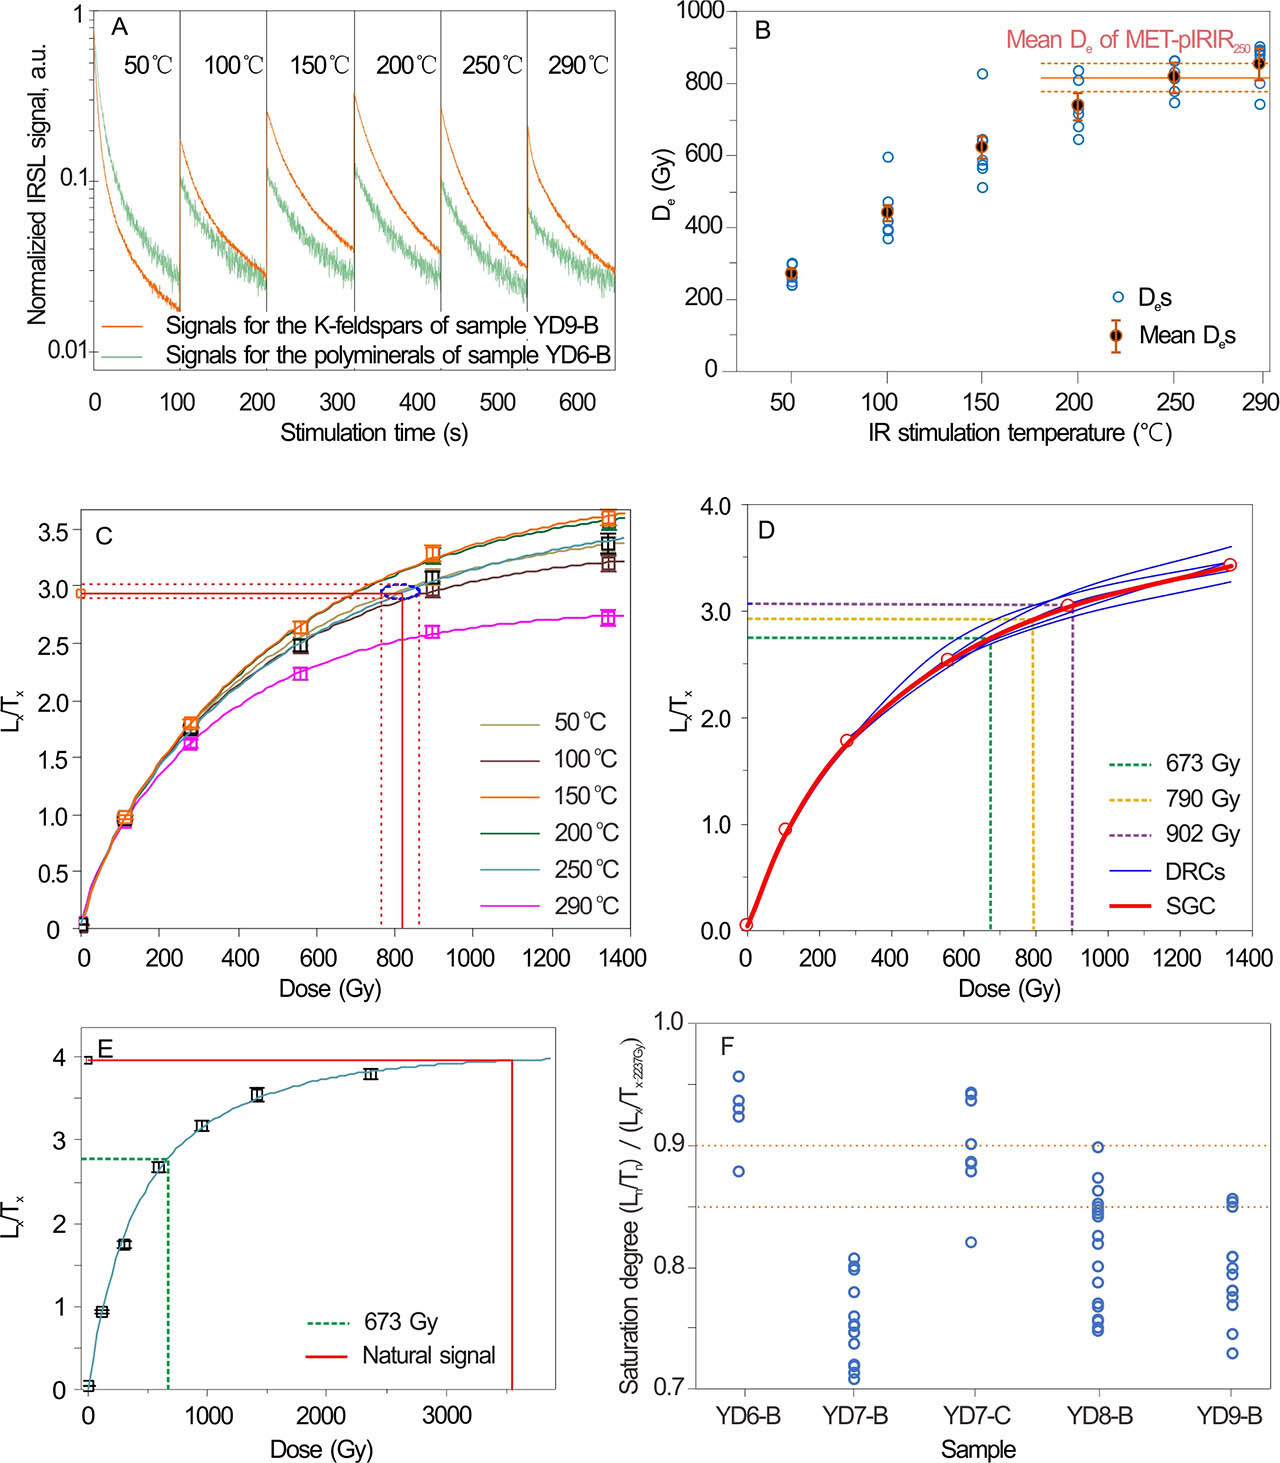
Luminescence properties of MET-pIRIR signals were investigated (Fig. 4). Fig. 4A displayed a similar decay rate between fine-grain polymineral and coarse-grain KF for the MET-pIRIR250 signals. Fig. 4B showed an obvious De plateau between the stimulation temperature of 250 and 290°C, and a continuous increase from 50°C to 200°C. Fig. 4C-4F suggested a saturate dose of beyond 1200 Gy for the MET-pIRIR250 signals, while that of the MET-pIRIR290 signals is lower (Fig. 4C). Fig. 4D also illustrated that the DRCs of MET-pIRIR250 derived from different aliquots are similar to their SGC derived from 3–4 DRCs for each sample, suggesting that the SGC method (Roberts and Duller, 2004; Lai and Ou, 2013) could be applied for these samples.
Fig. 4
Luminescence properties of MET-pIRIR signals using the protocol in Table 2a: (A) Decay curves of K-feldspars and polyminerals, (B) Des at different stimulation temperatures and (C) corresponding DRCs for sample YD9-B, (D) DRCs of MET-pIRIR250 signals of sample YD8-B and their SGC. (E) DRC of MET-pIRIR250 signal of sample of field saturation in the QB, using two exponentials function. (F) Saturate ratio. It is expressed by the ratios of (Ln/Tn) (natural signals) and (Ls/Tn), the latter is derived from ~1969 Gy and field saturated dose for fine-grain polyminerals and coarse-grain K-feldspars, respectively (no fine-grain sample of field saturation were collected).
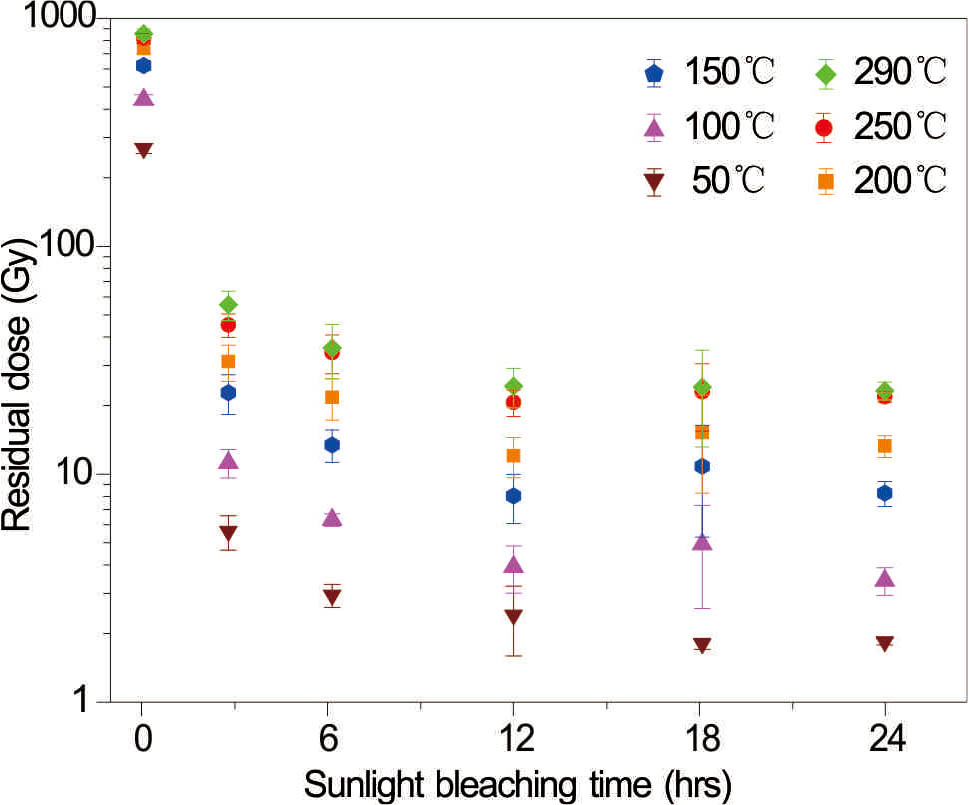
Bleaching behaviour and residuals
To test the bleaching behaviour of MET-pIRIR signals of the paleo-lacustrine sediments, six groups of small aliquots were exposed to natural sunlight for different bleaching durations in Linyi (118°17′ E, 35°07′ N) in August 2018. The results (Fig. 5) indicated that the residual doses of MET-pIRIR signals at different stimulation temperatures all decreased with the increase of bleaching time. Moreover, residual signals of 250°C were bleached to 4.2% of the natural signals after 3 hrs bleaching, and the residual dose dropped to only 21.8 Gy (equal to ca. 6.2 ka with an average dose rate of 3.5 Gy/ka) after 24 hrs. This suggested the MET-pIRIR250 signals could be well bleached in the QB, where the insolation is of over 5000 MJ/(m2·a), 50–100% higher than in the low-altitude areas of the same latitude (Zheng and Zhao, 2017).
Two-step pIRIR
To decrease the influence of the undetectable carryover charge (Kars et al., 2014) and probable anomalous fading, an extended stimulation time of 500 s and a big test dose of 248 Gy were applied (Colarossi et al., 2018). The latter has the effect of increasing D0 values as well (Qin and Zhou, 2012; Colarossi et al., 2018). The protocol for pIR50IR250 determined by dose recovery test was shown in Table 2b.
Dose recovery test and luminescence properties
Twenty aliquots of sample YD9-B were bleached by sunlight for 24 hrs for dose recovery test. Preheat temperatures of 250–320°C (250, 280, 300, and 320°C) were applied, followed by a first IR stimulation at 50°C, and a second IR stimulation at 225, 250, 270, and 290°C, respectively. The first dose of 620 Gy was given, and 3–4 aliquots for each temperature were measured. Without the subtraction of residual doses (for details see Section 4 – Two-step pIRIR – Residuals and anomalous fading test) from Des, the measured/given dose ratios (Fig. 3B) suggest the results of pIR50IR250 and pIR50IR270 are acceptable. Another dose recovery test of 992 Gy (Fig. 3B) and the smaller residual dose further confirmed that the pIR50IR250 signals behaved better.
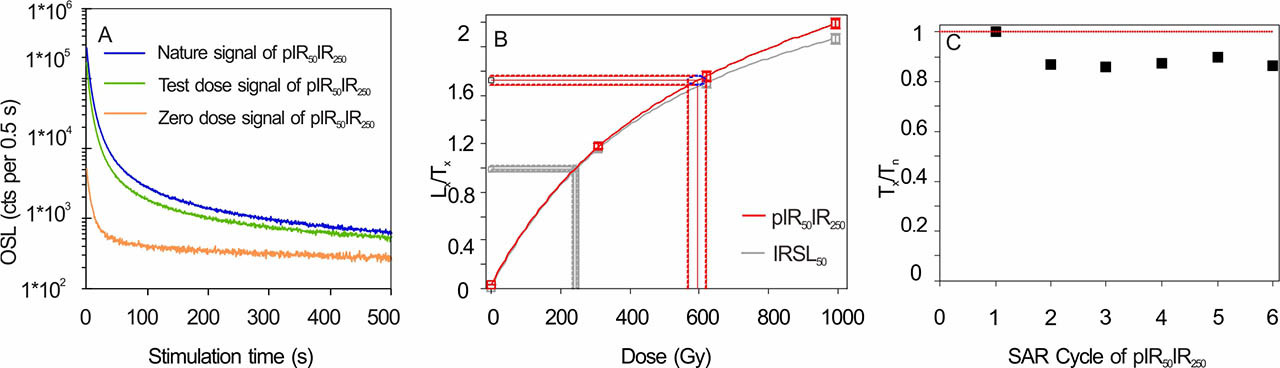
The signals of the nature dose and test dose of the pIR50IR250 signals can decay to a low level after stimulation of 500 s (Fig. 6A), which was further confirmed by the relative stable sensitivity changes during the SAR cycles (Fig. 6C). Fig. 6B displayed that the natural dose of IRSL50 is much smaller than the pIR50IR250, which was attributed to the fading of the IRSL50. The SGC of the pIR50IR250 signals coincide with their DRCs as well.
Residuals and anomalous fading test
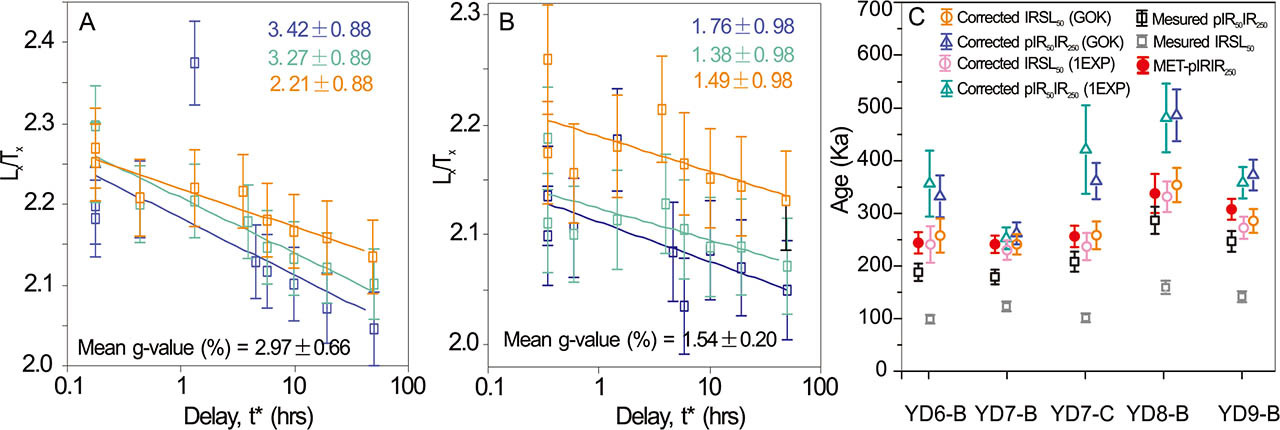
The residual dose determination was conducted on six sunlight-bleached (24 hrs) aliquots for each temperature, and the results of pIR50IR225, pIR50IR250, pIR50IR270 and pIR50IR290 were 6.2, 8.2, 11.6, and 14.2 Gy, respectively. The anomalous fading rate measurements were conducted on three measured aliquots (YD9-B), and the single aliquot measurement procedures were similar to Auclair et al. (2003), but based on the pIR50IR250 protocol (Table 2b). The same regenerative dose of 124 Gy followed by a preheat of 280°C was given before different storage times. Using the software of Analyst, a series of Lx/Tx values as a function of storage times were plotted for the g-value that is normalised to a tc of 2 days (Huntley and Lamothe 2001). As shown in Fig. 7A and 7B, the measurements of 3 aliquots show a mean g-values of 1.54±0.20 %/decade for the pIR50IR250, and 2.97±0.66 %/decade for the IRSL50.
. RESULTS AND DISCUSSION
Comparisons of MET-pIRIR250 and pIR50IR250 dating
MET-pIRIR250
For MET-pIRIR, a plateau of similar De values obtained at higher temperatures could suggest negligible anomalous fading (Li and Li, 2011). In this study, the De plateaus between 250 and 290°C (Fig. 4C) suggested negligible fading as well. The MET-pIRIR250 signal was chosen because its residual dose was smaller and the signal level was higher than that of the MET-pIRIR290.
The measured residual dose of MET-pIRIR250, 21.8 Gy, (Fig. 5) was subtracted from the mean Des of each sample for correction. In this study, any aliquots without De plateau between MET-pIRIR250 and MET-pIRIR290, which suggested insufficient bleaching (Fu, 2014), were rejected. Furthermore, the DRCs fitted with double exponentials (Fig. 4D) can offer higher saturate dose of beyond 1200 Gy for MET-pIRIR250 signals. This was supported by the conclusion of Galbraith and Roberts (2012) that much higher De values could be estimated when the DRC was fitted accurately. A field saturated yardang sample offered a De of beyond 2237 Gy (Fig. 4E), suggesting the fading of the MET-pIRIR250 signals was very minimal. If the normalised natural signals of the saturate sample (Ls/Tn=3.961) was regarded as the saturation level, the normalised natural signals (Ln/Tn) could be compared with it to evaluate the saturate ratio ((Ln/Tn)/(Ls/Tn)) for each coarse-grained aliquot (Fig. 4F). Due to the lack of field saturate sample for fine grains, the minimal laboratory saturation level (~1969 Gy, we did not make the DRC saturation) was used to estimate a maximal saturate ratio for each fine-grained aliquot. Most of the coarse-grain samples have the saturate ratios of below 85%. However, without independent age control, we are cautious with the results of ca. 900–1000 Gy. The success of dose recovery test of 895 Gy (Fig. 3A) further suggested that at least the results below 900 Gy were reliable. The comparison of the ages, stratigraphy and elevations among different sections also demonstrated the reliability of most of these ages, as interpreted in part 5.2. All the MET-pIRIR250 ages are in Table 1.
pIR50IR250
The fading test (Fig. 7A-7B) offered a mean g-value of 1.54±0.20 %/decade for pIR50IR250 signals. Some studies proposed that the fading correction for the pIR50IR225–290 is unnecessary because either their natural signals can reach saturate level (Thiel et al., 2011; Liu et al., 2016), or the uncorrected age could agree with the independent ages (Thiel et al., 2011; Roberts, 2012). Thiel et al. (2011) proposed that the measured g-values (0.07±0.78 to 2.00±0.64 %/decade) for pIR50IR290 were artificial in the laboratory and should be ignored. In contrast, Li and Li (2012) found that the anomalous fading would lead to underestimations for older samples (e.g., >500 Gy) with the pIR50IR290 method, while it is not a problem for younger samples. For our samples, the measured ages of pIR50IR250 were severely underestimated by even more than 20% compared to MET-pIRIR250 ages. Based on the anomalous fading tests, ages of IRSL50 and pIR50IR250 were calibrated according to the model of Huntley (2006) for our relative old samples. The calculations were conducted with the R. luminescence package (Kreutzer et al., 2019), using the approaches in Kars et al. (2008) (a single-saturating exponential fit, 1 EXP) and Guralnik et al. (2015) (a general-order kinetic fit, GOK), which had been evaluated for the fading-correction by King et al. (2018). The corrected results were shown in Fig. 7C, and Table 3 gives some details, including the samples’ saturation level (i.e., (n/N) is the samples’ level of saturation for the natural state; (n/N)_SS is the samples’ level of saturation for field steady-state (King et al. 2018)), measured De, corrected D0, corrected De, corrected age. The comparisons of saturation level displayed that when the measured Des of pIR50IR250 reach ~700–800 Gy, results of 1EXP fitting showed saturation (e.g., sample YD6-B, YD7-C and YD8-B), but not GOK fitting (Table 3). This suggested that the fitting mode might affect the saturation of simulated DRCs, especially for old samples. Nevertheless, YD7-B and YD9-B can be determined to be unsatu-rated (Table 3), which confirms that such high underestimation of pIR50IR250 was caused by anomalous fading rather than natural saturation. This agrees with the result of Thomsen et al. (2011) that the extended duration of the prior IRSL50 for beyond 100 s could not offer a significantly more stable pIR50IR290 signal. As shown in Fig. 7C, the ages of corrected IRSL50 agreed with MET-pIRIR250, however, except for YD7-B, the fading corrections of pIR50IR250 showed an overestimation (Fig. 7C), similar to the description of King et al. (2018). It might be related to a state near or already saturated (e.g. sample YD6-B, YD7-C and YD8-B), fitting modes and/or the differences between laboratory dose response and natural dose response caused by different origins or chemical compositions (King et al., 2018). As a result, the pIR50IR250 dating is affected by anomalous fading for our samples even for a prior IRSL50 of 500 s, and the correction for anomalous fading needs further studies. Consequently, the chronology for the following discussion was based on the MET-pIRIR250 ages.
Table 3
The results corrected by Huntley (2006) method.
| Function | Sample | IRSL50 | |||||
|---|---|---|---|---|---|---|---|
| (n/N) | (n/N)_SS | Measured Dea (Gy) | Corrected D0b (Gy) | Corrected Dec (Gy) | Corrected Aged (ka) | ||
| 1EXP | YD6-B | 0.54±0.02 | 0.60±0.13 | 397±16 | 372±1 | 973±124 | 240±34 |
| YD7-B | 0.43±0.01 | 0.58±0.14 | 345±11 | 465±1 | 642±29 | 229.0±19 | |
| YD7-C | 0.52±0.02 | 0.59±0.13 | 429±18 | 422±1 | 981±85 | 236±25.8 | |
| YD8-B | 0.48±0.01 | 0.57±0.14 | 427±14 | 479±1 | 886±49 | 330±29 | |
| YD9-B | 0.44±0.01 | 0.59±0.14 | 364±10 | 467±1 | 700±27 | 271±21 | |
| GOK | YD6-B | 0.46±0.02 | 0.60±0.17 | 401±20 | 362±1 | 1040±110 | 256±32 |
| YD7-B | 0.37±0.01 | 0.60±0.16 | 345±12 | 501±2 | 673±30 | 240±19 | |
| YD7-C | 0.34±0.01 | 0.62±0.15 | 423±21 | 463±3 | 1070±82 | 257±26 | |
| YD8-B | 0.40±0.01 | 0.57±0.12 | 428±17 | 494±1 | 945±59 | 352±32 | |
| YD9-B | 0.32±0.01 | 0.59±0.12 | 365±11 | 583±1 | 733±31 | 284±23 | |
| Function | Sample | IR50IR250 | |||||
|---|---|---|---|---|---|---|---|
| (n/N) | (n/N)_SS | Measured Dea (Gy) | Corrected D0b (Gy) | Corrected Dec (Gy) | Corrected Aged (ka) | ||
| 1EXP | YD6-B | 0.72±0.02 | 0.72±0.21 | 716±40 | 439±1 | 1440±2334 | 355±62 |
| YD7-B | 0.57±0.02 | 0.71±0.2 | 491±18 | 483±1 | 705±33 | 252±21 | |
| YD7-C | 0.73±0.02 | 0.72±0.2 | 815±48 | 487±1 | 1744±328 | 419±84 | |
| YD8-B | 0.69±0.02 | 0.71±0.2 | 726±36 | 497±2 | 1286±151 | 480±65 | |
| YD9-B | 0.61±0.02 | 0.71±0.19 | 616±23 | 535±2 | 920±46 | 357±30 | |
| GOK | YD6-B | 0.54±0.02 | 0.72±0.19 | 760±42 | 485±2 | 1342±133 | 331±40 |
| YD7-B | 0.41±0.01 | 0.72±0.22 | 500±20 | 605±3 | 731±32 | 261±21 | |
| YD7-C | 0.31±0.01 | 0.72±0.23 | 862±54 | 800±11 | 1497±102 | 360±34 | |
| YD8-B | 0.52±0.02 | 0.71±0.19 | 766±45 | 549±2 | 1300±98 | 484±49 | |
| YD9-B | 0.24±0.01 | 0.72±0.24 | 633±28 | 1170±26 | 957±39 | 371±29 | |
a De calculated through measured DRC (King et al., 2018).
b D0 for simulated natural DRC (King et al., 2018).
c De calculated through simulated natural DRC (King et al., 2018).
d Age calculated through simulated natural DRC (King et al., 2018).
pIRIR chronology for paleo-lacustrine sediments
Previous chronology of lacustrine sediments in the QB was mainly based on 14C dating during the past decades (e.g., Chen et al., 1981; Chen and Bowler, 1986; Bowler et al., 1986; Zhang et al., 2008). A mega-Qaidam paleolake was proposed to exist during ca. 40–30 ka (MIS3) based on the 14C dating of shells in the shell-bar (Fig. 1B, 2703 m a.s.l. on Google Earth) in the southeastern QSL region (Chen and Bowler, 1986; Zhang et al., 2008). However, the range of 14C dating is too young for the yardangs in the QB, and even the 14C ages of 25–40 ka were proved to be underestimated in the QB (Yu et al., 2009; Lai et al., 2014; Mischke et al., 2015; Yu et al., 2018). Lai et al. (2014) dated the shell-bar to MIS5 (~100–110 ka) based on quartz OSL. While the upper dating limit of quarts OSL (ca. 150 Gy on the CLP (Buylaert et al., 2008; Chapot et al., 2012)) implied that this result might also be underestimated. The feldspar MET-pIRIR250, in this study, offered seven paleo-lacustrine ages ranged from ca. 200 to 340 ka in the northern QSL region (Table 1), demonstrating a mega-Qaidam paleo-lake existed in QSL during and prior to MIS 7.
The new MET-pIRIR250 ages from this paper, together with the elevations of sections and samples, were displayed in Fig. 1C. The purpose of this study is to explore the termination time of the lacustrine environment. Consequently, we tried to investigate the ages of the highest yardangs in different regions. Based on the distribution, stratigraphy and ages, the five sections could be classified as three regions, the northern region (YD3), middle region (YD6 and YD7) and the eastern region. The YD6 and YD7 sections are close in distance and elevation. The De of YD7-B was only 673 Gy, which was far from saturation (Fig. 4D-4F), and consequently, its age of 240±16 ka is considered reliable. The YD6 section, at a higher elevation than YD7, should be younger than the latter. The YD6 presented similar ages with YD7 (reverse, but the same within errors), and we took their average age of 223±20 ka. As a result, the termination of the lacustrine environment in the middle region was after 220 ka. This also agrees with the YD3 section in higher elevation and with younger ages (201±25 ka). In this case, we can conclude that the lacustrine environment in the middle and northern regions terminated after ca. 200 ka, the MIS7. The low De of YD7-B further suggested these similar ages on similar elevation were less affected by fading and reliable. The YD8 and YD9 sections located at a higher elevation, and the De of YD9-B, 790 Gy, suggested the ages of MIS 9 should also be reliable. However, the samples cannot well present the latest time of lakes because they were not taken from the top of the yardangs, and consequently, it is unnecessary to make much interpretation on these two samples here.
Implications for yardang development
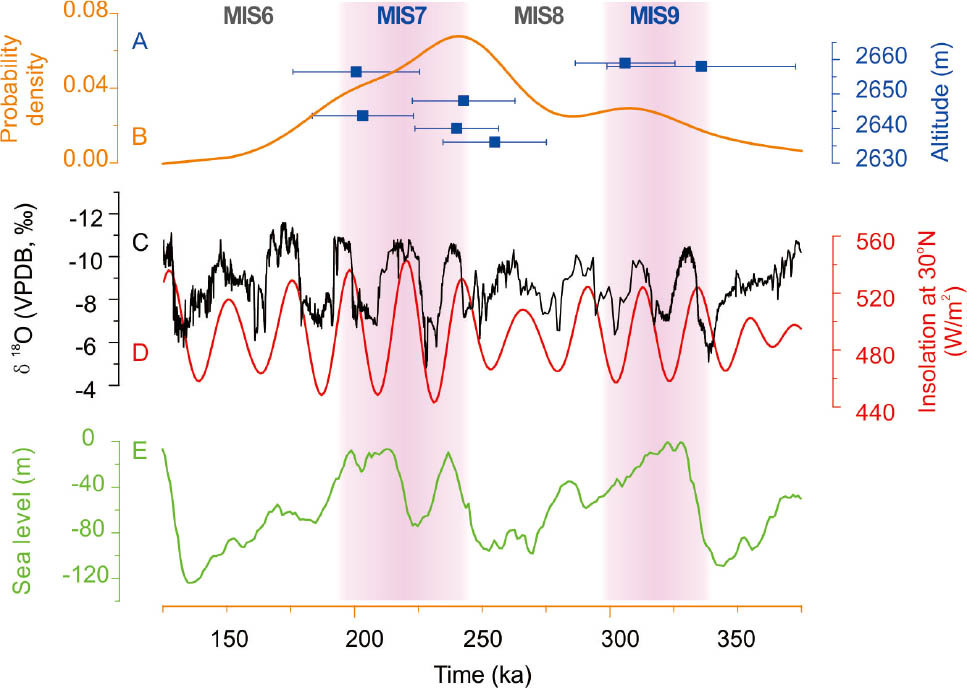
Taking into account that the previous radiocarbon ages (MIS3, Chen and Bowler, 1986; Zhang et al., 2008) and quartz OSL ages (MIS5, Lai et al., 2014) of the palaeo-lacustrine sediments are possible to be underestimated (Yu et al., 2009; Lai et al., 2014; Mischke et al., 2015; Yu et al., 2018; Buylaert et al., 2008; Chapot et al., 2012), there is no robust chronological evidence supporting the existence of mega-Qaidam paleolake since MIS6 at present. Additionally, the large-scale expansion of the Tiekui Dunefield (Fig. 1B), at the eastern end of the QB, suggested that there should be no mega lake in the QB during the most time from MIS6 to the early Holocene (Yu et al., 2019). Even during MIS5, when the climate should be relatively humid, there were still dune activities during MIS5d and MIS5b (Yu et al., 2019). Therefore, it is reasonable to infer that the mega-lake maintained till MIS7, and the severe wind-erosion and the widespread yardang formation in the QSL region started since MIS6. The eroded materials should have contributed to the expansions of the Tiekui Dunefield in the downwind direction of the QB since MIS6 (Yu et al., 2019). The mega-Qaidam Lake demonstrated a humid climate during MIS7, while the severe wind erosion of yardangs and the expansion of the Tiekui Dunefield both indicated arid and windy climate during MIS6. The comparisons among lacustrine ages (Fig. 8A-8B), δ18O records of stalagmites in Asain Summer Monsoon (ASM) influenced region (Fig. 8C, Cheng et al., 2016), summer insolation of 30°N (Fig. 8D, Berger and Loutre, 1991), and sea level changes (Fig. 8E, Spratt and Lisiecki, 2016) suggested the mega-Qaidam Lake developed under the warm and humid climate during MIS7, while the transition to arid climate might result from the retreat of ASM and strengthening of the westerlies (An et al., 2012) during MIS6. This suggested the palaeoenvironmental changes in glacial-interglacial scale in the QB, however, these limited data were not sufficient to support further discussions about the relevant mechanisms and processes, and more detailed studies are needed in future.
Fig. 8
(A) Scatter diagram of lacustrine ages against altitudes. (B) Probability density of lacustrine ages. (C) The composite δ 18O record of stalagmites (Cheng et al., 2016). (D) Insolation at 30° N (Berger and Loutre, 1991). (E) Composite sea level stack (Spratt and Lisiecki, 2016).
. CONCLUSIONS
Two main conclusions were drawn from this study: one is to find a suitable dating method, and the other is to infer the geomorphic processes based on the new ages. Methodology study suggests that the pIRIR dating is suitable for the paleo-lacustrine sediments in the QB, for both fine-grained polymineral samples and coarse-grain KF. The MET-pIRIR250 signals could be well bleached and were less affected by fading as demonstrated by a De plateau. For pIR50IR250, fading correction is necessary, but the correction method for such old samples needs further studies. Thus, the results of MET-pIRIR250 dating were used to explore the termination time of the lacustrine environment.
For the geomorphic processes of the yardang formation, the ages of ~200–340 ka from lacustrine sediment reveal that the mega-Qaidam paleolake existed during and prior to MIS7. The most recent extensive formation of yardangs in the northern QSL region might start since MIS6.