
. INTRODUCTION
The Yellow River, well-known for its tremendous sediment load, originates from the northeast of the Tibetan Plateau, and flows eastwards to the Bohai Sea. It runs across the Chinese Loess Plateau (CLP) and the east of the Ordos Plateau, resulting in the formation of a long large canyon called Jinshaan Canyon between the Shanxi (Jin) and Shaanxi (Shaan) provinces (Fig. 1). As one of the longest rivers in the world, the evolution of the Yellow River is a very interesting topic for Chinese geomorphologists. River terraces provide compelling evidence to understand the evolution history of rivers (Bridgland and Westaway, 2008; Vandenberghe, 2015). The Yellow River terraces in the Jinshaan Canyon have been widely investigated, and dated mainly using luminescence techniques and palaeomagnetic dating method (Cheng, et al., 2002; Zhang et al., 2009; Pan et al., 2011, 2012; Guo et al., 2012; Hu et al., 2012, 2016; Qiu et al., 2014; Meng et al., 2015). However, the dates of the terraces obtained are not enough to construct the precise chronology of a series of terraces in the region. This is further complicated by the fact that some terraces with the same elevations above the modern river have different formation ages because their formations are controlled by knickpoint migration (Guo et al., 2012; Qiu et al., 2014). Therefore, it is necessary to determine more Yellow River terraces in different localities of the region.
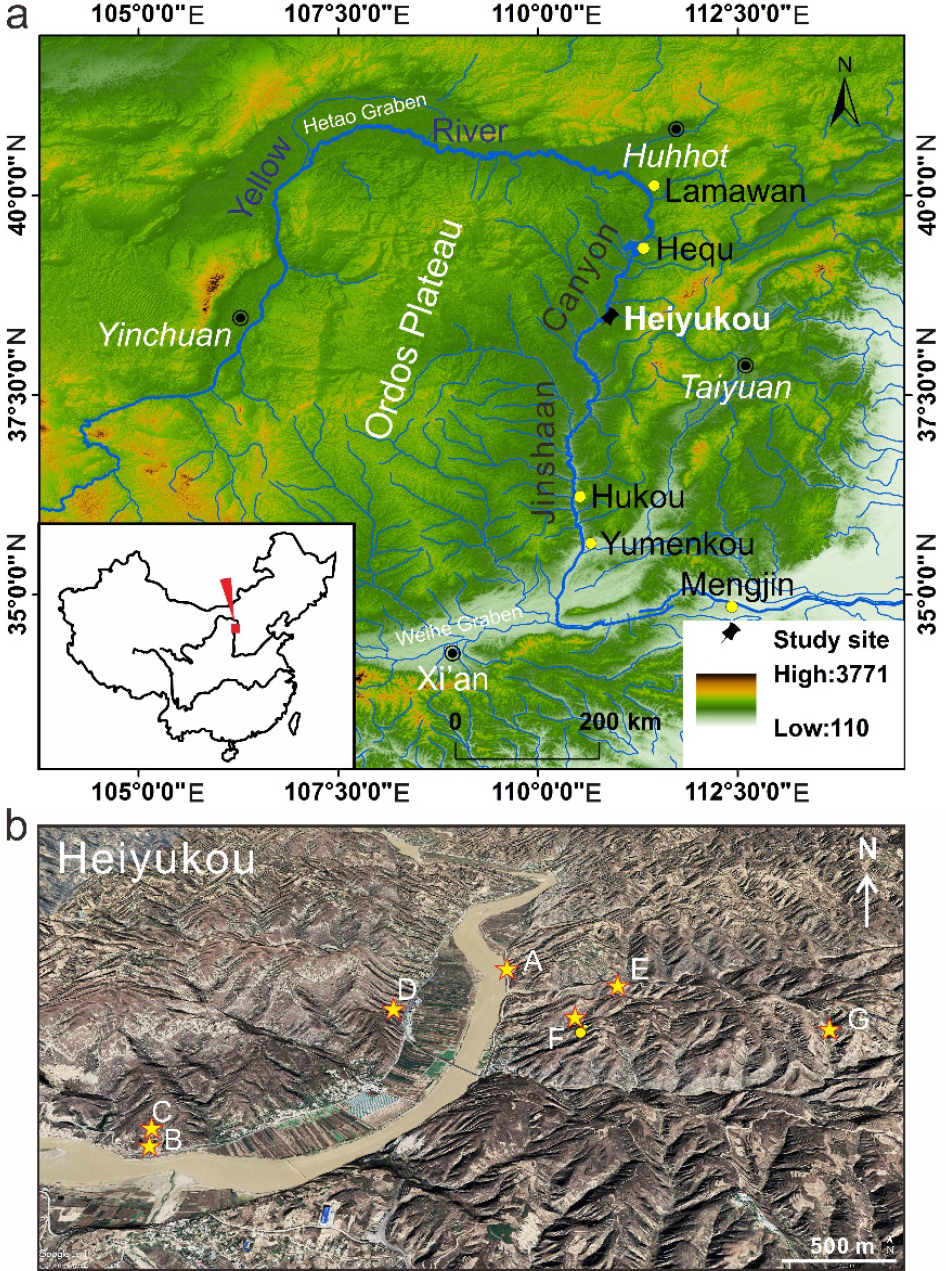
Fig. 1
(a) DEM showing the course of the Yellow River, the Ordos Plateau and the location of study area (Heiyukou) and other localities mentioned in the text, (b) Oblique Google Earth image showing the localities of the fluvial sediment exposures (sections) numbered A to G, the localities are also defined as fluvial terraces shown in Fig. 2, and the lithology and stratigraphy of the exposures are shown in Fig. 3. The pictures of Exposures A and D are also shown in Fig. 4.
The recent development of optically stimulated luminescence (OSL) dating techniques makes it possible to accurately determine the formation ages of fluvial terraces (e.g. Gong et al., 2014; Fu et al., 2016). The main advantage of OSL dating over other dating methods is that the former directly determines the burial age of the main constituents (quartz and feldspar grains) of terrace deposits. In this study, we first identified terraces in the two banks of the Yellow River in the Heiyukou area in the middle reaches of the river, and terrace deposits were systemically sampled for OSL dating. It is noted that various luminescence procedures for equivalent dose determination on quartz and feldspar from these samples were previously tested for their OSL suitability for the terrace samples, and the results have shown that the single-aliquot regenerative-dose (SAR) protocol on quartz grains are suitable (Yan et al., 2017, 2018). Thus, the quartz OSL-SAR protocol was employed in this study. The reliability of the ages was evaluated, and the terrace formation ages were ascertained.
. GEOMORPHOLOGY, TERRACES AND SAMPLING
The Yellow River flows along the northeastern and northern borders of the Ordos Plateau and cuts through the eastern plateau at an average elevation of 1000 to 1500 m above sea level (asl) from north to south. This results in the formation of the Jinshaan Canyon, which is limited to the reach from Lamawan to Yumenkou (Fig. 1). The canyon links the Weihe graben on the south of the Ordos Plateau and the Hetao graben on the north. A series of strath terraces have been developed along the banks of the canyon, and fluvial terrace deposits and terrace treads (defined as the near-horizontal top surface of fluvial deposits resting the strath) are covered by loess with various thicknesses. The loess covers make it difficult to directly identify fluvial terraces on topographic maps and satellite images, even in the field. The identification of remnants of the terraces was only conducted by observing fluvial sediments exposed in natural outcrops or road-cuts in the field.
In the Heiyukou area (38°32′36.34″N, 110°54′25.88″E) (Fig. 1a), seven sediment exposures (sections) were found and observed, and are numbered A to G (Fig. 1b). Where possible, the elevations of these exposures above the modern river channel were measured using hand-held GPS receivers with barometric altimeters (Garmin GPSmap 60CSx) and a laser rangefinder (Tru-Pulse 200X, distance accuracy: 4–30 cm), and the thickness of deposits were measured using the laser rangefinder or a tape measure. The exposures represent six terraces, numbered T2 to T7 from low to high (Fig. 2), on the basis of the elevation of the top surface (strath surface) of bedrock. The T2 terrace is paired, including the T2-E terrace on the east bank of the river and T2-W on the west bank. The lithology and stratigraphy of these terraces are demonstrated in Figs. 3, and those for two typical exposures (Sections A and B) are also shown by the photographs in Fig. 4. Here strath and fill terraces were distinguished on the basis of the thickness of fluvial channel deposits over the strath surface (Bull, 1991; Lave and Avouac, 2001; Pazzaglia and Brandon, 2001). The T2 to T6 terraces with gravel deposits less than about 7 m are defined as strath terraces (Harkins et al., 2007; Craddock et al., 2010), whereas the top terrace (T7) with a 24-m thick gravel layer is designated as fill terrace. Note that here the lowest terrace (T1) is assigned to the high floodplain close to the modern channel, where the sediments are disturbed by human activities. This terrace was not sampled for OSL dating and further investigated.
Fig. 2
Synthetic cross section of the Yellow River terrace sequence (T1 to T7) of the Heiyuhou area (see text for details), the capital letters in brackets refer to the localities of the exposures in Fig. 1b and the section numbers in Fig. 3.
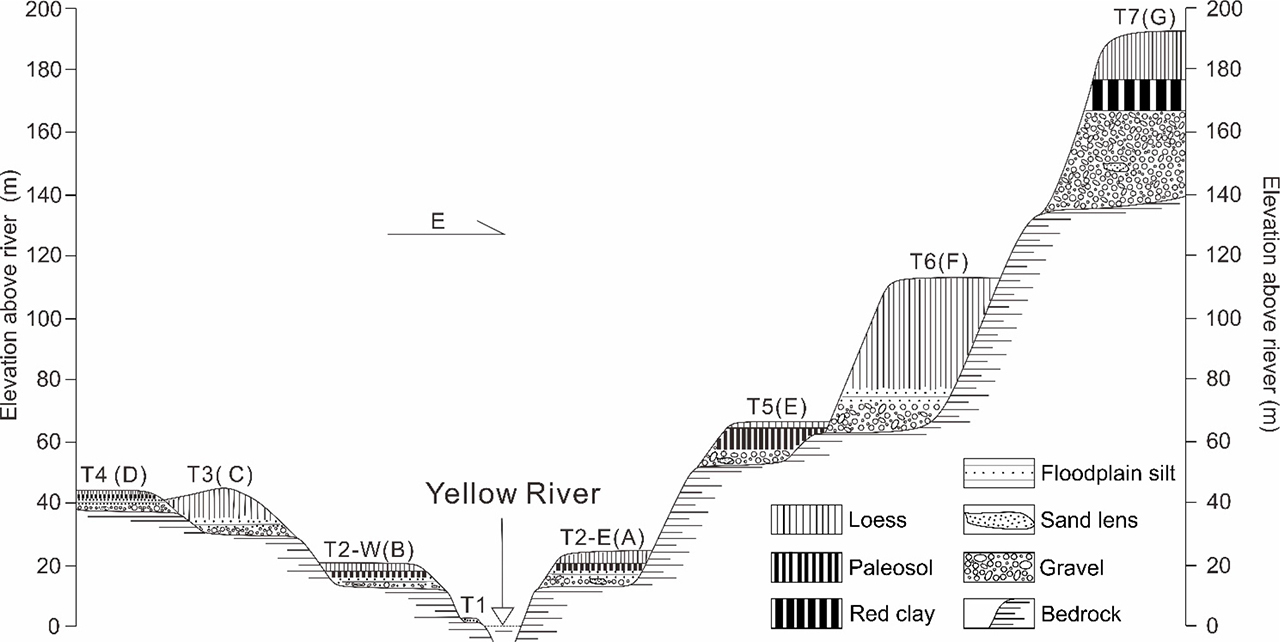
Fig. 3
Detailed stratigraphy of the Yellow River terrace deposits in the Heyukou area, the localities of the sections are marked in Fig. 1b, and the associated terraces are displayed in Fig. 2. The positions of OSL samples and the OSL ages (ka) on fine-grained quartz and coarse-grained quartz (in bold italics) are given. Sections A and B are also illustrated by the pictures in Fig. 4.
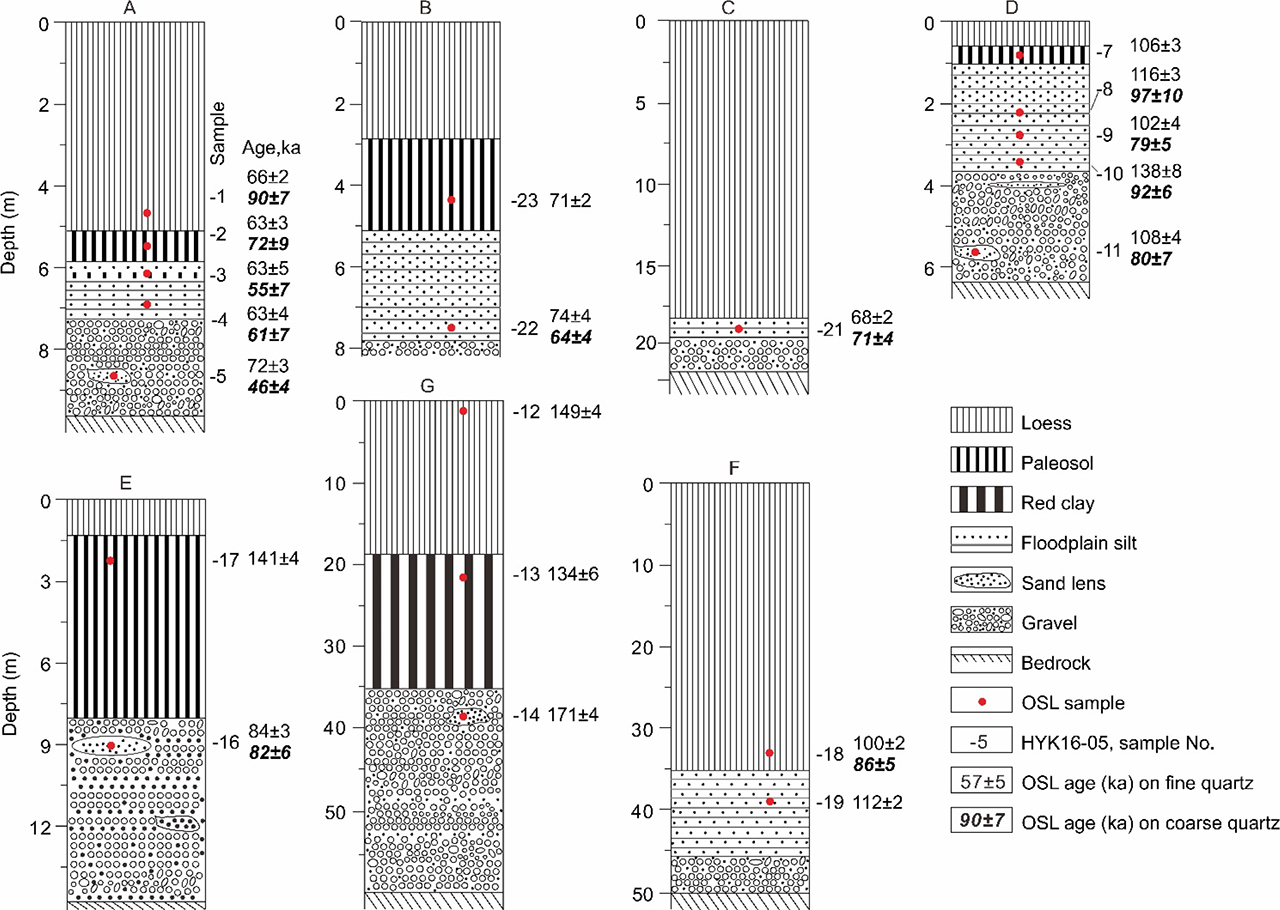
Fig. 4
Photographs looking north showing Exposures A (a and b) and D (c and d). The channel lag deposits (gravel) atop the strath surface are overlaid by floodplain silt underlaying loess/paleosol deposits. Arrows point to sampling positions, and numbers refer to the sample number (HK16-x).
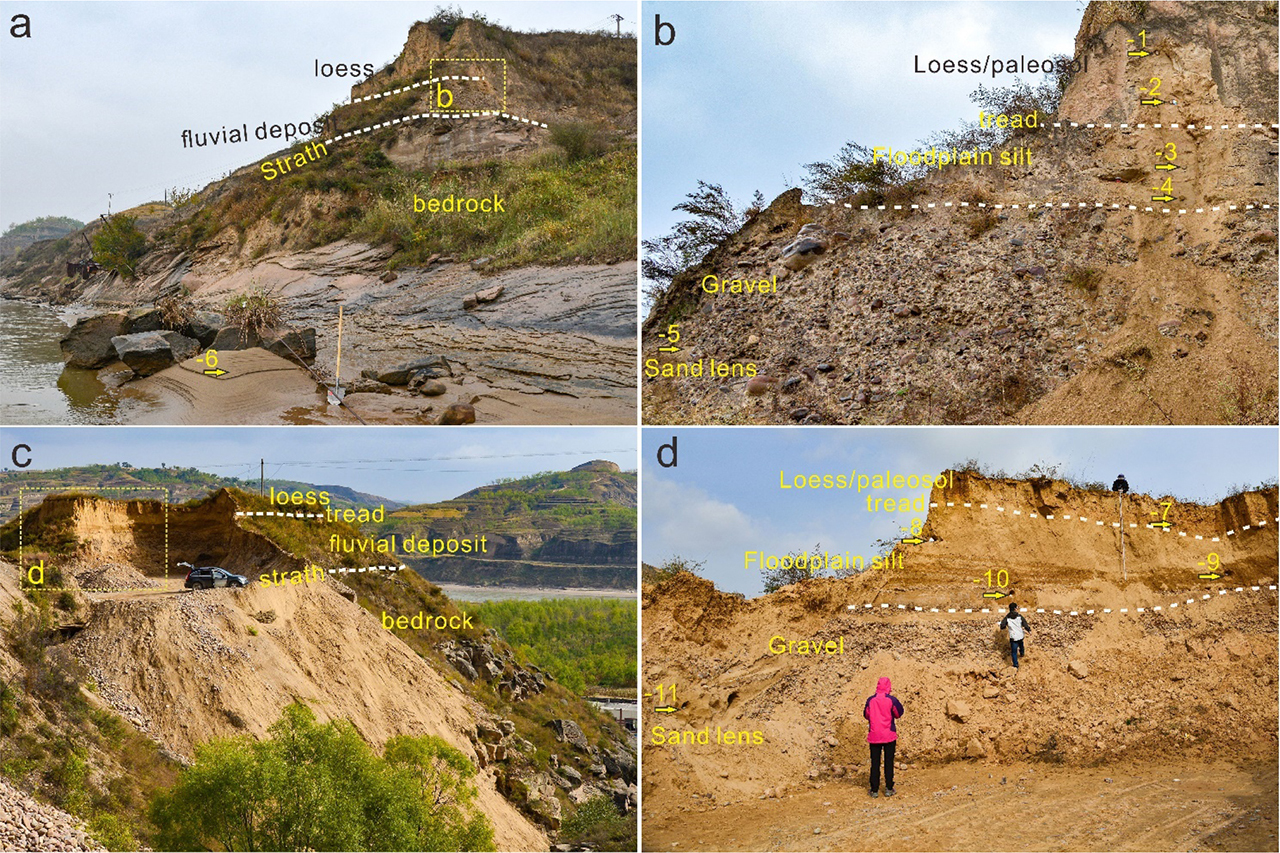
The deposits on the terraces can be divided into two units: fluvial terrace deposits between the strath and tread, and loess/palaeosol or red clay deposits overlying the fluvial deposits (Figs. 3 and 4). The terrace deposits are composed of gravels (channel facies) and floodplain silts (overbank facies). The clast-supported gravels were found directly overlying bedrock for the exposures except for Section B where the contact between gravel layer and bedrock was not directly observed, and the gravels from all sections have similar sedimentary characteristics. The gravels have a maximum diameter of 30 mm, and moderate to high sphericity and are well rounded. Crude imbrication is observed locally in cobbles. The gravels mainly consist of reddish-purple sandstone (∼59%) and limestone (∼36%), and the thickness of the gravel layers ranges from 0.2 to about 24 m. Within the gravel layers, some sand lenses were seen and sampled for OSL dating. It is noted that the thickness of the sand lenses is more than 60 cm except for that of Section A, for which the gamma contribution to the dose rate from the gravels was evaluated using the model described by Aitken (1985: appendix H) (Yan et al., 2018). The floodplain silts overlying gravel layers are characterised by thin horizontal bedding. The silt layer in Section A is interbedded with a weakly developed palaeosol layer with a typical soil aggregate structure without horizontal bedding. The thickness of the silt layers varies from 0 (Section E) to 2.8 m (Section B). All the silt layers are capped by loess/palaeosol deposits characterised by massive structure and vertical joints. The top loesses are Malan Loess (Liu, 1985) deposited between 73 and 11 ka (Ding et al., 2002). Note that the loess deposits on the T3 terrace is much thicker than on the T4 terrace, resulting in the higher elevation of the top loess on the T3 terrace than on the T4 terrace (Fig. 2). On the highest terrace (T7), the Red-Clay deposits were found between the top loess and fluvial sandy gravels resting on bedrock. The bedrock mainly comprises Triassic sandstone with horizontal bedding, and the surface of bedrock is loose because of weathering.
As shown in Fig. 3, the sedimentary sections were systematically sampled for OSL dating. The OSL ages of the samples from sand lenses within the gravel layers are regarded to be very close to the formation ages of the terraces. Other samples are from floodplain silt layers and the overlying loess/palaeosol deposits. The systematic sampling helps us to evaluate the reliability of OSL ages obtained for the terraces. Twenty samples were collected from the sections by horizontally hammering 3.5-cm diameter and 30-cm long stainless-steel tubes into the cleaned section face, the details of the samples are shown in Table 1 and displayed in Fig. 3. The tubes were wrapped with aluminium foil and adhesive tape in order to prevent further exposure to light and moisture loss. Additionally, a modern fluvial sample (HYK16-6) was also taken for examining the degree of bleaching for our fluvial samples. Note that the high terraces were also sampled to check the upper age limit of luminescence dating for our samples. This is because the pre-Quaternary Red-Clay deposits (Ding et al., 1998; Zhu et al., 2008) can be considered as “infinitely old” samples for luminescence dating.
Table 1
Results of optical dating of terrace samples from the Yellow River in the Heyoukou area.
* Note that the results of samples HYK16-1 to -6 have been published by Yan et al. (2018), here they are listed for comparison.
. EXPERIMENTAL DETAILS
Luminescence measurements
Sample preparation was conducted in a dark room with a dim red light. The fine quartz grains were first extracted using the procedure in our laboratory (Zhang and Zhou, 2007), and the portions of >11 μm were used for extracting coarse-grained quartz (Zhang et al., 2003). The samples from the interior of the tubes were treated with dilute HCl to dissolve carbonates and 10% H2O2 to remove organic material, respectively. The fine-grained (FG, 4–11 μm) fractions were then obtained using Stokes’ law after it was deflocculated using a dilute sodium oxalate solution, and the coarse-grained (CG) fractions were extracted by wet sieving. The FG polymineral fractions were chemically purified using silica-saturated fluorosilicic acid (H2SiF6) at room temperature to dissolve feldspars to obtain fine quartz grains, and the CG fractions were etched using 40% hydrofluoric acid (HF) for 40 min to remove feldspar contaminants and the outer layer of quartz grains to obtain coarse quartz grains. Treatment with dilute hydrochloric acid followed is performed to remove any fluorides produced. The purity of the quartz extracts was examined by IR stimulation. Small aliquots (∼2 mm in diameter) were prepared by mounting the coarse grains in a monolayer on the aluminium discs (9.7 mm in diameter) using silicone oil, and FG quartz aliquots were made by settling the fine grains in acetone solution onto the aluminium discs. Note that only fine grains for some samples could be extracted (Table 1).
In order to find suitable luminescence procedures on quartz and feldspar grains from these samples, the samples (HYK16-1 to -5) from Section A and the modern sample (HYK16-6) (Figs. 3A and 4) had been investigated for their luminescence properties, and dated using various luminescence procedures (Yan et al., 2017, 2018), including a single-aliquot regenerative-dose (SAR) protocol (Murray and Wintle, 2003) on FG and CG quartz, thermally transferred OSL (TT-OSL) SAR procedure (Wang et al., 2006, 2007) on quartz grains from the modern sample, and a multiple-elevated-temperature post-IR IRSL (MET-pIRIR) procedure on CG K-feldspar (Li and Li, 2011, Li et al., 2013). The results of preheat plateau and dose recovery tests demonstrate that the preheat of 220°C for 10 s in the OSL-SAR procedure is suitable for our quartz extracts. The FG quartz exhibited a more rapid decay for the OSL curve, higher saturation dose (>2000 Gy), and more thermal stability than CG quartz. The modern sample yielded different De values: 384 ± 8Gy (TT-OSL SAR for CG quartz), 1.9±0.5 Gy (OSL-SAR for CG quartz), 99.5 ± 9.6 Gy (OSL-SAR for FG quartz), 409 ± 99 Gy (MET-pIRIR for CG K-feldspar), implying that the TT-OSL signals from CG quartz, SAR-OSL signals from FG quartz and MET-pIRIR signals from K-feldspar were very poorly bleached at deposition, whereas the SAROSL signal from CG quartz was well bleached. The five samples from the section produced the SAR-OSL ages of 46–90 and 63–72 ka on coarse and fine quartz grains, respectively (Table 1, Fig. 3A), and the MET-pIRIR age of 106–148 ka for coarse K-feldspar grains. The K-feldspar MET-pIRIR ages are much higher than the quartz OSL ages. Furthermore, the Malan Loess sample (HYK16-1) yielded the MET-pIRIR age of 130 ± 18 ka that is much larger than the age range (11–73 ka) for the Malan Loess in the Chinese Loess Plateau (Liu, 1985; Ding et al., 2002), implying that the MET-pIRIR ages were overestimated, while the SAR-OSL ages on FG quartz are within the age range for the Malan Loess. Therefore, we concluded that the SAR procedure is suitable for our samples and used to determine the De values for the fine and coarse quartz grains of the samples from the other terraces. It is noted that an IR stimulation at room temperature before each OSL measurement in the procedure was applied (Banerjee et al., 2001; Roberts and Wintle, 2001; Zhang and Zhou, 2007) to completely remove the effect of feldspar contaminating on quartz De values, although IRSL signals from the quartz fractions were negligible.
All luminescence measurements were carried out using an automated Risø TL/OSL-DA-15 reader equipped with a 90Sr/90Y beta source (Bøtter-Jensen et al., 2003). Quartz OSL was detected using a Hoya U-340 filter (290–370 nm) and blue (λ = 470 ± 30 nm) diodes for stimulation. The emitted luminescence was detected by an EMI 9235QA photomultiplier tube.
Dose rate determination
The U, Th and K contents of the samples were analysed using neutron-activation-analysis (NAA). The water contents are assumed to be 5 ± 1% for sand samples, and 10 ± 2% loess and floodplain silt and 20 ± 4% for palaeosol samples, respectively. This is because the sampled sections have been exposed to air for a long time before sampling, and the sediments near the surface were partly dried up. The alpha efficiency factor (a-value) of 0.038 ± 0.003 (Rees-Jones, 1995) was used for the FG quartz. Based on the above measurements, the dose rates and ages were calculated using the online dose rate and age calculator DRAC v1.2 (Durcan et al., 2015), in which cosmic ray contribution and conversion factors are involved.
. RESULTS
Examples of OSL decay curves and dose-response curves (DRC) for the FG quartz aliquots of the samples from the T2 to T7 terraces are shown in Fig. 5. The decay curves demonstrate that the quartz OSL signals are easily bleached and dominated by the fast component. The dose response curves are well fitted with double saturating exponential functions. The recycling ratios are close to unity, and the recuperation values are less than 0.5%. The DRCs for all the samples are very similar, and the natural signals are not close to saturation. The average De values of both FG and CG quartz fractions are listed in Table 1, they vary from 199 to 545 Gy for fine grains, and 124 to 254 Gy for coarse grains. Examples of the distributions of the CG quartz De values for the samples from Section D are shown in Fig. 6. The over-dispersion (OD) values of the CG quartz De distributions calculated using the central age model (Galbraith et al., 1999) listed in Table 1 vary between 23% and 53%. The large OD values may be due to the different luminescence properties among grains, not poor bleaching at deposition (discussed below).
Fig. 5
Dose response curves for the fine quartz OSL signals from six samples from the T2–T7 terraces, and insets show their natural OSL shine-down curves. The solid circles represent the sensitivity-corrected natural signals (Lx/Tx). The curves were fitted using a double saturating exponential function of the form y=a(1-exp(-bx)) + c(1-exp(-dx).
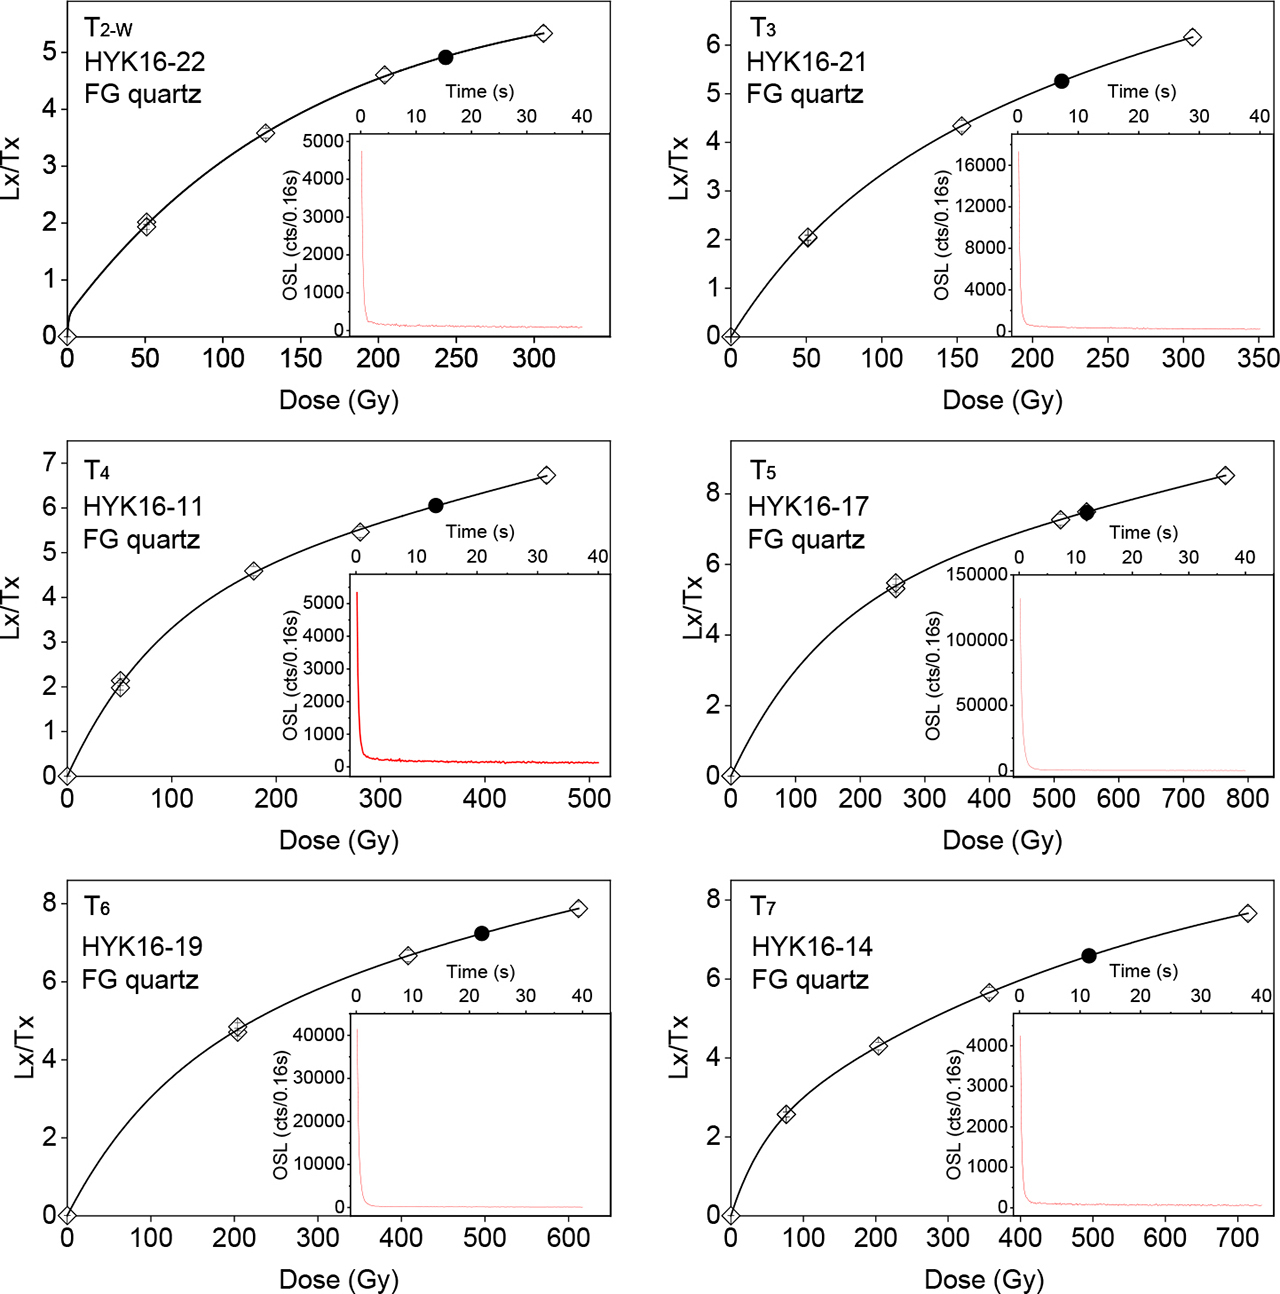
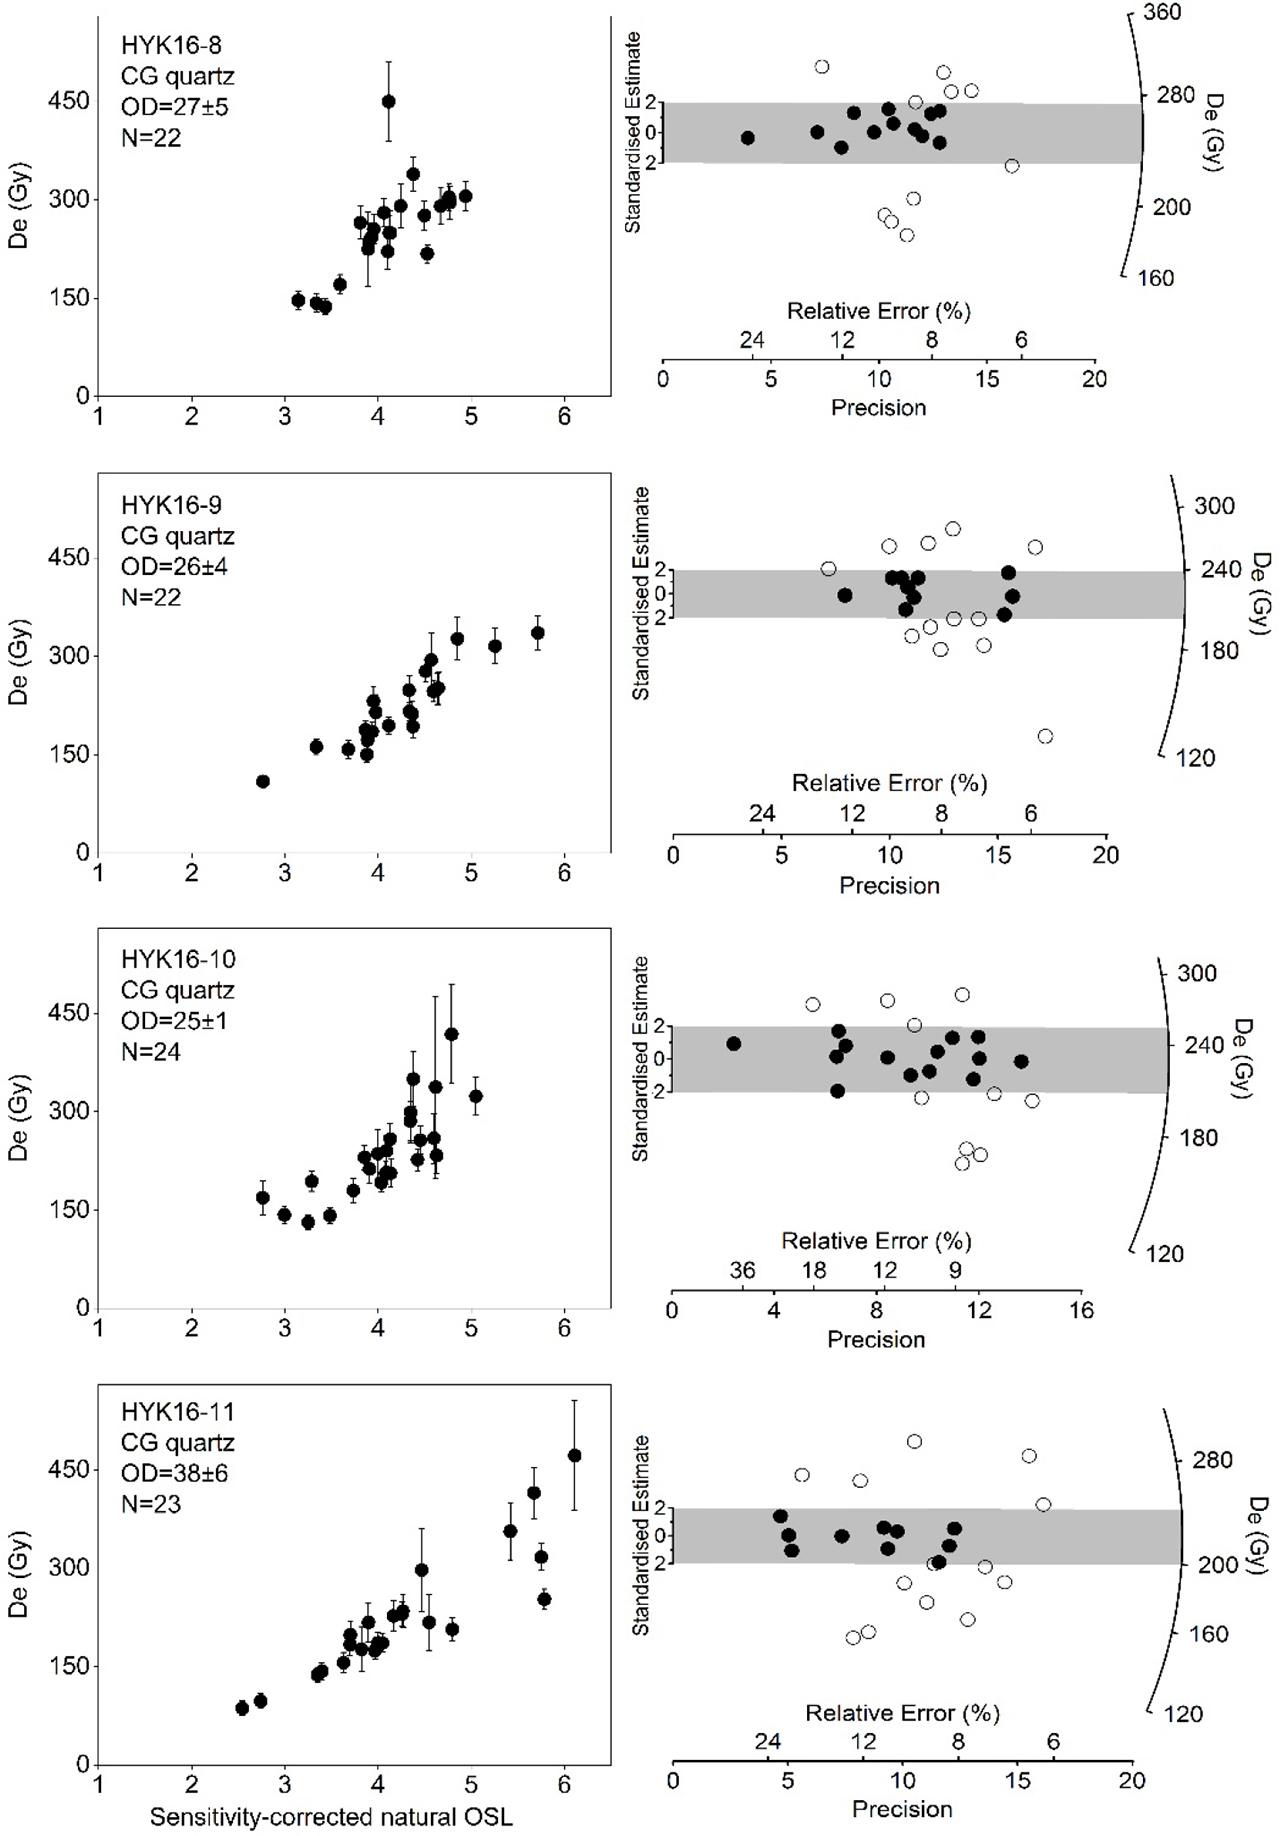
Fig. 6
Distributions of De values for the coarse-grained quartz fractions of the samples from Section D in the T4 terrace. Left column: plots of De value as a function of sensitivity-corrected natural OSL signals; Right column: radial plots of De values, the same data as shown in the left column are demonstrated as radial plots (Galbraith et al., 1999). The right-hand y-axis refers to De values, and the x-axis shows the precision of the individual De values. The shaded regions include all aliquots (solid circles) within 2σ errors, and open circles represent aliquots that fall outside the region.
The dating results are summarised and presented in Table 1, and the ages are also displayed in Fig. 3. The five samples from Section A for the T2-E terrace yielded ages of 46–90 ka for CG quartz, and 63–70 ka for FG quartz, the FG quartz OSL ages are in stratigraphic order, but this is not the case for CG quartz. The two samples from Section B for the T2-W terrace were dated to 74 ± 4 and 71 ± 2 ka using FG quartz, and 61 ± 4 ka using CG quartz, respectively. The sample from the floodplain silt layer in Section C for the T3 terrace produced an age of 74 ± 4 ka using CG quartz and 68 ± 2 ka using FG. For the T4 terrace, five samples from Section D yielded 79–97 ka for CG quartz and 102–138 ka for FG quartz, the OSL ages for CG quartz are smaller than for FG quartz. For the T5 terrace, the sand sample from Section E was dated to 84 ± 3 ka using FG quartz and 82 ± 6 ka using CG quartz, which is smaller than the age of 141 ± 4 ka using FG quartz of the overlying palaeosol sample (HYK16-17). The floodplain silt sample from Section F for the T6 terrace produced an age of 112 ± 2 ka using FG quartz, and the overlying loess sample was dated to 100 ± 2 ka using FG quartz and 86 ± 5 ka using CG quartz. The three samples from the highest terrace (T7, Section G) yielded the ages of 134–171 ka using FG quartz. Note that the modern sample produced apparent ages of 52.1 ± 5.4 ka using FG quartz and 1.1 ± 0.3 ka using CG quartz, respectively (Yan et al., 2018).
. DISCUSSION
Reliability of quartz OSL ages
The degree of bleaching of fluvial sediment samples are generally evaluated by the OD values of their single-grain or aliquot De distributions. The CG quartz fractions of the eleven fluvial samples in this study have the OD values ranging from 23 to 48%, which are much higher than the global average value of 9 ± 3% published for well-bleached large-sized aliquots (Arnold et al., 2008). This implies that these coarse quartz grains were very poorly bleached at deposition. However, this may not be the case. The OD values for the fluvial samples are similar to those (24–53%) for the coarse quartz grains from the loess/palaeosol samples that are generally considered to be well bleached before burial. The large OD values may be caused by the variations in intrinsic brightness among the individual aliquots and the large De values of the samples (Duller, 2008; Thomsen et al., 2012; Reimann et al., 2012; Fu et al., 2017; Rui et al., 2019). The difference in luminescence properties between grains may be attributed to the different sources of the sediments associated with the Yellow River (Xu et al., 2006; Hu et al., 2010; Zhang et al., 2010, 2011). Some CG grains should be from the local weathered sandstone bedrock, resulting in their different sensitivities (Sawakuchi et al., 2018). The modern fluvial sample (HYK16-6) in this study yielded a De value of 1.9 ± 0.5 Gy for course quartz grains with an OD value of 91 ± 23%; this large OD value should be attributed to the dim signals of the sample. The small residual dose of the coarse quartz grains from this modern sample is supported by the doses of the modern fluvial samples from other localities in the Yellow River (Fig. 7, Zhang et al., 2009; Hu et al., 2010), and can be negligible compared with the De values of the terrace samples in this study, implying that the coarse quartz grains were relatively well bleached at the time of deposition. However, the situation for fine quartz grains is more complex. It is obvious that the FG quartz fraction of the modern sample in this study was not well bleached at deposition, indicated by a residual De value of 99.5 ± 9.6 Gy, corresponding an age of 52.1 ± 5.4 ka. The poor bleaching of fine quartz grains were also found for the hyperconcentrated flow sediments interbedded in loess deposits on the Yellow River terrace in the Hukou area (Zhang et al., 2010). However, five modern analogue samples from the river in our previous studies have the residual De values from 1.6 to 7.7 Gy, with an average of 3.6 ± 1.1 Gy for fine-grained quartz (Fig. 7, Hu et al., 2010). This implies that the bleaching histories of fine quartz grains for our samples should be evaluated on a case-by-case basis.
Fig. 7
Comparison of fine-grained and coarse-grained quartz SAR-OSL ages for the samples from the Yellow River terraces and modern analogue samples. The circles, diamonds, squares and triangles refer to channel sands, floodplain silts, overlying loess/palaeosol deposits and modern fluvial samples, respectively. The solid dots indicate the data in this study, and the open dots are the published data for the Hukou area (Zhang et al, 2010, 2011; Hu et al., 2010; Guo et al., 2012). For comparison, the residual De values in Hu et al. (2010) were converted to ages in ka using the dose rates of 1.71 ± 0.07 Gy/ka for coarse grains and 1.91 ± 0.07 Gy/ka for fine grains of the modern sample (HYK16-6) in this study. Error bars represent 1 standard deviation of the mean; where not visible, they are smaller than the size of the data points.
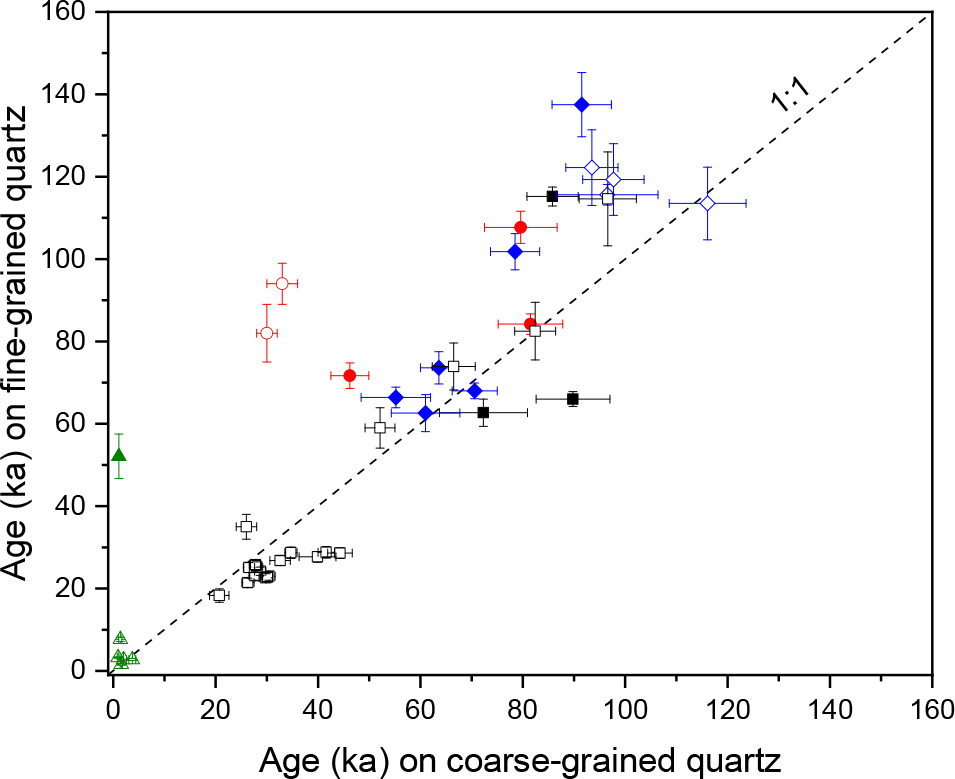
The OSL ages on fine and coarse quartz grains are compared in Fig. 7, in which the previously published data for terrace deposits in the Hukou area, ∼300 km downstream from this study area (Zhang et al., 2010, 2011; Guo et al. 2012) are also displayed for comparison. Generally, the SAR-OSL ages on coarse quartz grains from the floodplain (diamonds in Fig. 7) and channel (circles) deposits are smaller than or comparable to those on fine quartz grains. This difference may be attributed to the different degrees of bleaching of the fine and coarse grains at the time of deposition, as demonstrated by the residual doses of the fine and coarse grains from the modern fluvial samples in this study and Hu et al. (2010). Based on the comparison, it appears that the quartz OSL ages on coarse quartz grains are more reliable than on fine quartz for these fluvial sediments. This is the case for the hyperconcentrated flow deposits on a Yellow River terrace (Zhang et al., 2010). However, the actual situation may be much more complex when considering the age distributions of the samples from a section (Avni et al., 2010; Hu et al., 2015). For example, the age of 72 ± 3 ka using FG quartz of sample HK16-5 from Section A is considered to be more reliable than the age of 46 ± 4 ka using CG quartz, based on the law of superposition (Fig. 3, Yan et al., 2018). Most of the loess samples yielded larger OSL ages (squares in Fig. 7) for CG quartz than for FG quartz; this is similar to those for loess deposits in other regions (Timar-Gabor et al., 2017). Here for the loess samples from the Longwangchan site on the river terrace in the Hukou area (Zhang et al., 2011), the FG quartz ages are considered to be reliable based on the comparison with the radiocarbon ages of charcoal samples from the site.
The internal stratigraphic consistency of OSL ages obtained are usually used to evaluate their potential validity, stratigraphically consistent ages may be valid (Rhodes et al., 2006). For Section A, the CG quartz OSL age of the bottom sample (HYK16-5) from the gravel layer is much younger than that of the top loess sample (HYK16-01) (Fig. 3), the CG quartz ages for this section are generally not in stratigraphic order. The FG quartz ages of the five samples from the different sedimentary units of the section are statistically consistent, implying that the OSL ages on fine quartz are generally more reliable than on coarse quartz for this section. We deduce that the fine grains from the fluvial sediments were relatively well bleached at deposition, and their residual doses are negligible, which is different from the modern sample (HYK16-06) in this study.
For Section D, the OSL ages on FG quartz for the five samples are statistically consistent except for sample HYK16-10 (Fig. 3). The floodplain sample (HYK16-10) yielded an FG quartz OSL age of 138 ± 8 ka which is much larger than those of the overlying and underlying samples, the fine grains from his sample are deduced to be poor bleaching at deposition compared to the other fluvial samples. The OSL ages on CG quartz for the four fluvial samples are roughly consistent and are systematically smaller than those on FG quartz. This difference cannot be explained by poor bleaching of the fine grains, because the overlying well-bleached palaeosol sample (HYK16-7) yielded a similar FG quartz age to the underlying fluvial samples (HYK16-8, 9 and 11). Additionally, the formation of higher strath terraces should be geomorphologically older than that of lower terraces; this means that the CG quartz ages for Section D were underestimated, demonstrated by the comparison of the CG quartz ages with the formation age of the lower T2 terrace (Sections A and B). Based on the above discussion, we concluded that the SAR-OSL ages on fine quartz should be more reliable for our studied samples, and the following discussion is only based on the FG quartz ages.
As shown in Table 1, most of the samples have De values >200 Gy. The reliability of the De values obtained in the high dose region of DRCs has been debated (Murray et al., 2008; Lai, 2010; Lowcik et al., 2015; Zhang et al., 2015; Timar-Gabor et al., 2017; Buechi et al., 2017). For practical purposes, the 2·D0 value (characteristic saturation dose) of a dose response curve fitted with a single saturating exponential function is usually used for the criterion to evaluate the upper limit for precise age determination (Wintle and Murray, 2006; Buechi et al., 2017). However, the D0 value has been found to be varied with the size of the maximum regeneration dose (Buechi et al., 2017), this is also the case for D01 and D02, when a double saturating exponential function is applied (Anechitei-Deacu et al., 2018). In this study, the dose response curves for fine grains from all samples in Fig. 5 show that the samples are not saturated, even for the pre-Quaternary Red-Clay sample (HYK16-13) from Section G for the T7 terrace. The Red Clay in the Chinese Loess Plateau has been considered to be accumulated before the Quaternary (Ding et al., 1998; Zhu et al., 2008), suggesting that the Red-Clay sample and the underlying fluvial sand sample (HYK16-14) can be regarded as “infinitely old” samples that were OSL dated to 134 ± 6 and 171 ± 4 ka using FG quartz, respectively. The OSL age of the Red-Clay sample was even smaller than the age (149 ± 4 ka) of the overlying loess sample (HKU16-12). It is obvious that the OSL ages of the “infinitely old” samples were significantly underestimated, implying that the criteria of De <2·D0 (Wintle and Murray, 2006) is not suitable for these “infinitely old” samples, as also demonstrated by Lowick and Valla (2018) for the bedrock samples. On the other hand, the apparent OSL ages of the “infinitely old” sample may be regarded as the upper age limit of luminescence dating for the studied samples; this needs further investigation.
Terrace ages and implication for the terrace incision and the uplift of the Ordos Plateau
Here terrace ages refer to the age of strath formation, which are usually determined by directly dating the over-lying terrace deposits that must be accumulated immediately after or simultaneous to strath cutting. If the terrace deposits are thick (fill terrace), ages obtained for the strath formation may be underestimated. For Sections A, B, D and F (Fig. 3), the OSL ages of the channel sand and the overlying floodplain samples are indistinguishable, and similar to the ages of the top loess/palaeosol samples. This indicates rapid deposition of the fluvial sediments, and dust accumulated on the terraces once they were abandoned and river incision began. The depositional intervals are masked by dating errors. This phenomenon was also reported for terrace deposits in the Hukou area (Guo et al., 2012). On the other hand, the similar ages imply that all these ages are close to the true formation ages of the terraces.
Based on the above discussion and associated considerations, we attempt to deduce the formation ages of the studied terraces. For the paired T2 terrace (T2-E and T2-W), seven samples from Sections A and B were dated. As shown in Table 1 and Fig. 3, the ages obtained for the two sections are similar, except for two dates as discussed above. Sample HYK16-5 from a sand lens within gravel deposits in Section A is closest to the strath surface. Thus, the FG quartz age of 72 ± 3 ka for this sample was regarded as the formation age of this terrace. For the T3 terrace, only one sample from Section C was dated and produced the statistically consistent ages of 68 ± 2 ka using FG quartz and 71 ± 4 ka using CG quartz, respectively. Compared with the age of the T2 terrace, the ages of the sample from the T3 terrace appears to be underestimated, analyses of more samples are needed. The T4 terrace was dated using five samples from Section D (Figs. 3 and 4). As discussed above, the FG quartz OSL ages were considered to be more reliable than the CG quartz OSL ages. The FG OSL age of 108 ± 4 ka for sample HYK16-11 from a sand lens within the gravel layer was assigned to the formation age of this terrace. For the T5 terrace (Section E), the OSL ages of 82 ± 6 on CG quartz and 84 ± 3 on FG quartz for the fluvial sand sample (HYK16-16) were clearly underestimated, indicated by the comparison with the age of overlying palaeosol sample (141 ± 4 ka for FG quartz) and the age value of 108 ± 4 ka for the T4 terrace. The age value of 141 ± 4 ka of the palaeosol sample can be regarded as the minimum age of the T5 terrace formation. For the T6 terrace, the floodplain silt sample (HYK16-19) and the overlying loess sample (HYK16-18) from Section F yielded the ages of 112 ± 2 and 100 ± 2 on FG quartz and 86 ± 5 ka on CG quartz, respectively, which are smaller than the age of the T5 terrace. Hence, we concluded that the OSL ages for this terrace are significantly underestimated. This is particularly the case for the fluvial and Red-Clay deposits from the T7 terrace (Section G), although the fluvial sample yielded an age of up to 171 ± 4 ka, as discussed above.
The formation ages of the T2 and T4 terraces are compared with the marine oxygen-isotope stage (MIS) in Fig. 8. Note that the T5 age in the figure refers to the minimum formation age of the terrace. It can be seen that the T2 terrace occurred at the transition from the warm MIS5 to the cold MIS4, the T4 terrace was formed during climate transitions from warm to cold and then to warm within MIS5. As pointed out by Vandenberghe (1995), any climate change (from warm to cold or from cold to warm) can result in river incision, which induces terrace formation in stable and constantly uplifting areas (Ruszkiczay-Rüdiger et al., 2005). Therefore, we induced that for these two terraces, the joint effect of the two driving forces (tectonics and climate) is responsible for the terrace formation.
Fig. 8
(a) Plot of terrace heights above modern river against terrace ages. The long-term incision rates derived from the T2, T4 and T5 terraces were calculated. Note that the T3, T6 and T7 terraces are not displayed because the OSL ages of the samples from these terrace are not valid(see text for details), and the calculated incision rate for the T5 terrace is maximum due to its minimum age. Stacked δ18O record of benthic foraminifera is from Lisiecki and Raymo (2005), and the marine oxygen isotope stages are displayed.
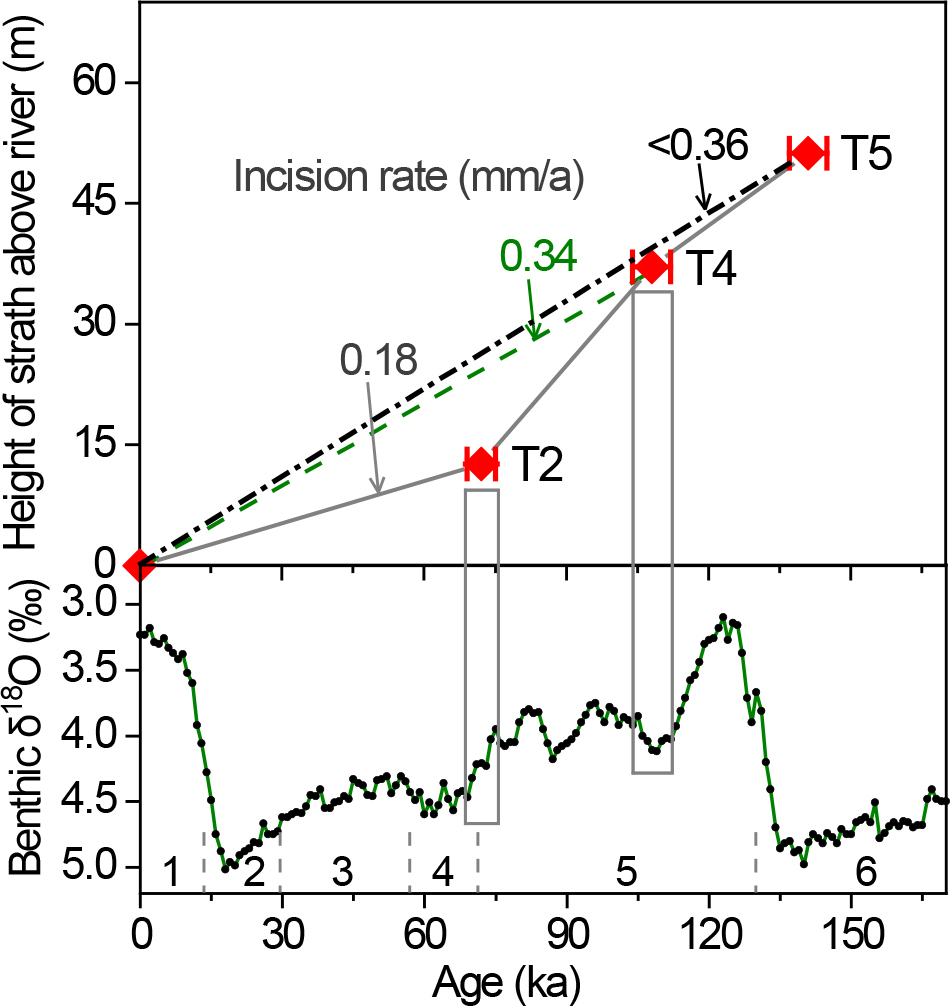
Based on the terrace ages and the elevation of the bedrock strath surface above the modern channel, the long-term incision rates of the river were calculated to be <0.36, 0.34 and 0.18 mm/a for at least the past 141 ka (T5), 108 ka (T4) and 72 ka (T2), respectively. This indicates that the incision rate generally decreases through time, similar to the situation in the Hukou area, where the river incision rates in the past 116, 84 and 29 ka are respectively 0.52, 0.44 and, 0.31 mm/a (Zhang et al., 2011; Guo et al., 2012). It can be seen that the river incision rates obtained from the terraces in the two areas can be comparable. The Yellow River incision rates obtained in this study is slightly smaller than those in the Hukou area. This can be explained by the fact that the Hukou area is close to the normal Hancheng Fault, and knickpoints such as the Hukou Waterfall propagated upstream from the fault. These result in the relatively larger incision rates in the Hukou area than in the study area, ∼350 km upstream from the fault. River incision rates can also be used as a proxy for uplift rate (e.g. Merritts et al., 1994; Cunha et al., 2008). The Ordos plateau, an uplifted basin, behaves as a rigid block (Fig. 1a) (e.g. Chen et al., 2011; Bao et al., 2011). Therefore, the incision rates derived from the terraces represent the uplift rates of the block. The similar changes in Yellow River incision rates over time in the Heyoukou and Hukou areas reflect the uplift of the plateau as a block.
. CONCLUSIONS
Seven Yellow River terraces (T1–T7) in the Heiyukou area were identified, including one fill terrace (T7) and five strath terraces (T2–T6). The deposits on the terraces consist of the channel, overbank and overlying loess facies. Twenty samples from these terraces and one modern fluvial sample were optically dated using fine- and coarse-grained quartz fractions. The fine and coarse quartz grains demonstrated different luminescence behaviours. The reliability of the ages obtained for the samples is evaluated based on bleachability, comparison of OSL ages on fine and coarse grains, stratigraphic consistency and geomorphological setting. The paired T2 terrace was dated to 72 ± 3 ka, and the formation ages of the T4, T5 terraces are 108 ± 3 and >141 ± 4 ka, respectively. The deposits on the T6 and T7 terraces are beyond the age range of luminescence dating, and the age determination of the T3 terrace needs more samples. Based on the ages and elevation above the modern river of the T2, T4 and T5 terraces, the long-term incision rates were calculated to be <0.36, 0.34 and 0.18 mm/a for at least the past 141, 108 and 72 ka, respectively, they also represent the uplift rates of the Ordos plateau.