
. INTRODUCTION
A thrust-and-fold belt is located on the northern piedmont of Chinese Tianshan Mountain, and it is featured by rows of emerging fault-related folds with the west-east strike (Avouac et al., 1993; Deng et al., 2000). One of these folds is the Anjihai anticline, which is located on the most northern deforming front (Fig. 1a). The sandy bed (Fig. 1b) at the bottom of the outcrop on its eastern tip of Anjihai anticline is supposed to be early Pleistocene fluvial sediments and is southward tilted by 5° (Deng et al., 2000, 2013). Since the Jingou River, which cuts across the Anjihai anticline, flows northward, the observed tilting to the south would be attributed to the rotation of the sandy bed due to anticline growth. Therefore, the angle of such a rotation is 5° at least. However, it is a lack of depositional ages for the sandy bed. If the depositional age is determined, the pattern and rate of anticline growth could be constrained in combination with the rotation angle (Li et al., 2013b). Such constraints are critical for evaluating the seismic hazard of the cities nearby since the deformation rate would be higher than previously thought if its depositional age is not as old as early Pleistocene.
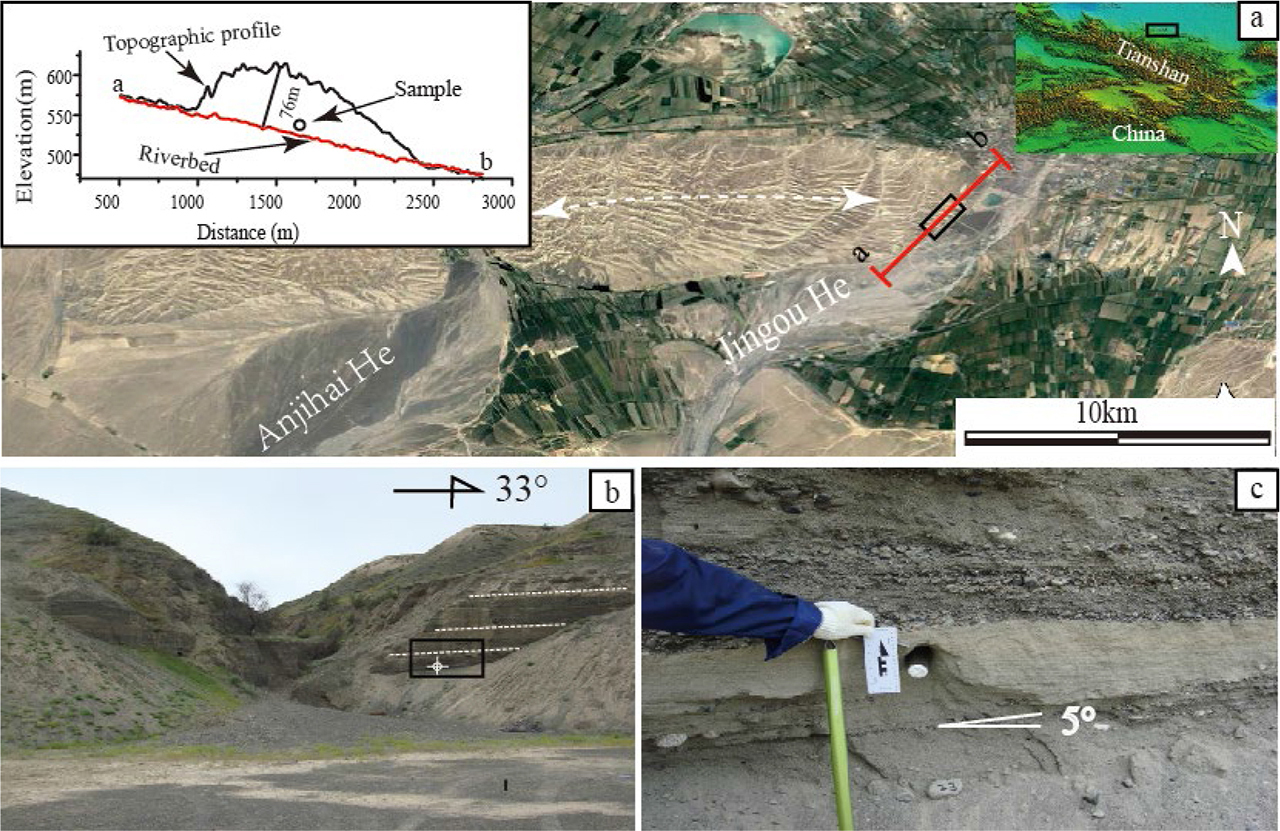
Fig. 1
Sampling site at the eastern tip of Anjihai anticline and the lithology. a) Google Earth image of the Anjihai anticline. The black square marks the location of the strata for sampling. The inset is a topographic profile of the eastern tip Anjihai anticline with the sample location; photos shown in b) and c) are the close look of the sampling site and strata.
Luminescence dating technique is of potential to constrain the depositional age of these deformed strata. The post-Infrared Infrared Stimulated Luminescence (post-IRIRSL) signals of potassium feldspars (K-feldspar) are achieved either in two steps (pIRIR, Thomsen et al., 2008; Buylaert et al., 2009; Thiel et al., 2011) or in multiple steps (MET-pIRIR, Li and Li, 2011). These procedures help extend the upper limit of luminescence dating to 300 ka to 500 ka on aeolian loess (Li and Li, 2012; Chen et al., 2015), for which the post-IR IRSL signals were bleached to a negligible level (Buylaert et al., 2011; Li et al., 2014). However, the incomplete bleaching of post-IR IRSL signals prior to deposition due to their slow bleaching characteristics complicates its application to dating fluvial and other water-lain sediments (e.g., Kars et al., 2014; Colarossi et al., 2015).
It was reported that the small aliquot K-feldspar MET-pIRIR ages were overestimated by 50% for a Holocene fluvial sample from Northern Tianshan (Fu et al., 2015). As a potential way to tackle the partial bleaching problem, single grain procedure is increasingly employed for dating water-lain sediments by incorporating various pIRIR signals (Nian et al., 2012; Reimann et al., 2012; Brown et al., 2015; Rhodes, 2015; Brill et al., 2018; Malatesta et al., 2018; Li et al., 2018; Rui et al., 2019). For fluvial samples older than 10 ka, the high-temperature pIRIR signals, e.g., pIRIR225 and pIRIR290 signals, are employed. With consideration of the bleaching rate, the pIRIR225 signal is more frequently employed in recent studies of fluvial samples (Brown et al., 2015; Rhodes, 2015; Brill et al., 2018; Malatesta et al., 2018). Rhodes (2015) showed that the single grain K-feldspar pIRIR225 ages are consistent with the independent ages ranging from 1 ka to 100 ka. However, the intrinsically old property of the strata leads to complexities for single grain dating. Firstly, the anomalous fading of pIRIR signals would be considerable even at high stimulation temperature (Kolb and Fuchs, 2018; Malatesta et al., 2018), but its rates are difficult to measure and rather variable amongst grains (Reimann et al., 2012; Rhodes, 2015; Smedley et al., 2015). Secondly, the upper dating limit of single grain K-feldspar pIRIR procedure might be around 300 ka due to dose saturation (Li and Li, 2012; Malatesta et al., 2018), which might not be high enough for the strata presumed to be early Pleistocene. The multiple aliquots regenerative MET-pIRIR (MAR-MET-pIRIR) procedure helps double the characteristic saturation dose of MET-pIRIR signals and allows to date samples as old as 500 ka (Chen et al., 2015), which makes it an ideal choice for dating old samples.
In this study, we are aiming to employ the state-of-art K-feldspar pIRIR and MET-pIRIR dating procedures to constrain the depositional age of the tectonically deformed fluvial sandy bed at the bottom of the outcrop on the eastern tip of Anjihai anticline. It is the first attempt of absolute dating, which is critical for the earthquake hazard evaluation for the cities nearby. The single grain K-feldspar pIRIR and MAR-MET-pIRIR procedures will be employed. For the single grain procedure, both the pIRIR225 and pIRIR290 signals are explored, taking consideration of their different stability and bleachability (Smedley et al., 2015). Both the central age model (CAM) and minimum age model (MAM) are employed to derive the De values of the sample (Galbraith et al., 1999). However, the application of MAM to pIRIR and MET-pIRIR De distributions may be biased to the grains with large fading rates rather than with well bleaching. Meanwhile, the mean and median De values are also calculated for comparison, upon which the depositional age of the tectonically deformed fluvial strata will be discussed.
. SAMPLE, METHODS AND EXPERIMENTS
Sample
Previous studies have shown that the shortening rates of Anjihai anticline ranging from 0.5 mm/yr to 1.12 mm/yr during late Pleistocene, with luminescence ages available for its western tip (Deng et al., 2000; Daëron et al., 2007; Fu et al., 2017; Lv et al., 2017, 2019). If the depositional age of the sample from the eastern tip is not as old as early Pleistocene, it may suggest that the Anjihai anticline is active at both eastern and western tips, which is critical for seismic hazards evaluation. As that shown in Fig. 1c, the sample (JGH 18 OSL 23) was taken from a sandy lens with clear bedding and well sorting at the bottom of the loess and fluvial sedimentary sequence (with a thickness of 51m) at the eastern tip of Anjihai anticline. The bedding of the strata is slightly southward tilted due to tectonic deformation. The sample is 7.5m higher than the modern river bed.
Experimental details
The sample was prepared following the procedures of Aitken (1998). It was treated with HCl and H2O2 to remove the carbonates and organic matter, respectively, and then wet-sieved to separate grains in the size range of 125–180 μm. Subsequently, the K-feldspar grains (ρ < 2.58 g/cm3) were enriched by density separation with the solution of lithium polytungstate. They were then subjected to HF (10%) etching for 40 min to remove the alpha particle irradiated layer and repeatedly rinsed by 10% HCl and distilled water to remove the fluorides.
For single grain measurements, the K-feldspar grains were mounted into the single grain disc with hole diameter of 200 μm and a depth of 200 μm. The single grain luminescence measurements were performed on an automated Risø DA-20 TL/OSL reader with dual – laser single grain attachment. The IR laser (λ = 830 nm, Pmax = 500 mW/cm2) with 90% of its full power was employed for IR stimulation, and the photon multiplier tube (PMT) of model 9235QB15 with blue filter pack (BG3 and BG39) mounted in front was used for detecting the blue emission from the K-feldspar grain. The dose rate of the 90Sr/90Y β irradiation source attached on the reader is 0.1852 ± 0.0044 Gy/s, calibrated using the single grain disc.
For the MAR-MET-pIRIR measurements, the K-feldspar grains were mounted on steel-stainless disc with silicon spray in diameters of 8 mm and 1 mm for large aliquot and small aliquot, respectively. The IR LEDs (λ=870 nm, Pmax=145 mW/cm2) with 90% of its full power was employed for all IR stimulations, and the PMT (model 9107QB70) with blue filter pack (BG3 and BG39) mounted in front was used for detecting the blue emission of the K-feldspar aliquots. The dose rate of the 90Sr/90Y β irradiation source attached on the reader is 0.2073 ± 0.0018 Gy/s, calibrated using the steel-stainless disc.
The radioactivity of the sample was measured with ORTEC GEM70P4-95 gamma spectrometry equipped with a Ge detector. The internal potassium concentration of K-feldspar grains was taken as 12.5% ± 0.5%. The dose rate of the sample was calculated by using the DRAC online calculator (Durcan et al., 2015), with the water content estimated to be 10% ± 5%.
Methods
The pIRIR225 (Buylaert et al., 2009) and pIRIR290 (Thiel et al., 2011) signals are most frequently employed for dating old samples. The former one is bleached faster than the latter one, but suffers more anomalous fading. Therefore, they are both employed for the single grain procedure to determine the De value of individual K-feldspar grain (Table 1). For the recent application to the fluvial sediments, single grain pIRIR225 signal is often adopted (Malatesta et al., 2018; Kolb and Fuchs, 2018). There are two reasons for doing so. One is that the pIRIR225 signal is easier to bleach than the pIRIR290 signal (Buylaert et al., 2012; Kars et al., 2014), in particular for the water-lain sediments; the other is the potential initial sensitivity change induced by high-temperature treatment involved in the measurement of pIRIR290 signal (Roberts, 2012; Qin et al., 2018). The inheritance of thermally transferred pIRIR (TT-pIRIR) signal from natural and regenerative doses to pIRIR signals of the corresponding test dose may affect the dose response characteristics and the resultant De values (Nian et al., 2012; Qin and Zhou, 2012). In our experiment, the size of the test dose was optimised by making the ratio of TT-pIRIR signals of natural dose to the pIRIR signals of the following test dose be less than 15%. With consideration of the notorious initial sensitivity change of IRSL and pIRIR signal measurements (Wallinga et al., 2000; Kars et al., 2014; Colarossi et al., 2018; Qin et al., 2018; Zhang, 2018), the dose recovery experiment was employed to verify the measurement procedure by optimising the test dose.
Table 1
Single-grain pIRIR and multiple-aliquot MET-pIRIR measurements procedures.
The MAR-MET-pIRIR procedure of Li et al. (2017) was slightly modified to apply to the sample of this study. For the MAR-MET-pIRIR measurements, 8 mm large aliquots were bleached with SOL2 for 12 hours to remove the natural signal and given different regenerative doses ranging from ∼310 Gy to ∼1865 Gy to establish the dose response curve, and tens of 1 mm aliquots were prepared for measuring the natural MET-pIRIR signals. Six consecutive IR stimulation at progressively higher temperatures ranging from 50°C to 290°C were conducted after the preheat at 320°C for 60 s for both natural/regenerative and following test doses (Table 1). After measuring the sensitivity corrected MET-pIRIR signals of the natural (Ln/Tn) and regenerative doses (Lx/Tx), all 8 mm and 1 mm aliquots were subjected to 4 hrs SOL2 bleaching to remove the residual signals. Subsequently, the sensitivity corrected MET-pIRIR intensities of a common regenerative dose of 518 Gy (Lr/Tr) were measured to normalise the dose response variability among different aliquots. Finally, the normalised Ln/Tn ((Ln/Tn)/(Lr/Tr)) values of 1 mm aliquots are projected onto the dose response curve established by the normalised Lx/Tx ((Lx/Tx)/(Lr/Tr)) of 8 mm aliquots to derive the De values. Similar to the single grain procedure, the size of the test dose was also optimised to render the ratio of natural TT-MET-pIRIR to the MET-pIRIR intensity to be lower than 15%. To suppress the potential isothermal decay (Fu et al., 2012) and photon transferred thermo-luminescence (PTTL, Qin et al., 2015) contributions to the MET-pIRIR signals, the IR-off period increases from 10 s to 60 s with the increase of the stimulation temperatures.
In this study, we employed three criteria for screening the data for analysis: the recycling ratio is between 0.9 and 1.1, the integrated test dose pIRIR intensity is larger than 100 and higher than the 3σ of the background. The central age model (CAM) and minimum age model (MAM), as well as the mean and median, were applied to De distributions determined by the single grain pIRIR and MAR-MET-pIRIR procedures, which were implemented in R package “Luminescence” (Dietze et al., 2015).
. RESULTS
Luminescence characteristics
Decay curves
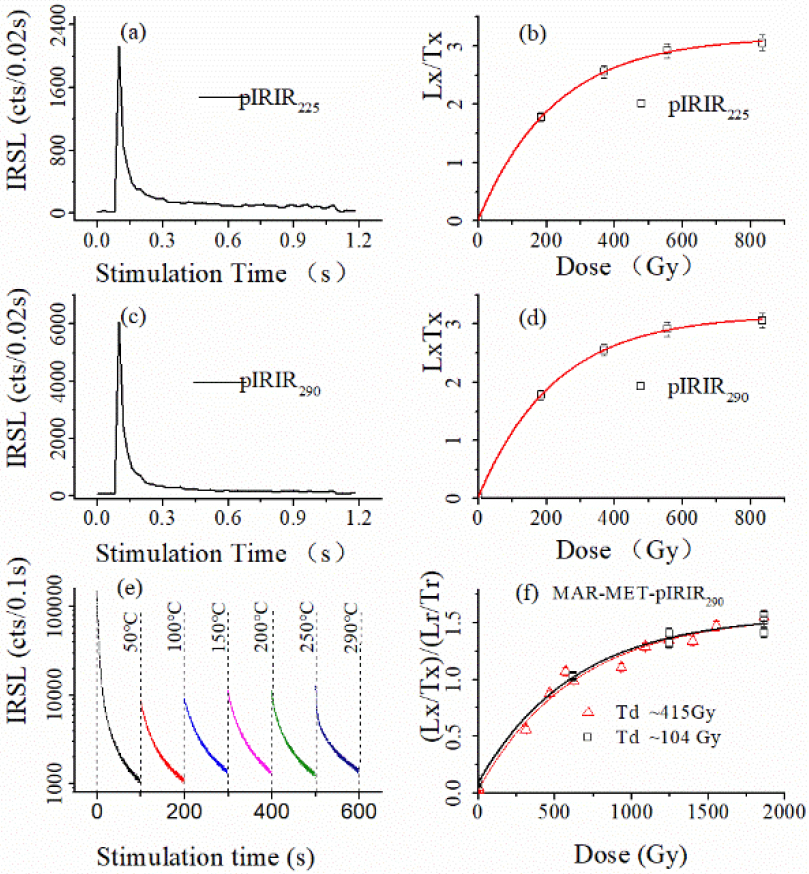
Single grain pIRIR and MAR-MET-pIRIR procedures were employed to obtain the De distribution of the sample. For the single grain procedures, the pIRIR225 and pIRIR290 signals were measured following the procedures shown in Table 1a and 1b, which are slightly modified from the procedures of Buylaert et al. (2009) and Thiel et al. (2011), respectively. Fig. 2a and 2c show the typical luminescence decay curves of pIRIR225 and pIRIR290 signals resulting from ∼93 Gy β dose, respectively. They both decay to a constant level after 0.3s IR stimulation. The initial intensity of individual K-feldspar grain ranges from 500 to 1·104 and 600 to 8·103for the pIRIR225 and the pIRIR290 signals, respectively, which are much higher than the background level at ∼50 and ∼70 respectively. The net intensity of single grain K-feldspar pIRIR signal was calculated as the integration of initial 0.04 s intensity of the decay curves with the subtraction of the integration of last 0.1 s intensity. For the MAR-MET-pIRIR procedure, the initial intensity of the decay curves of ∼415 Gy β dose of 8 mm aliquot slightly increases with the stimulation temperature, except that of the MET-IR50 signal (Fig. 2e). The initial 0.4 s was integrated as the signal, while the last 4.5 s was integrated as the background.
Fig. 2
Typical luminescence decay curves and growth curves of the K-feldspar single grain pIRIR and MAR-MET-pIRIR signals. a) and b) are the decay curve and growth curve of single grain pIRIR225 signal, respectively; c) and d) are the decay curve and growth curve of single grain pIRIR290 signal, respectively; e) MAR-MET-pIRIR decay curves; f) typical growth curves of MAR-MET-pIRIR290 signals. Black line\squares show the growth curve with a test dose of 104 Gy. Red line and triangles show the growth curve with a test dose of 415 Gy.
Thermal transfer
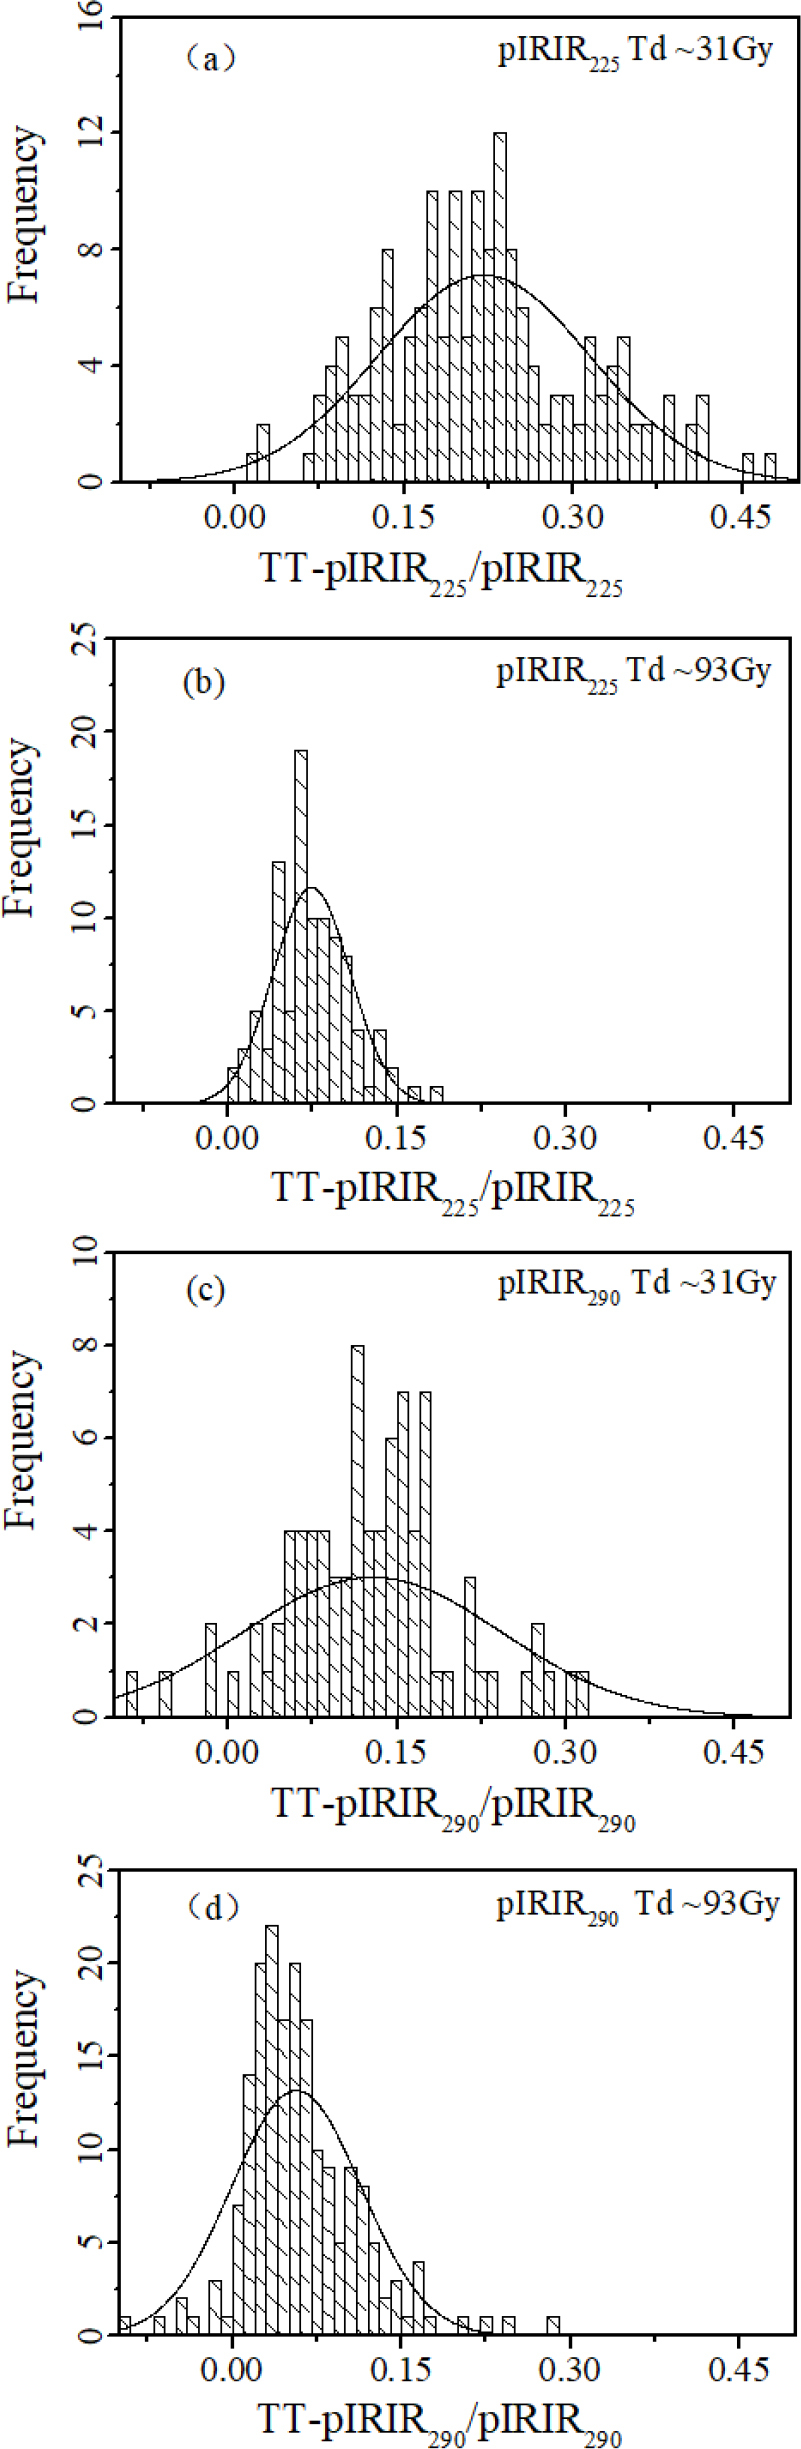
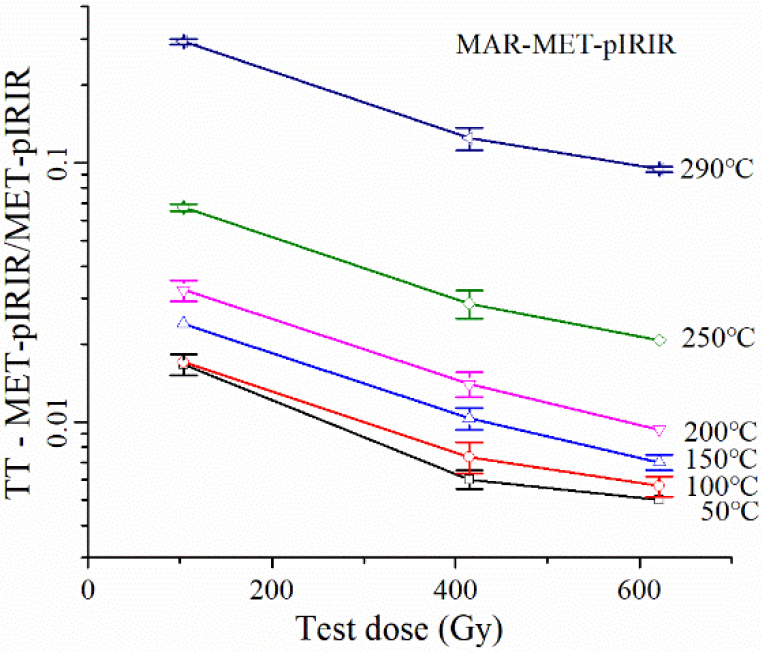
The inheritance of thermally transferred signals to the signals of the test dose is always concerned in the pIRIR measurements, which may lead to inappropriate sensitivity correction (Nian et al., 2012; Qin and Zhou, 2012). The effect of thermally transferred signals could be largely suppressed by increasing the size of the test dose. In this study, the ratio of thermally transferred signals of natural dose to the signal of the test dose to be less than 15% was taken as a criterion for optimising the test dose. After measuring the natural pIRIR signal of single grain or MET-pIRIR signals of 8 mm aliquot following the procedures shown in Table 1, the sample was preheated and stimulated again with no dose irradiation to measure the thermally transferred pIRIR (TT-pIRIR) and thermally transferred MET-pIRIR (TT-MET-pIRIR) signals. Subsequently, the pIRIR and MET-pIRIR responses to different test doses were measured. The same integration limits for the signal and background, as stated above, were taken for calculating the ratio of the TT-pIRIR (TTMET-pIRIR) to the pIRIR (MET-pIRIR) signals. The frequency distribution in Fig. 3a and 3c show that most of TT-pIRIR225/pIRIR225 and TT-pIRIR290/pIRIR290 ratio are 0.2 and 0.15, respectively, with the test dose of 31 Gy. By increasing the test dose to 93 Gy, such ratios decrease to less than 0.1 for both signals (Fig. 3b and 3d). Therefore, the test dose was set to 93 Gy preliminarily for single grain measurements. Similar experiments were performed to evaluate the contribution of thermally transferred signals for the MAR-MET-pIRIR procedure shown in Table 1 by using three 8 mm aliquots. Fig. 4 shows the averaged TT-MET-pIRIR/MET-pIRIR ratios generally increase with the stimulation temperature. For stimulation temperatures ranging from 50°C to 250°C, such ratio is always less than 10% even the test dose is as low as 104 Gy. However, for the MET-pIRIR290 signal, the ratio is as high as 30% with the test dose of 104 Gy. When the test dose increases to 415 Gy, such ratio decreases to ∼15%. With the test dose further increased to 622 Gy, such ratio slightly decreases to ∼11%.
Dose response
With the preliminarily chosen test dose, the single grain pIRIR and MAR-MET-pIRIR procedures shown in Table 1 were employed to investigate the dose response characteristics. The saturating exponential equation was used to fit the dose response curves. Typical dose response curves (DRC) of single grain pIRIR225 (Fig. 2b) and pIRIR290 (Fig. 2d) signals show that these two signals are close to saturation with the regenerative dose of 800 Gy. However, the MAR-MET-pIRIR290 DRC is not saturated until the regenerative dose is as large as 1866 Gy and the characteristic saturation dose (Do) is 675 ± 35 Gy (Fig. 2f). In addition, the renormalised MAR-MET-pIRIR290 DRC established by employing the test dose of 104 Gy is also shown in Fig. 2f, and it is not distinguished from the DRC with the test dose of 415 Gy.
Dose recovery test
The dose recovery test is a way to investigate whether the initial sensitivity change is significant for employing IRSL, pIRIR and MET-pIRIR signals from single aliquot for De determination (Wallinga et al., 2000; Kars et al., 2014; Nian et al., 2016; Yi et al., 2016; Qin et al., 2018). It would also apply to the single grain pIRIR measurements. Firstly, the K-feldspar grains were bleached by the solar simulator SOL2 for 12 hours to remove the natural signals. Then, 3000 s (in equivalence with 556 Gy) β irradiation was applied to the bleached grains. Subsequently, the single grain pIRIR measurement procedures (Table 1a and 1b) were applied to the dosed K-feldspar grains with a test dose of 93 Gy. Since the given dose is fairly large in this study, the residual dose after 12 hours SOL2 bleaching is supposed to be negligible with respect to the reported residual pIRIR225 and pIRIR290 signals (Li and Li, 2011; Buylaert et al., 2012; Rui et al., 2015; Guo et al., 2015; Smedley et al., 2015).
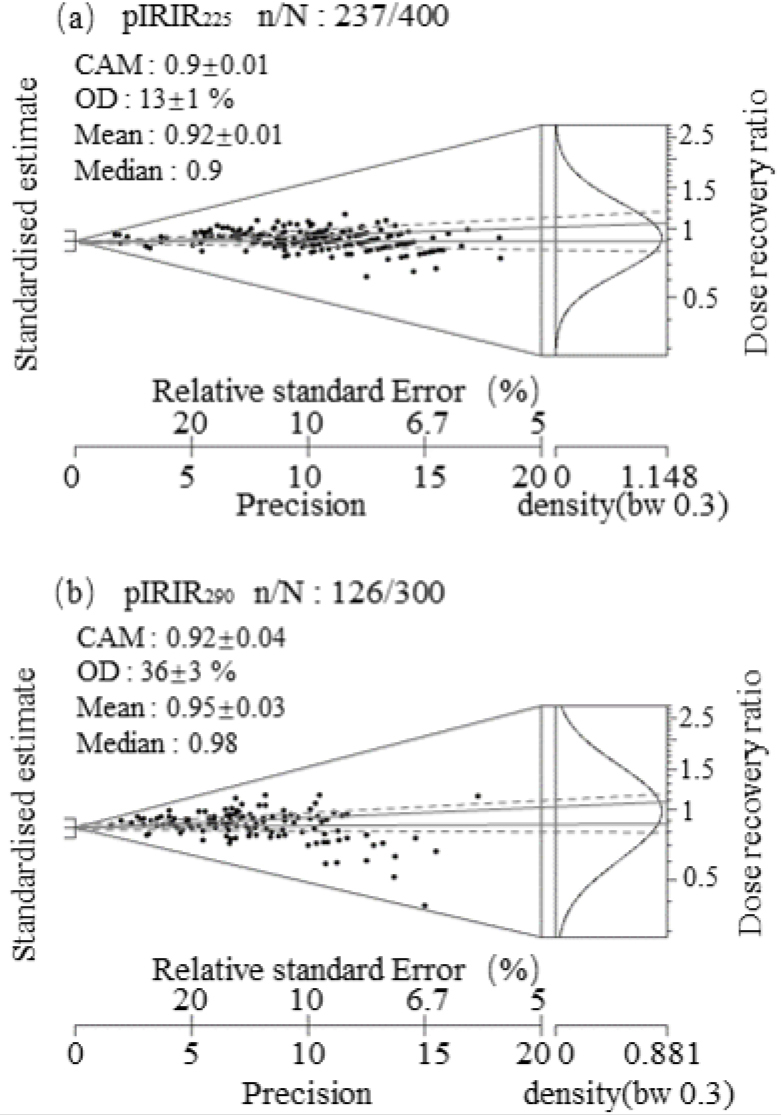
Fig. 5 shows dose recovery ratio (DRR) distribution for the single grain pIRIR225 and pIRIR290 measurements, respectively. The kernel density estimation (KDE) indicates the DRR distribution peaks around unity for both signals. The mean of DRR are 0.92 ± 0.01 and 0.95 ± 0.03 for the pIRIR225 and pIRIR290 signals, respectively. They are both in the acceptable range, although the DRRs are much more scattered for the pIRIR290 signal. The over-dispersion (OD) determined by applying the central age model (CAM) to the dose recovery ratio distribution is 13% ± 1% and 36% ± 3% for the pIRIR225 and pIRIR290 signal, respectively.
Equivalent dose determination
Single grain procedures
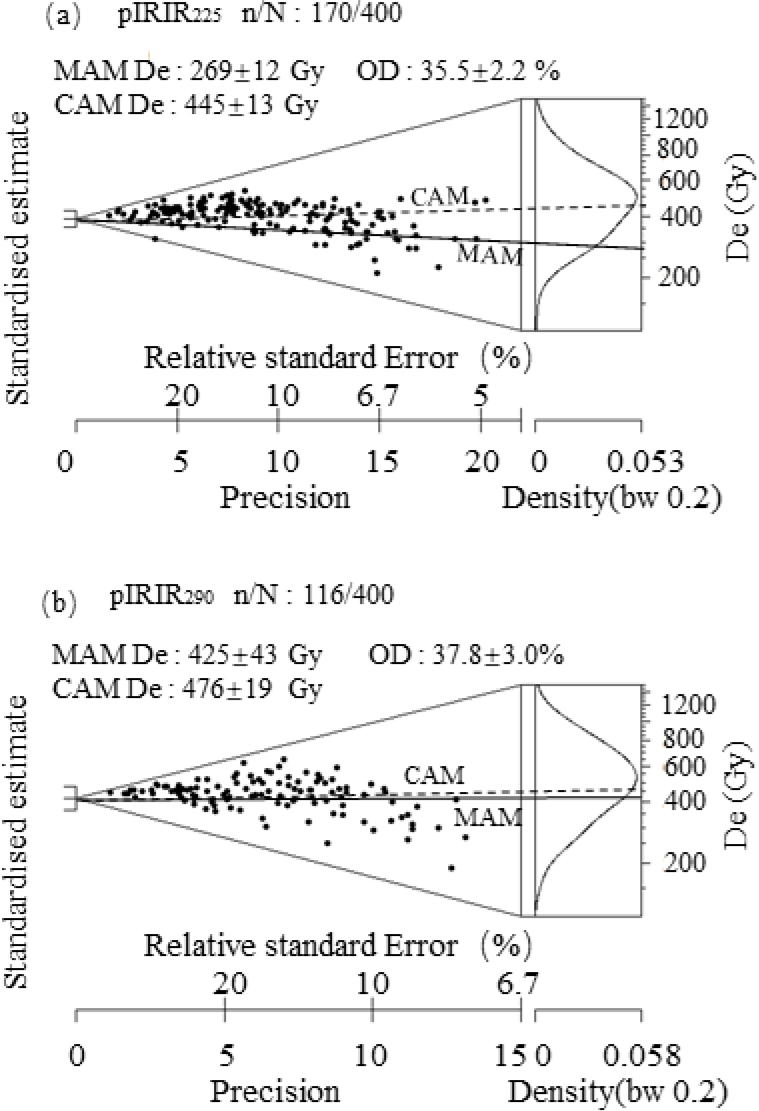
The single grain pIRIR procedures were applied to four hundred K-feldspar grains for both signals, and the data screening criteria was the same as those adopted for dose recovery test. 170 and 116 out of 400 grains were accepted for analysis for pIRIR225 and pIRIR290 signal, respectively, and the corresponding De distributions are shown by Abanico plots in Fig. 6. The CAM De are 445 ± 13 Gy and 476 ± 19 Gy for the pIRIR225 and pIRIR290 procedure, while the corresponding OD values are 35.5% ± 2.2% and 37.8% ± 3.0%, respectively. The OD value of pIRIR225 De is three times higher than the OD value of 13% determined by the dose recovery test, which may imply partial bleaching. However, for the pIRIR290 signal, the OD of the De values is close to that of the dose recovery ratio, which is both around 36%. The minimum age model (MAM) was subsequently applied for the pIRIR225 and pIRIR290 De values, with the “σb” of 13% and 36% determined through the dose recovery test, respectively. The resultant MAM De are 269 ± 12 Gy and 425 ± 43 Gy for the pIRIR225 and pIRIR290 procedure, respectively. The mean and median De are also calculated, and they are both close to the CAM De values for both signals (Table 2).
Fig. 6
The abanico plot of De distribution for single grain pIRIR225 and single grain pIRIR290 procedures with a test dose of 93 Gy. MAM De was calculated with sigmab of 0.13 and 0.36 for pIRIR225 and pIRIR290 signals, respectively.
MAR-MET-pIRIR procedure
Fifty-six 1 mm aliquots were measured with the MAR-MET-pIRIR procedure shown in Table 1, and the normalised natural MET-pIRIR intensities were projected upon the DRCs established in Section 3 – Luminescence characteristics – Dose response to obtain De values. The KDE of MAR-MET-pIRIR290 De values is shown in Fig. 7a as an example. The De values are rather dispersive, which range from 700 Gy to 2000 Gy, and the OD value is 17 ± 2%. The OD values constrained for different stimulation temperatures range from 15% to 20%. Fu et al. (2015) reported an OD value of 10% for MET-pIRIR signals of loess samples from the same area. It implies that incomplete bleaching may contribute to the MAR-MET-pIRIR De distribution. Similar to the treatment for single grain De values, the CAM De, MAM De, median De and mean De values were calculated for the MET-pIRIR signals measured at different temperatures. The “σb” was taken as 10% for applying the MAM to all MAR-MET-pIRIR De values, which is based on the similar MET-pIRIR decay characteristics shown in Fig. 2e.
Fig. 7
Kernel density estimate of MAR-MET-pIRIR290 De values. De distributions measured with test dose of ∼415 Gy and ∼104 Gy are shown in a) and b), respectively.
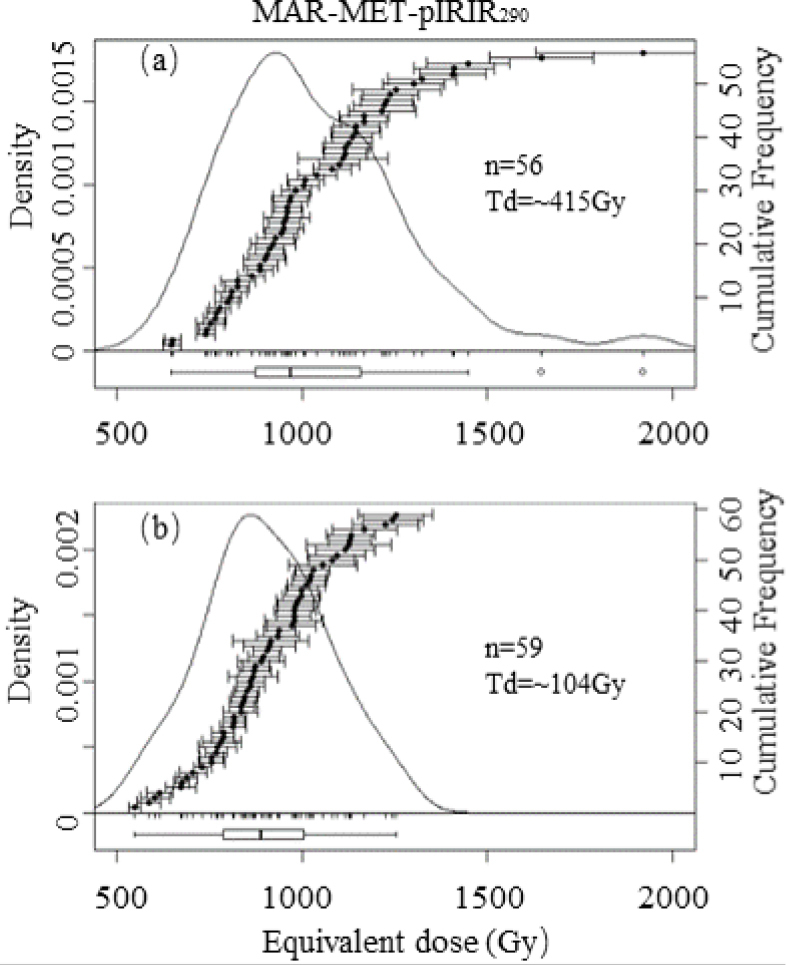
Fig. 8a shows the dependence of various statistics of De values on the stimulation temperatures. For each stimulation temperature, the De values resulted from different statistical methods are consistent, except that the MAM De is 100–150 Gy lower. Both CAM and MAM De increase with stimulation temperature in the range of 50°C to 250°C, and a plateau is observed between 250°C and 290°C, which implies that the CAM and MAM De values in this range are not affected by anomalous fading (Li and Li, 2011). Since the De values are as large as 800 Gy, the characteristic saturation doses (Do) of MAR-MET-pIRIR dose response curves are closely examined. The Do value decreases from 829 ± 127 Gy to 644 ± 76 Gy with the increase of stimulation temperature in general (Fig. 8a).
Fig. 8
Dependence of MAR-MET-pIRIR De values on stimulation temperature. a) with a test dose of 415 Gy; b) with a test dose of 104 Gy.
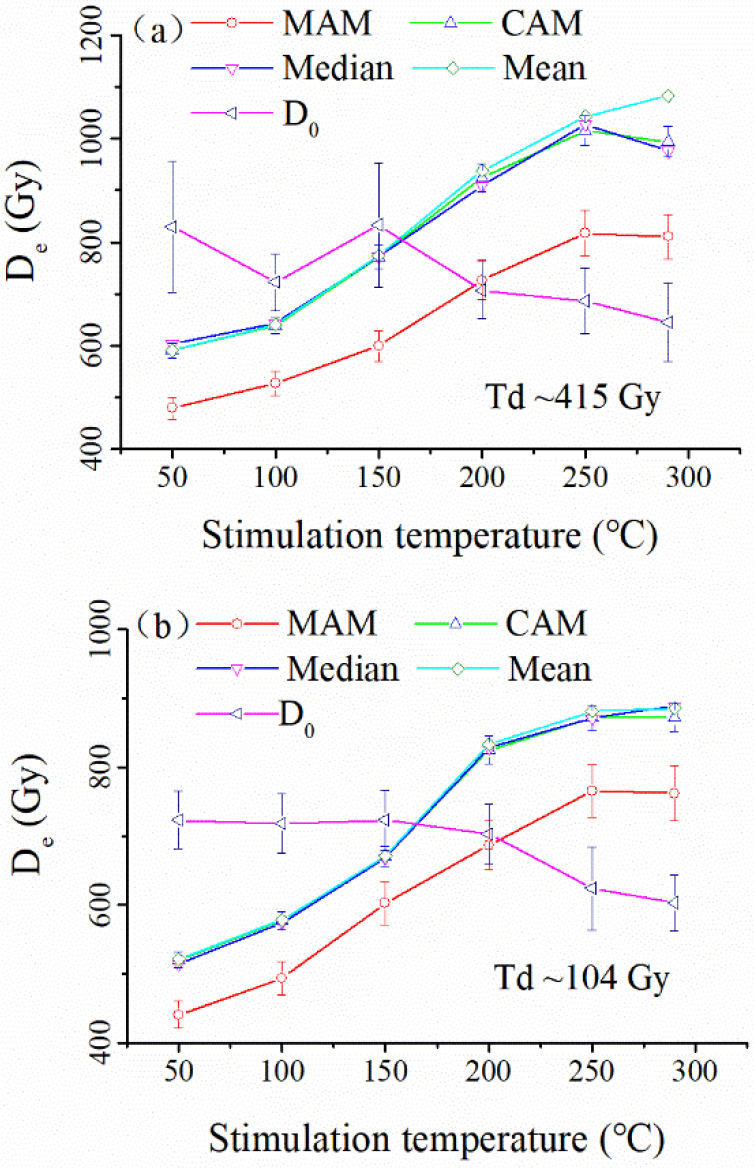
MAR-MET-pIRIR De values determined with a test dose of 104 Gy are compared. Fig. 7b shows that the MAR-MET-pIRIR290 De values range from 520 Gy to 1300 Gy. A plateau was also identified between 250°C and 290°C. The large test dose of 415 Gy resulted in slightly larger MAM and CAM De values than those obtained with the test dose of 104 Gy, while the median and KDE peak of the De distribution are close to those with the test dose of 104 Gy (Fig. 7a). With the test dose of 415 Gy and 104 Gy, the MAM De are 811 ± 44 Gy and 762 ± 40 Gy, while the CAM De are 977 ± 27 Gy and 872 ± 21 Gy, respectively. The median and mean De values are consistent with CAM De values for both procedures. Such differences in De values between these two procedures with different test doses suggest that the thermal transfer may lead to slight underestimation (7%–10%) of De values.
. DISCUSSION
Methodological uncertainties
Although the K-feldspar pIRIR or MET-pIRIR signals are of potential to date the water-lain sediments beyond late-Pleistocene, challenges arise both internally and externally, which include (1) the inheritance of pIRIR signals due to thermal transfer effect (Nian et al., 2012; Qin and Zhou, 2012); (2) the initial sensitivity change due to high temperature heating (Wallinga et al., 2000; Roberts, 2012; Kars et al., 2014; Qin et al., 2018); (3) the variability of anomalous fading among grains (Reimann et al., 2012; Kars et al., 2014; Rui et al., 2019); (4) the slow bleaching characteristic of high temperature pIRIR and MET-pIRIR signals (Buylaert et al., 2012; Li et al., 2014). In this study, these complexities were treated carefully.
The effect of thermally transferred pIRIR and MET-pIRIR signals were suppressed by increasing the size of the test dose. The test dose was optimised to be ∼20% to ∼40% of the CAM De for the single grain pIRIR and MAR-MET-pIRIR procedures, respectively, which made the contribution of thermally transferred signals to the corresponding pIRIR and MET-pIRIR signals to be less than 15% (Fig. 3 and Fig. 4). It is just from the aspect of suppressing the thermal transfer. However, the size of test dose is also subtle for recovering a known dose irradiated in the laboratory by the single aliquot or single grain pIRIR and MET-pIRIR procedures (Nian et al., 2016; Yi et al., 2016; Qin et al., 2018), which is an indicator of any initial sensitivity change (Kars et al., 2014; Qin et al., 2018). The dose recovery experiments performed for the single grain pIRIR procedures validated the choice of test dose on the basis of averaged behaviour of K-feldspar grains. However, the DRR values are rather scattered, especially for the pIRIR290 signal (Fig. 5). Further, the appropriateness of the size of test dose depends significantly on the size of natural or given dose (Yi et al., 2016; Qin et al., 2018); therefore, a common test dose may not be appropriate for K-feldspar grains with a wide distribution of De values shown in Fig. 6. It implies that the uncertainties arising from varying initial sensitivity change among K-feldspar grains may contribute to the observed dispersion of single grain pIRIR De values, for which further investigations are still needed. Since the aliquots are not heated prior to the irradiation of natural or regenerative dose, the MAR-MET-pIRIR procedure is expected to be less affected by initial sensitivity changes if such changes are the same from the natural dose and regenerative dose to their corresponding test dose, respectively (Li et al., 2017; Qin et al., 2018).
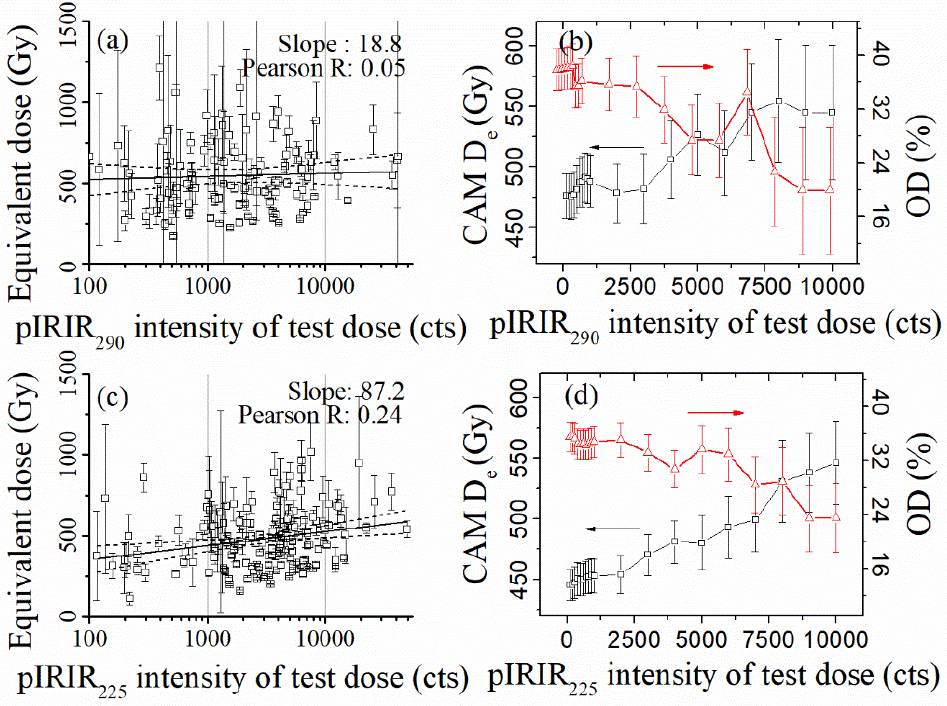
Since the sample is water-lain, the potential incomplete bleaching evidenced by large OD of single grain pIRIR De value necessitates the implementation of the MAM. The rationale for implementing the MAM is that the scatter in single grain De values is mainly due to different bleaching extents of pIRIR signal of K-feldspar grains before deposition. However, the anomalous fading also varies among grains, and it is difficult to measure the fading rate on individual grain level. Therefore, there is a potential risk of biasing to grains with more fading rather than sufficient bleaching when implementing the MAM. As an alternative, the pIRIR sensitivity is a possible index for anomalous fading of K-feldspar grains (Smedley et al., 2015; Reimann et al., 2012; Rhodes, 2015). Although a weak positive correlation is observed between the natural log of pIRIR290 sensitivities and De values for K-feldspar grains of this study (Fig. 9a, the slope of linear regression is 18.8 with the Pearson R of 0.05), the scatter of De values decreases with the pIRIR sensitivity. A more significant positive correlation between these two quantities is observed for the pIRIR225 signal (Fig. 9c, the slope of linear regression is 87.2 with the Pearson R of 0.24). Fig. 9b and 9d show that the CAM De values for the brightest K-feldspar grains (pIRIR intensity larger than 104) are ∼550 Gy for both the pIRIR225 and pIRIR290 signals. Malatesta et al. (2018) employed the OD values calculated after pIRIR sensitivity screening to identify the well bleached grains and still applied the fading correction to the brightest K-feldspar grains. In this study, the OD values decrease from 36% to 20% with the increase of pIRIR sensitivity employed for screening and may imply better bleaching for K-feldspar grains with high pIRIR sensitivity.
Fig. 9
Dependence of K-feldspar single grain De value on the pIRIR sensitivity (response to a test dose of 93 Gy) a) pIRIR225 and c) pIRIR290 signals. The solid line is linear fit and the dashed line is the 95% confidence band. The dependence of CAM De and OD on the lowest pIRIR sensitivity employed to screen the K-feldspar for analysis are shown in b) and d).
Comparison among various procedures
The De distributions determined by different procedures are shown in Fig. 10. Except for the MAM De of the single grain pIRIR225 signal, other statistical metrics cluster around 455 Gy and 490 Gy for the single grain pIRIR225 and pIRIR290 procedure, respectively (Table 2), although the variation is much larger for the former (grey shaded area). However, they are consistently lower than the MAR-MET-pIRIR290 De values. The MAM MAR-MET-pIRIR290 De of 811 ± 44 Gy is 1.9 times and three times higher than the single grain MAM pIRIR290 and MAM pIRIR225 De, respectively, which might be partly attributed to the anomalous fading of the single grain pIRIR signals. Malatesta et al. (2018) employed an averaged fading rate of 4.32 ± 0.38% to correct the fading of pIRIR225 signals of their K-feldspar grains taken from the same area, and it led to 46%–70% increase in De values for their samples with uncorrected De values close to our study (Table 2 of the supplementary material of Malatesta et al., 2018). If such correction were applied to the sample of this study, the corrected De would be 803 to 935 Gy, which are more or less close to the MAR-MET-pIRIR290 De value. Apart from the anomalous fading, the inaccurate sensitivity correction may also contribute to the systematic De discrepancy between single grain pIRIR and MAR-MET-pIRIR290 signals (Li et al., 2013a; Chen et al., 2015), for which further investigations are still needed.
Fig. 10
Comparison of De values obtained by the single grain pIRIR procedures and MAR-MET-pIRIR290 procedures. Various statistical models were applied to the measured De values. The D0 and 2·D0 values are shown for MAR-MET-pIRIR290 procedures with test doses of 104 Gy and 415 Gy, respectively. The shaded region shows the whole range of De values measured with different procedures.
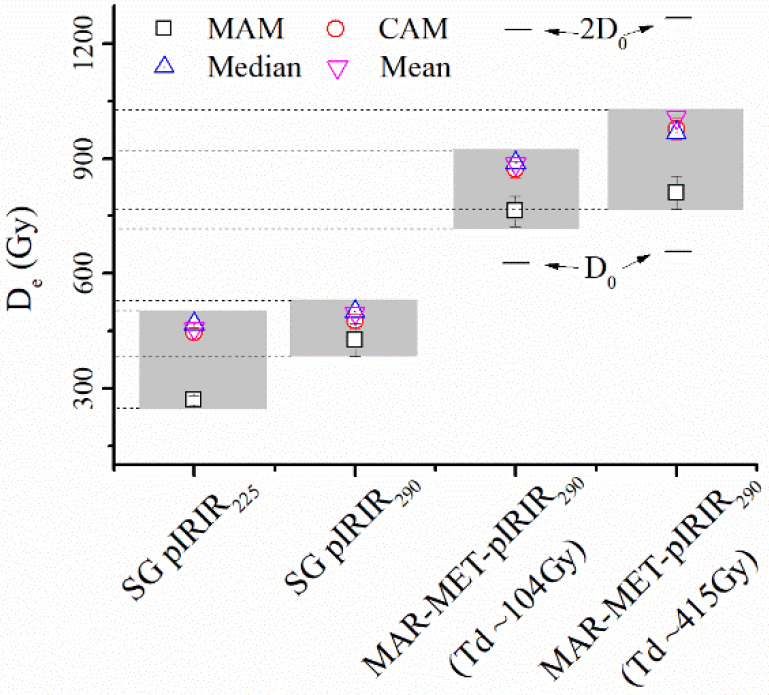
The characteristic saturation dose (Do) is of concern when an old sample is dated. The Do value of the MET-MAR-pIRIR290 signals are 644 ± 76 Gy and 603 ± 41 Gy with the test dose of 415 Gy and 104 Gy, respectively (Fig. 10). Even the largest De value (upper dashed line of the grey shaded area) is much smaller than the 2·Do. Therefore, the MAR-MET-pIRIR290 De values are in the range of theoretical upper dating limit.
Preliminary ages and geological implication
With consideration of various uncertainties associated with different measurement procedures, the MAM De of 811 ± 44 Gy determined by using the MAR-MET-pIRIR290 procedure with the test dose of 415 Gy is the most reliable for the fluvial silt of this study. The concentration of uranium, radium, thorium and potassium measured by using the gamma spectrometry equipped with Ge detector is 16.25 ± 4.62 Bq/kg, 9.90 ± 0.30 Bq/kg, 19.32 ± 0.30 Bq/kg and 593.33 ± 10.01 Bq/kg. The internal potassium content and water content are estimated to be 12.5 ± 0.5% and 10 ±5%, respectively. The resultant dose rate for the 125–180 μm K-feldspar grains is 2.85 ± 0.85 Gy/ka, and the burial age determined for this fluvial silt sample is 284 ± 86 ka. This age is much younger than the early Pleistocene epoch assigned to the fluvial strata before (Deng et al., 2000). Therefore, the resultant rate of tilting and shortening would be twice at least, which may imply more active tectonics than previously inferred for the study area.
. CONCLUSIONS
In this study, multi-methods luminescence dating was applied to a fluvial silt sample taken from the sandy bed of the basal deformed fluvial strata at the eastern tip of Anjihai anticline on the northern piedmont of Tian Shan. The single grain pIRIR and MAR-MET-pIRIR procedures were optimised with consideration of the methodological uncertainties such as thermal transfer and initial sensitivity change. The central age model and minimum age model were applied to the De distribution determined by the single grain pIRIR225, single grain pIRIR290 and MAR-MET-pIRIR290 signals. The MAM De values are 11%–17% lower than the CAM De values except for the single grain pIRIR225 procedure. The MAM De values determined by the single grain pIRIR procedures are underestimated by more than 40% when compared with the MAM De of MAR-MET-pIRIR290 procedure, which might be attributed to the uncorrected fading of single grain pIRIR measurements. The MAR-MET-pIRIR procedure, which suffers less from the initial sensitivity change and enables the stable signal to be isolated, gives the more reliable De value for the sandy fluvial sample of this study. The MAM MAR-MET-pIRIR290 De of 811 ± 44 Gy results in a burial age of 284 ka, which is much younger than that inferred previously and may imply a more active folding of the eastern tip of Anjihai anticline.