
. Introduction
The link between loess and climate has been investigated by many researchers (e.g. Pye, 1995; Kukla and An, 1989; Kukla et al., 1997; Frechen et al., 2003; Antoine et al., 2009, 2013; Stevens et al., 2011; Obreht et al., 2016). In recent decades, thick loess-palaeosol sequences, also from Poland, focus a great scientific interest (Fedorowicz, 2006; Jary, 2009; Jary and Ciszek, 2013; Moska et al., 2012, 2015). Finding the appropriate location with an uninterrupted sedimentation for at least 100ka plays a key role. The changes in the Polish economy in the last 50 years caused a gradual decrease of the number of locations with easily accessible loess sediments as in the past there were tens of local brickyards which naturally facilitated access to deeper loess layers. The Złota loess profile described in the current work has been accessible for the last few years and became a valuable and representative location not only for Poland, but also for the whole central Europe. The unquestionable advantage of this location is the fact that a historically well-known loess profile in Polanów Samborzecki (Maruszczak, 1991) which was investigated in detail since the 1980s is located only 200 m away. The research allowed to create an accurate stratigraphy for this site and determine the age of the most significant chronostratigraphic markers using the TL method (Prószysńka-Bordas et al., 1985; Grygierczyk and Waga, 1993; Kusiak and Lanczont, 2000; Dolecki and Łanczont, 2001; Jary, 2007, Kusiak, 2008). Unfortunately, the profile is not suitable for further research due to devastation of the place where it was located. The profiles of Polanów Samborzecki and Złota are located within exactly the same loess lobe and hence a direct relationship between our research and the one conducted previously at the Polanów Samborzecki can be established. The investigated profile is located within the Sandomierz Upland where the loess deposits are relatively thick reaching up to 15 m. Thicker loess layers can be seen only in the eastern part of Poland near the Ukrainian border, where even 20 m of thickness can be found. The western part of Poland is characterized by a markedly smaller number of places where the loess cover is preserved and its thickness rarely exceeds a few meters. In south-western Poland, several independent loess cover forms can be seen. Each form can be characterized by different sediment thickness, stratigraphy or physical properties. Such a large variety of loess deposits depending on their east-west geographical location is explained by the influence of continental climate in the eastern part of Poland and more oceanic in the western part (Cegła, 1972; Jersak, 1973; Jary, 2007). Investigations showing the distribution of loess cover in the area of Poland and a characteristics of the most important loess profiles can be found in Maruszczak (1991, 2001).
Loess deposits are created in conditions of relatively dry climate and they are best characterised as a dust sedimentary rock of aeolian origin dominated by a fine grain fraction (up to 20 µm, Pye, 1987, 1995; Vandenberghe, 2013). The source of the loess dust are fluvial deposits, in this case from the Vistula valley which forms the south and western boundary of the investigated loess deposit. The loess dust was blown out of the fluvial deposits into the surrounding areas, and was often transported over a distance of a few tens of km. The aeolian processes connected with the redeposition of the loess deposits also ensure that the zeroing of the luminescence signal necessary for successful OSL dating takes place through exposure to sunlight. In luminescence investigations of loess deposits the fine, 4–11 µm, grain fraction (Timar et al., 2010; Kreutzer et al., 2012) or medium sized, 40–60 µm, fractions are used. In some cases, there may also be a possibility of extracting a coarser fraction (Moska et al., 2012; Kreutzer et al., 2012; Fedorowicz et al., 2013). However, the larger grains are encountered very rarely and they are connected with local effects of sediment redeposition. To ensure representativeness it is probably best if the grain size selected for luminescence dating reflects the modal grain size of the investigated.
In the current study, we attempt to constrain the numerical chronology of the loess profile in Złota using high resolution luminescence dating using post-IR IRSL 290 applied to polymineral grain size fractions of 4–11 µm and compare to the previous OSL results for medium quartz grains (Moska et al., 2015) and also compare to the results obtained in the past for the Polanów Samborzecki loess profile. We discuss methodological aspects, as well as problems of interpretation of the obtained results. Another very important aim of the current study is to compare our results and the new chronostratigraphy obtained for this location with previous studies (Kusiak and Łanczont, 2000; Jary, 2007). The luminescence dating has been supplemented by a detailed analysis of sedimentology, palaeopedology and stratigraphy allowing to interpret the geological history of this place. The investigations of magnetic susceptibility, grain-size distribution or the organic carbon contents aim at obtaining a reliable stratigraphy of the loess sediment in Poland, which in conjunction with the chronostratigraphy will correspond to similar investigations led in other countries, like the chronostratigraphy created by other researchers in Europe, especially in the Serbia, Czech Republic, Germany and Ukraine (Fuchs et al., 2008; Fuchs et al., 2013; Antoine et al., 2009; Fedorowicz et al., 2013, respectively).
. The geological description and sampling site
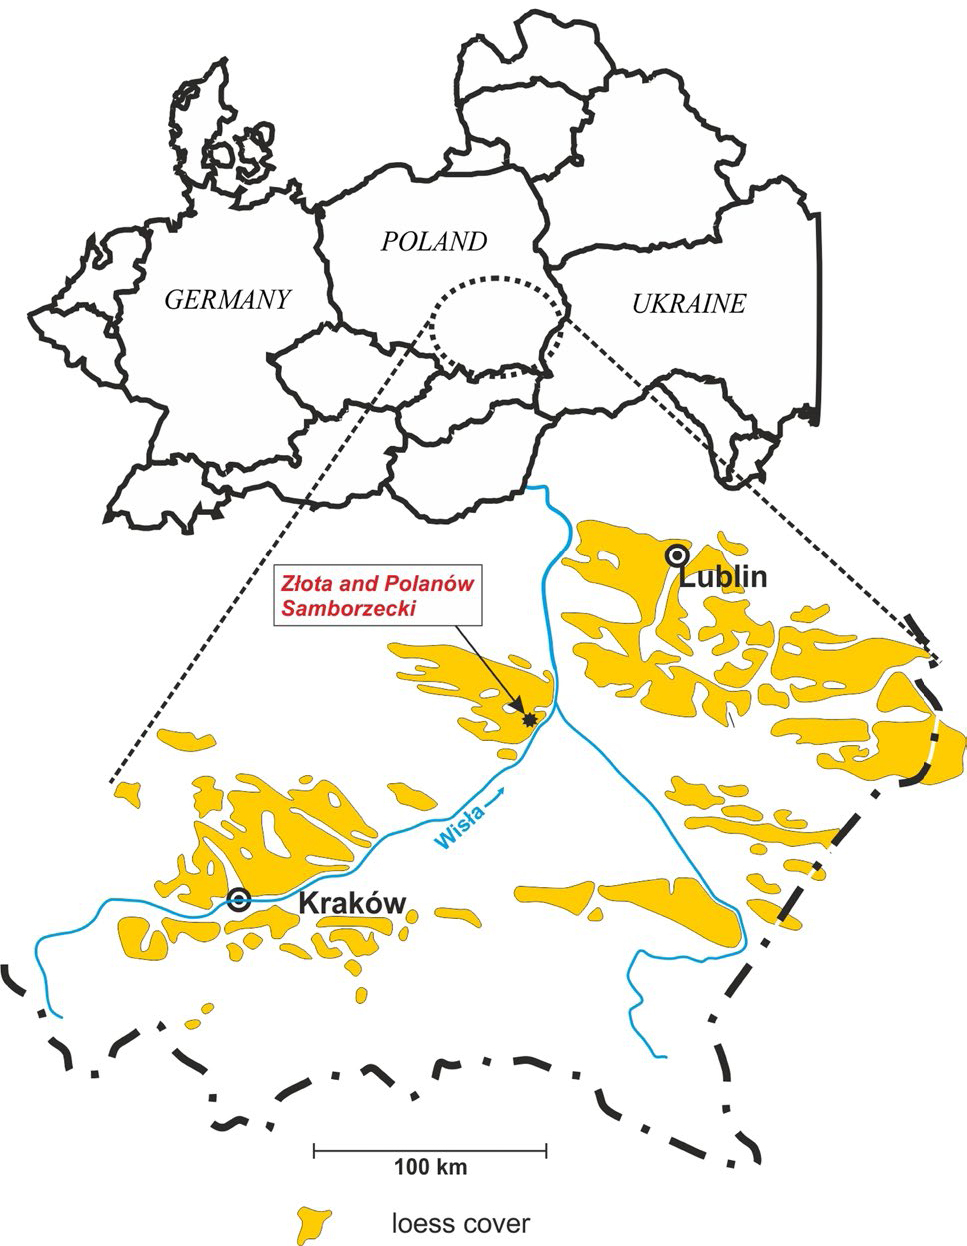
The investigated loess section is located in the southeastern part of Poland in the Vistula river valley (21°39’E, 50°39’N), about 20 m above the current level of water. The section was discovered in 2010 in the Złota village on the northern side of the valley. The thickness of the loess cover in this area exceeds 12 m and the altitude of this place is approximately 170 m a.s.l. The location of Złota and Polanów Samborzecki loess profiles with main areas covered by loess formations in this part of Poland are presented in Fig. 1.
Fig. 1
Loess formations in southeastern part of Poland and position of Złota and Polanów Samborzecki loess profiles.
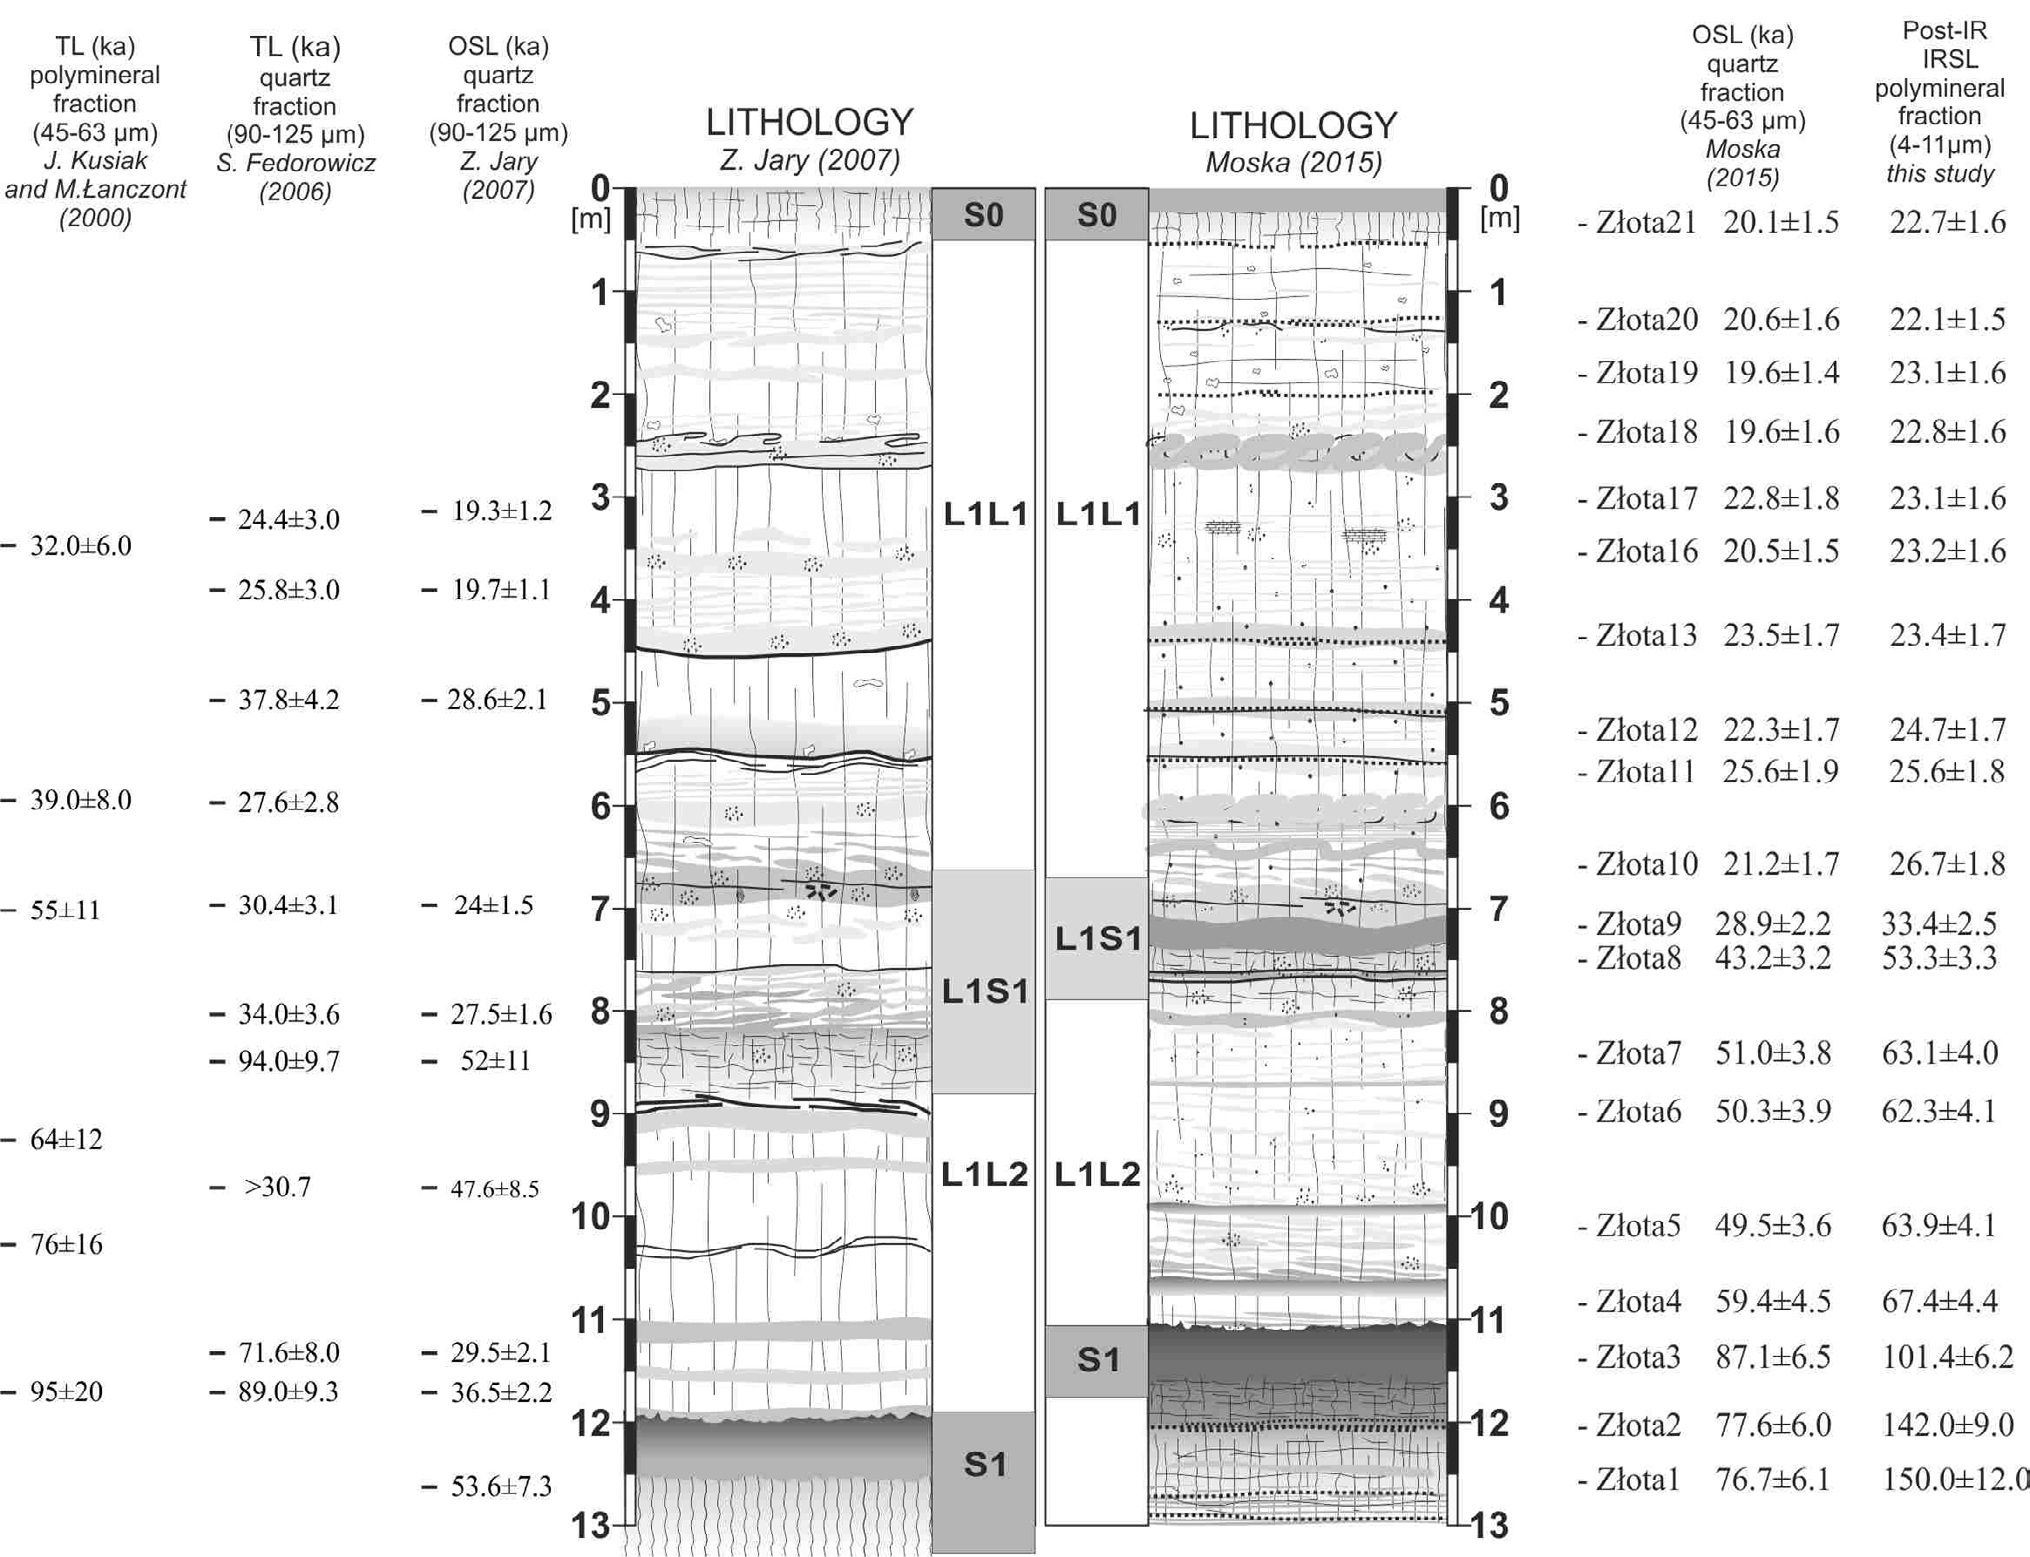
Another loess site, Samborzec, known since the 1980s, is located at a distance of about 100 m westwards, at the excavation site of former brickworks. The site was first described by Grygierczyk and Waga (1993). The site was further investigated by Dolecki and Łanczont (1998, 2001), who used the name Polanów Samborzecki. A palaeopedological description of this site was provided by Konecka-Betley et al.(2006) and a palaeogeographical interpretation of micromorphological features of the loess-soil sequence was presented by Mroczek (2008, 2013). In 2009, palynological research results were presented for the lower part of the profile (Komar et al., 2009). A complex characteristics of the site based on multidisciplinary investigations was published by Jary (2007). In this work, the profile was documented in respect of its sedimentology, palaeopedology and stratigraphy while 10 samples were dated using OSL. Parallel TL dating of this profile has been carried out by Fedorowicz (2006)who obtained 10 TL dates from samples which were collected from positions similar to those in the Jary (2007)investigation. Independent luminescence research was carried out by Kusiak and Łanczont (2000) and Kusiak (2007, 2008) who dated 6 samples using the TL method.
To describe the Złota section, stratigraphic nomenclature system proposed by Kukla and An (1989), slightly modified by Marković and co-workers (2008) and recently extended to the whole Danube Basin (Markovic et al., 2015) was used.
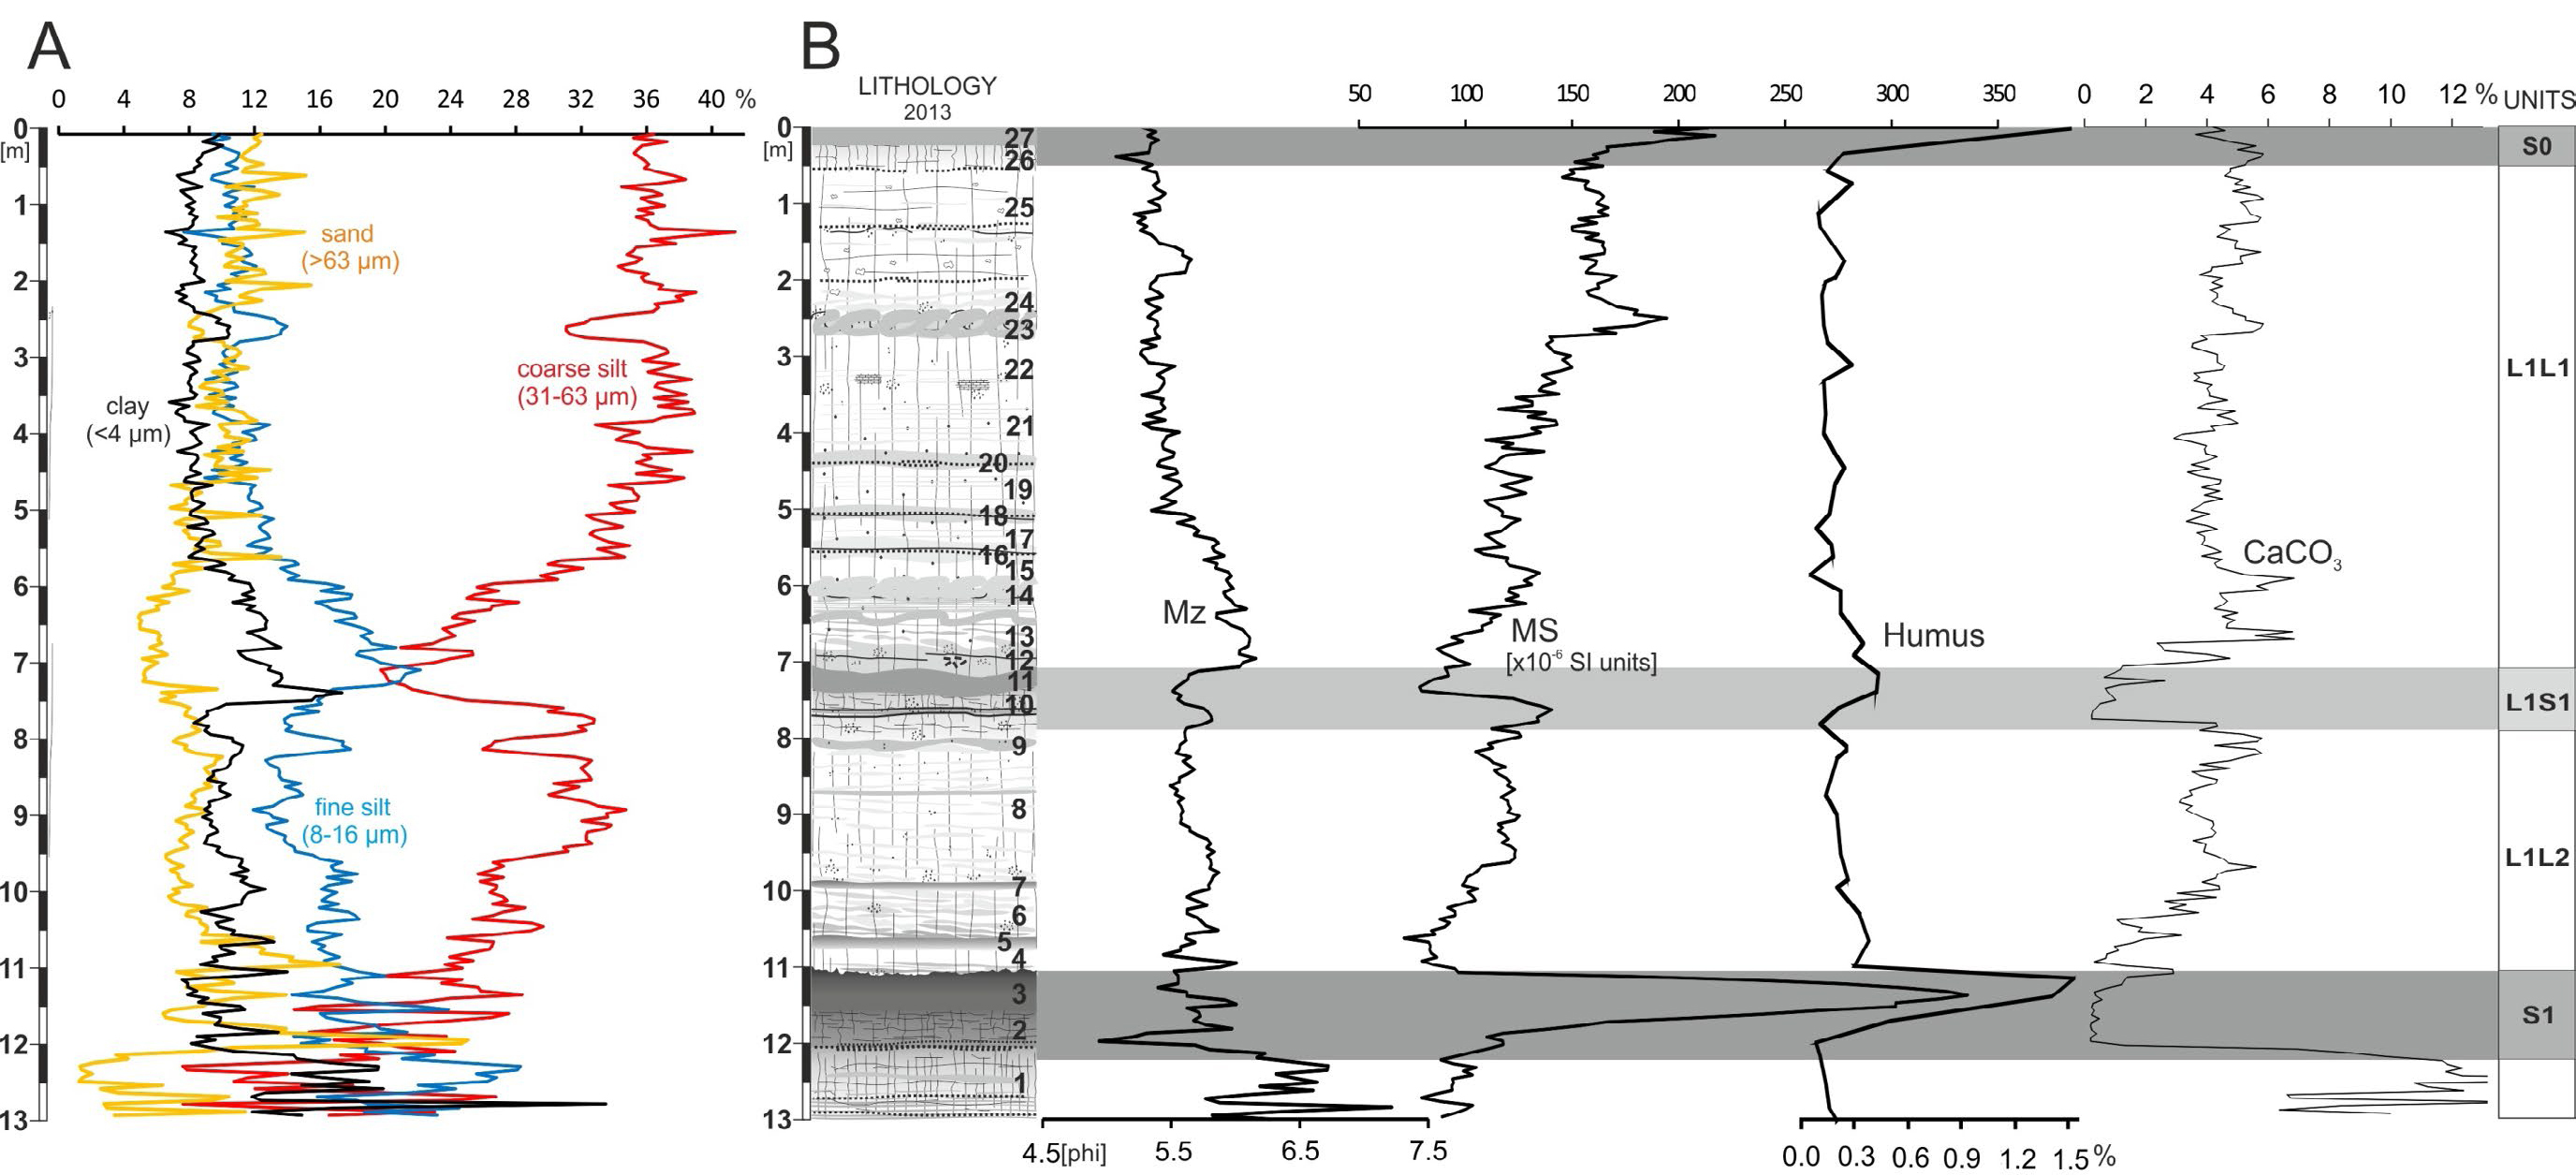
The loess-soil sequence in Złota consists of five units (Grygierczyk and Waga, 1993; Dolecki and Łanczont 1998, 2001): two polygenetic palaeosol complexes and two calcareous loess units developed in the Late Pleistocene, and recent soil developed on top of the younger loess (Fig. 2B and Fig. 3)
Fig. 2
A – grain size distribution. B – Reprinted from Moska et al 2015, with permission from Elsevier. Lithology, grain size distribution (MZ), magnetic susceptibility, humus and CaCO3 content for Złota loess section. Detailed lithological description is presented in Moska et al 2015.
The S1 pedocomplex correlated with Eemian and Early Weichselian (MIS 5)
This pedocomplex S1 is a basic pedostratigraphical unit that separates younger (Late Pleistocene) and older Middle Pleistocene loess. In Poland, it has been termed as Nietulisko I by Jersak (1973) or Gi+GJ1 soils according toMaruszczak (1991).
The S1 palaeosol complex in Złota is characterized by a parent material which was heavily processed (loess and alluvial loamy deposits in the lowermost part and just below the S1 complex) by the intense and prolonged soil forming processes.
The S1 pedocomplex consists of two main genetic horizons:
- a thick welded humus A horizon (chernozem type),
- a Bt horizon of a leached brown forest soil.
The dark grey humus A horizon of the granular structure is from 0.4 to 0.6 m thick within the Złota loess exposure. There are usually two welded humus subhorizons separated by a weakly noticeable erosion surface. Below this horizon, in some places, the remainders of eluvial and poorly preserved grey humus accumulation horizon of the forest soil can be seen. A thick, bipartite illuvial horizon occurs beneath the chernozem horizon. The upper part of Bt is brown with a characteristic prismatic or blocky structure. It is distinctly deformed by bioturbation. The illuviation process is marked by clay and iron oxide cutans on the surfaces of aggregates and the walls of macropores. The sharp boundary between upper and lower part of the illuvial horizon is expressed by a thin sandy layer. The record of illuviation processes is much weaker in the lower part of the B horizon.
Characteristic alluvial loam occurs in the lowermost part of the pedocomplex. This parent material was deposited with loess probably during the final phase of penultimate glaciations (MIS 6). The humus A and upper part of B horizons are decalcified. In the lowermost part of the S1 pedocomplex strong enrichment of carbonate is recorded (Fig. 2B).
Several stages of soil formation within the S1 pedocomplex in loess-soil sequence in Złota can be distinguished. The first stages are connected with forest type pedogenesis. Usually this type of soil forming processes is correlated with the Eemian Interglacial (MIS 5e). However, in the case of Złota, an Early Weichselian forest stage cannot be excluded. The final stages of a chernozem type pedogenesis are most probably related to both Early Weichselian Interstadials (MIS 5c and MIS 5a) or only to the last one.
The stages of S1 formation were interrupted by phases of cold continental climate. These cold and dry phases are recorded by wedge-like structures interpreted as cryogenic wedges with primary mineral infilling. Wedge-like structures in the Złota section are filled with dark, humic material derived from the chernozem horizon.
The period of the pedocomplex formation was terminated by a sudden climate deterioration. The topsoil parts are strongly eroded.
L1L2 loess unit correlated with the Lower Pleniweichselian (MIS4)
The lower loess unit (L1L2) is labelled in Poland as lower younger loess (LMd) by Maruszczak (1991) or younger loess Ila in the Jersak (1973) scheme. This loess unit is located between two soil complexes. L1L2 loess covers the S1 pedocomplex and its upper part is covered by L1S1 soil.
The considerable thickness of the L1L2 unit in the Złota exceeding 3 m and its diversity are connected with the location of this section in the marginal zone of the loess cover. The close proximity of the Wisła (Vistula) river valley and the presence of morphological edges favoured the processes of loess deposition and local redeposition.
Strong erosion boundary separates the L1L2 unit from the S1 unit. We can distinguish several incipient gley/humus horizons within the L1L2 unit, which confirms previous observations in Polanów Samborzecki (Dolecki and Łanczont, 2001; Dolecki, 2002; Jary, 2007). They have usually a limited extent and varied thickness from several to a dozen of cm.
The L1S1 pedocomplex linked to the Middle Pleniweichselian (MIS 3)
The L1S1 unit has been described in Poland as the Komorniki soil (Jersak, 1973) and Gi/LMd soil according to Maruszczak (1991).
The pedocomplex L1S1 is the most important within the Weichselian loess and corresponds to climate warming during the main phase of aeolian silt accumulation during the Last Glacial. LIS1 formation was created on the upper parts of the L1L2 loess, but there is no sharp border between those formations. The time of L1S1 formation was connected with strong reduction of accumulation of loess. The thickness of the L1S1 unit reaches 2 m in this section. It consists of relatively thick (ca. 20 cm) cambic horizon and gley soils (humic horizons), which are characterized by strong reduction of magnetic susceptibility value disturbed by the cryoturbation and gelifluction. The presence of initial forms of colloidal clay concentration in the cambic horizon in the neighbouring Polanów Samborzecki has been confirmed by micromorphological research performed by Mroczek (2008). The upper part of the L1S1 soil in Złota consists of carbonate, laminated loess and gley horizon deformed by periglacial processes. The lower part of L1S1 soil is carbonate-free and shows variation in different parts of the outcrop. Considerable diversity of the L1S1 soil has also been registered in the neighbouring Polanów Samborzecki by Grygierczyk and Waga (1993), and Dolecki and Łanczont (2001).
Most of the features of the L1S1 soil indicate a considerable role of transformation by soil processes. However, the morphological characteristics and the presence of periglacial phenomena suggest tundra-gley type of pedogenesis for the L1S1 soil. According to Jary (2007), the traces of earlier warmer stages of the L1S1 development were almost completely erased during long-lasting tundra period.
The L1L1 loess unit correlated with Upper Pleniweichselian (MIS 2)
According to the stratigraphic scheme proposed by Maruszczak (1991) the L1L1 loess unit consists of a middle younger loess (LMs) and an upper younger loess (LMg) which are divided by a weak gley soil sg-Gi/LMs. These three subunits may be correlated with only one loess unit (younger loess IIb) in the stratigraphic scheme defined by Jersak (1973).
The thickness of the L1L1 loess unit is usually very varied both on local and regional scale. There are six meters of loess (L1L1) in the section. The variability of the L1L1 loess thickness is mainly a result of the processes of syn- and postdepositional redeposition. It is recorded in the lithology of loess showing stable and unstable periods during the loess accumulation.
The most remarkable grain-size changes in the Złota loess-soil sequence occur in the lower part of this unit (directly above the Middle Pleniweichselian soil unit L1S1). These parts of the section are usually deformed by cryogenic processes and show evidence of slope redeposition.
The S0 soil developed during the Holocene (MIS 1)
The recent soil S0 occurs at the top of the L1L1 loess unit. Because of agricultural activity from the medieval time, we can only distinguish here a weak reworked humus horizon and a horizon with initial signs of pedogenesis below. Similar to the L1L1 unit the calcium carbonate content ranging from 4 to 6%. Based on those data we can assume that probably 2–3 m of the upper part of former loess in this place has been eroded. This erosion was connected with the agricultural activity for last few hundred years.
. Sampling and experimental details
Samples from the 13 m long loess profile were chosen for this study from the most characteristic profile section. The samples were taken from a vertical section, where full succession of glacial-interglacial record was found. Thin-walled steel tubes with diameter of 40 mm were used for sampling. At the same time, about 1 kg of loess was taken into plastic bags from around the tubes for gamma spectrometry.
In the laboratory, all samples were dried. High-resolution gamma spectrometry using a HPGe detector manufactured by Canberra was carried out in order to determine the content of U, Th and K in each sample. The measurements were performed for about 800 g of material placed in Marinelli beakers. Prior to measurement, the samples were sealed and stored for about least 3 weeks to ensure equilibrium between gaseous 222Rn and 226 Ra in the 238U decay chain. Each measurement lasted at least 24 hours. The activities of the isotopes present in the sediment were determined using IAEA standards RGU, RGTh, RGK. Conversion factors were used for dose rates calculation from Guerin et al. (2011).
Part of dose rate connected with cosmic rays was determined using Prescott and Stephan (1982) equation. For water content we assumed value of (15 ± 5)% because in this place the average water content in our opinion should not be higher than 20%. For fine grains, a mean a-value of 0.08 ± 0.02 was assumed (Rees-Jones, 1995). Average dose rates for both fractions were calculated and presented in Table 1.
Table 1
Sample names in the current study, specific activities of natural radionuclides, dose rates, calculated equivalent doses and ages for all investigated fractions using CAM model and laboratory codes.
For post-IR IRSL measurements polymineral fine grains were used (4–11 µm). Procedure of extraction was described by Moska et al. (2015). For our measurements, an automated Risø TL/OSL DA-20 reader was used. This model is equipped with a calibrated 90 Sr/90 Y beta source delivering 7.2 Gy/min. For optical stimulation IR LEDs emitting at 875 nm were used with the BG39/CN7-59/GG420 filter set.
Equivalent doses were determined using a post-IR IRSL protocol (Thiel et al., 2011) as follows:
Irradiation with the regenerative beta dose Di
Preheat at the temperature 320°C for 60 s
IR stimulation at the temperature 50°C for 200 s
IR stimulation at the temperature 290°C for 200 s
Irradiation with the test dose Dt (10% of the natural dose, but not less than 5 Gy)
Preheat at the temperature 320°C for 60 s
IR stimulation at the temperature 50°C for 200 s
IR stimulation at the temperature 290°C for 200 s
IR stimulation at the temperature 325°C for 100 s
Intensities measured in steps 4 and 8 were used for equivalent dose determination. For equivalent dose calculation, the first second of the signal was used and the background was estimated on the basis of the last 10 seconds of the OSL decay curve.
For several samples, a dose recovery test was carried out. Polymineral aliquots were bleached using external halogen lamp for 24 hours. Laboratory dose from 50 to 200 Gy were given to the grains after the bleaching and measured the standard post-IR IRSL290 protocol. For each sample a minimum of 5 different aliquots were investigated. The obtained results were satisfactory and were no higher than 1.15.
Thiel et al. (2011) recorded residual doses of about 20 Gy but also recognized that the post-IR IRSL290 ages may display a consistent overestimation when measuring loess, and Stevens et al. (2011) recorded residual doses of more than 40 Gy. For all investigated samples from Złota, the residual doses varied between 15 Gy and 25 Gy. All obtained equivalent doses using post-IR IRSL290 were corrected for the residual dose.
A laser diffractometer Mastersizer 2000 was used to determining the grain size distribution. Standard procedure was used with H2O2 and HCL treatment to remove organic matter and carbonates. In order to obtain better dispersion, sodium hexametaphosphate (calgon) was added to the solution before measurement. Summary of the amount of grains of different fractions can be found in Fig. 2A showing the percentage of the individual investigated fractions (<4 µm, 8–16 µm, 31–63 µm, >63 µm). Investigations of the aeolian particle dynamics have found that the coarse grain population, or coarse silt fraction, is generally transported by surface winds in short suspension episodes (Pye, 1987). This coarse aeolian population accumulates to form thick deposits in adjacent downwind areas. Conversely, the fine grain population, or fine silt and clay fractions, once off the ground, can be dispersed over a wide altitudinal band. It is mainly transported by an upper level flow, and is deposited far from the source areas (Pye, 1987, 1995).
For the Quaternary, loess-palaeosol sequences represent one of the most detailed terrestrial records of global and regional climate changes. Magnetic measurement techniques are widely used in present loess environmental studies, where the magnetic properties of soils are applied to the palaeoclimatic reconstructions based on susceptibility variations along loess/palaeosol sequences (Liu et al., 2004; Marković et al., 2015). Magnetic susceptibility measurements were carried out in the Department of Geological Processes of the Institute of Geology in Prague. Bridge for measurements of magnetic susceptibility KLY-2 was used with the following parameters: magnetic field intensity of 300 A.m –1, operating frequency of 920 Hz and sensitivity of 4× 10⁻⁸ SI. The standard error does not exceed 2%. Obtained results as raw data on mass-specific MS, expressed in m3/kg × 10–9, are plotted in Fig. 2B.
For analysing carbonates the Scheibler method (ON L 1084-99, 1999) was used, while and the Tiurin method (Tyurin, 1935) was used to calculate the organic substance contents.
. Results and discussion
The S0 (modern) soil is characterised by atypical abundance of the calcium carbonate content for well-developed soils (close to zero) because the area where the profile is located was intensely used agriculturally, which in conjunction with the sloping top led to a clear reduction of the modern soil. This is also reflected by the carbonate content in this unit, which is similar to that in the loess located just below (Fig. 2B). The grain-size characteristics show that grains of diameter 31–63 µm are dominant in this unit. The S0 soil is also characterized by the high value of humus exceeding 1% and a very weak signal from magnetic susceptibility. The results of post-IR IRSL dating (Złota 21) are very close to the OSL dating results presented before (Moska et al., 2015).
The thickness of the L1L1 unit reaches 6 m. Fig. 3 shows the lack of significant differences between this thickness in Złota and Polanów Samborzecki. One of the characteristic features of this unit is a considerable amount of calcium carbonate (4–6%) - the highest among the Late Pleistocene loess in Poland (Fig. 2A). This high value of calcium carbonate content is a proxy of relatively high loess accumulation. According to Jersak (1973), this may also indicate the degree of continentality of the loess sedimentary environment. However, the content of calcium carbonates is not constant and many alternating enrichment and depletion zones can be observed. This kind of significant differences can be connected with different growing rate of loess accumulation. The reason for this differentiation is most likely associated with the availability of fresh silt in the short distance from loess alimentation areas (cf. Antoine et al., 1999, 2001, 2009; Vandenberghe and Nugteren, 2001; Vandenberghe et al., 2013). In this unit, we can also see some evidence of short climate variations, which is characterized by several weak tundra-gley horizons, the most important of which is located about 2.5 m below the present surface.
Fig. 3
Correlation of the Late Pleistocene loess–palaeosol stratigraphic units in Złota and Polanów Samborzecki. Comparison of new OSL dates with previous results. Obtained OSL results in some cases are quite different as compared with the OSL and TL dates obtained during last 10 years by other authors and presented in previous publications relating to this loess profile.
The increasing content of coarse silt coincides with decreasing trend of fine silt (8–16 µm) and an increasing trend of sand (>63 µm) percentages towards the top of the profile. There are several sandy layers within the L1L1 loess unit in Złota indicating the severe conditions during the L1L1 accumulation. The average content of clay (<4 µm) is relatively stable ranging from 6 to 10%.
The obtained luminescence dates for this unit (samples Złota 21-Złota 10), are very similar and oscillate in the range of 22–26 ka. Analysing the depth model shown in Fig. 4, it is evident that this unit accumulated rapidly indicating climate conditions very favourable for loess accumulation. The age-depth model is also a good instrument for loess sedimentation rate calculation. In this case this sedimentation rate is about 1 mm per year which is similar to other places in Europe where this kind of measurements were made for loess deposits (Frechen et al., 2003; Antoine et al., 2009; Stevens et al., 2011; Ujvari et al., 2014). The earlier luminescence analyses using TL (Fig. 3) indicated a much longer loess accumulation while the results of Kusiak and Łanczont (2000) are clearly overestimating the age of this stratigraphic unit.
For the 2 m thickness of the L1S1 unit, as expected, differences in grain size distributions are seen. For the examined samples, the contents of clay (4 µm) and fine silt (8–16 µm) are higher in the palaeosol layers than that in the loess units, whereas the contents of coarse silt (31–63 µm) and sand (>63 µm) are lower in the palaeosols than that in the loess layers. Also, humus content is slightly higher compared to the L1L1 unit and CaCO3 concentration reaches almost 0% which is characteristic for typical soil units (Fig. 2B).
The obtained luminescence dating results for this section (Złota 9 and 8) are different from the previously obtained OSL results (Moska et al., 2015), however they very well agree with the results obtained for other loess profiles (Biały Kościół, Tyszowce), also obtained using post-IR IRSL for the same unit L1S1. The result 33.4 ka for the sample Złota 9, which was taken from the upper part of L1S1 agreed very well with radiocarbon dates for this soil (31.8 ± 0.6 ka cal. BP Moska et al., 2015), as well as results presented by Antoine for other locations in Europe.
Antoine et al. (2013), during loess research in the Czech Republic, found that a similar soil complex was formed about 30.6 ± 0.4 ka ago using the radiocarbon method in loess deposits in Dolni Vestonice. Antoine et al. (2009) also confirm the stratigraphy for the Nussloch loess profile where this unit was dated at 30.5 ± 0.7 ka cal. BP using the radiocarbon method and about 34.0 ± 5.0 ka using the IRSL method.
Below the L1S1 unit down the profile the L1L2 is identified. The calcium carbonate content increases towards the top of the L1L2 unit in contrast to the organic matter content. One of the characteristic features are several subunits which are secondarily enriched in calcium carbonates with their contents exceeding 6% (Fig. 2B). The grain size distribution is highly variable in the lower part of the L1L2 unit and usually tends to be more homogeneous toward the top. The average particle size also increases upwards. The characteristics of the L1L2 loess unit in Złota indicate that it was formed as a result of simultaneous processes of aeolian deposition and slope reworking. With time, the dynamics of slope processes decreased and the rate of accumulation of dust relatively increased. The initial gley horizons observed within the L1L2 unit differentiate this unit into several stratigraphic subhorizons. They may evidence short-term, climate induced cyclic changes in loess deposition (Jary, 2007; Jary and Ciszek, 2013).
Four post-IR IRSL dates were obtained for this unit (Złota4, Złota5, Złota6, Złota7). The ages about 60 ka are similar to those obtained for this unit in Biały Kościół and similar in the upper part to those abstained by Kusiak and Łanczont (2000) for Polanów Samborzecki using the TL method. The bottom part of this unit is about 20 ka younger than indicated by the previously published TL ages (Kusiak and Łanczont, 2000; Fedorowicz, 2006). It should be noted that Jary (2007) obtained an unexpected age inversion for this unit using the OSL method. The ages increase with depth and the obtained results post-IR IRSL defining the period of that loess accumulation to fall between about 63 and 67 ka. The results are about 20–30% higher that OSL results from the same samples (Moska et al., 2015). The result for sample Złota4 taken from the loess directly above the erosion boundary of S1 indicates a loess formation period in the Lower Pleniglacial (MIS 4; GS-18-19, Rasmussen et al., 2014) which would suggest underestimation of the dating results for the medium quartz grain size fraction (Moska et al., 2015).
In the lowest and the oldest part of the investigated loess profile, a sequence of a fossil soil (S1) and a well-developed illuvial horizon was formed. In the S1 pedocomplex we can observe typical values of organic matter and the MS which are characteristic for well-developed soils. That is why MS reaches here the maximum values similar to the amounts of organic matter. Calcium carbonate content is zero in A and B horizons, but close to the border between S1 unit and alluvial sediments strong carbonate enrichment is recorded. The amount of organic matter in the S1 pedocomplex is the highest in the entire loess-soil sequence with the exception of the uppermost part altered by Holocene pedogenesis. The maximum humus content was found in the superimposed chernozem horizon (up to 1.5%). The amount of organic matter gradually decreases downwards (Fig. 2B). Only one result was obtained from this unit, the age 101.4 ± 6.2 ka fits very well with that expected from the geological point of view. This result is also about 20% higher than for quartz grains and OSL method (Moska et al., 2015). The obtained results are similar to those obtained for this region, Biały Kościół (Moska et al., 2012) and Dolni Vestonice in the Czech Republic (Antoine et al., 2013); also Fedorowicz et al. (2013) report similar results for Korshiv (Ukraine) loess profile and Meszner et al. (2013) for Saxony in Germany. Alluvial loam which is located just below the S1 unit was deposited probably during MIS6, during the final phase of penultimate glaciations. According to Kukla et al. (1997), these sediments should be no younger than about 130 ka. Two samples were taken from these deposits (Złota1 and Złota2). The obtained results 142 ± 9 ka and 150 ± 12 ka (Fig. 3) indicate that the post-IR IRSL ages agree with the basic stratigraphic units and geological interpretation, compared to OSL results using quartz, which are underestimated (Moska et al., 2015).
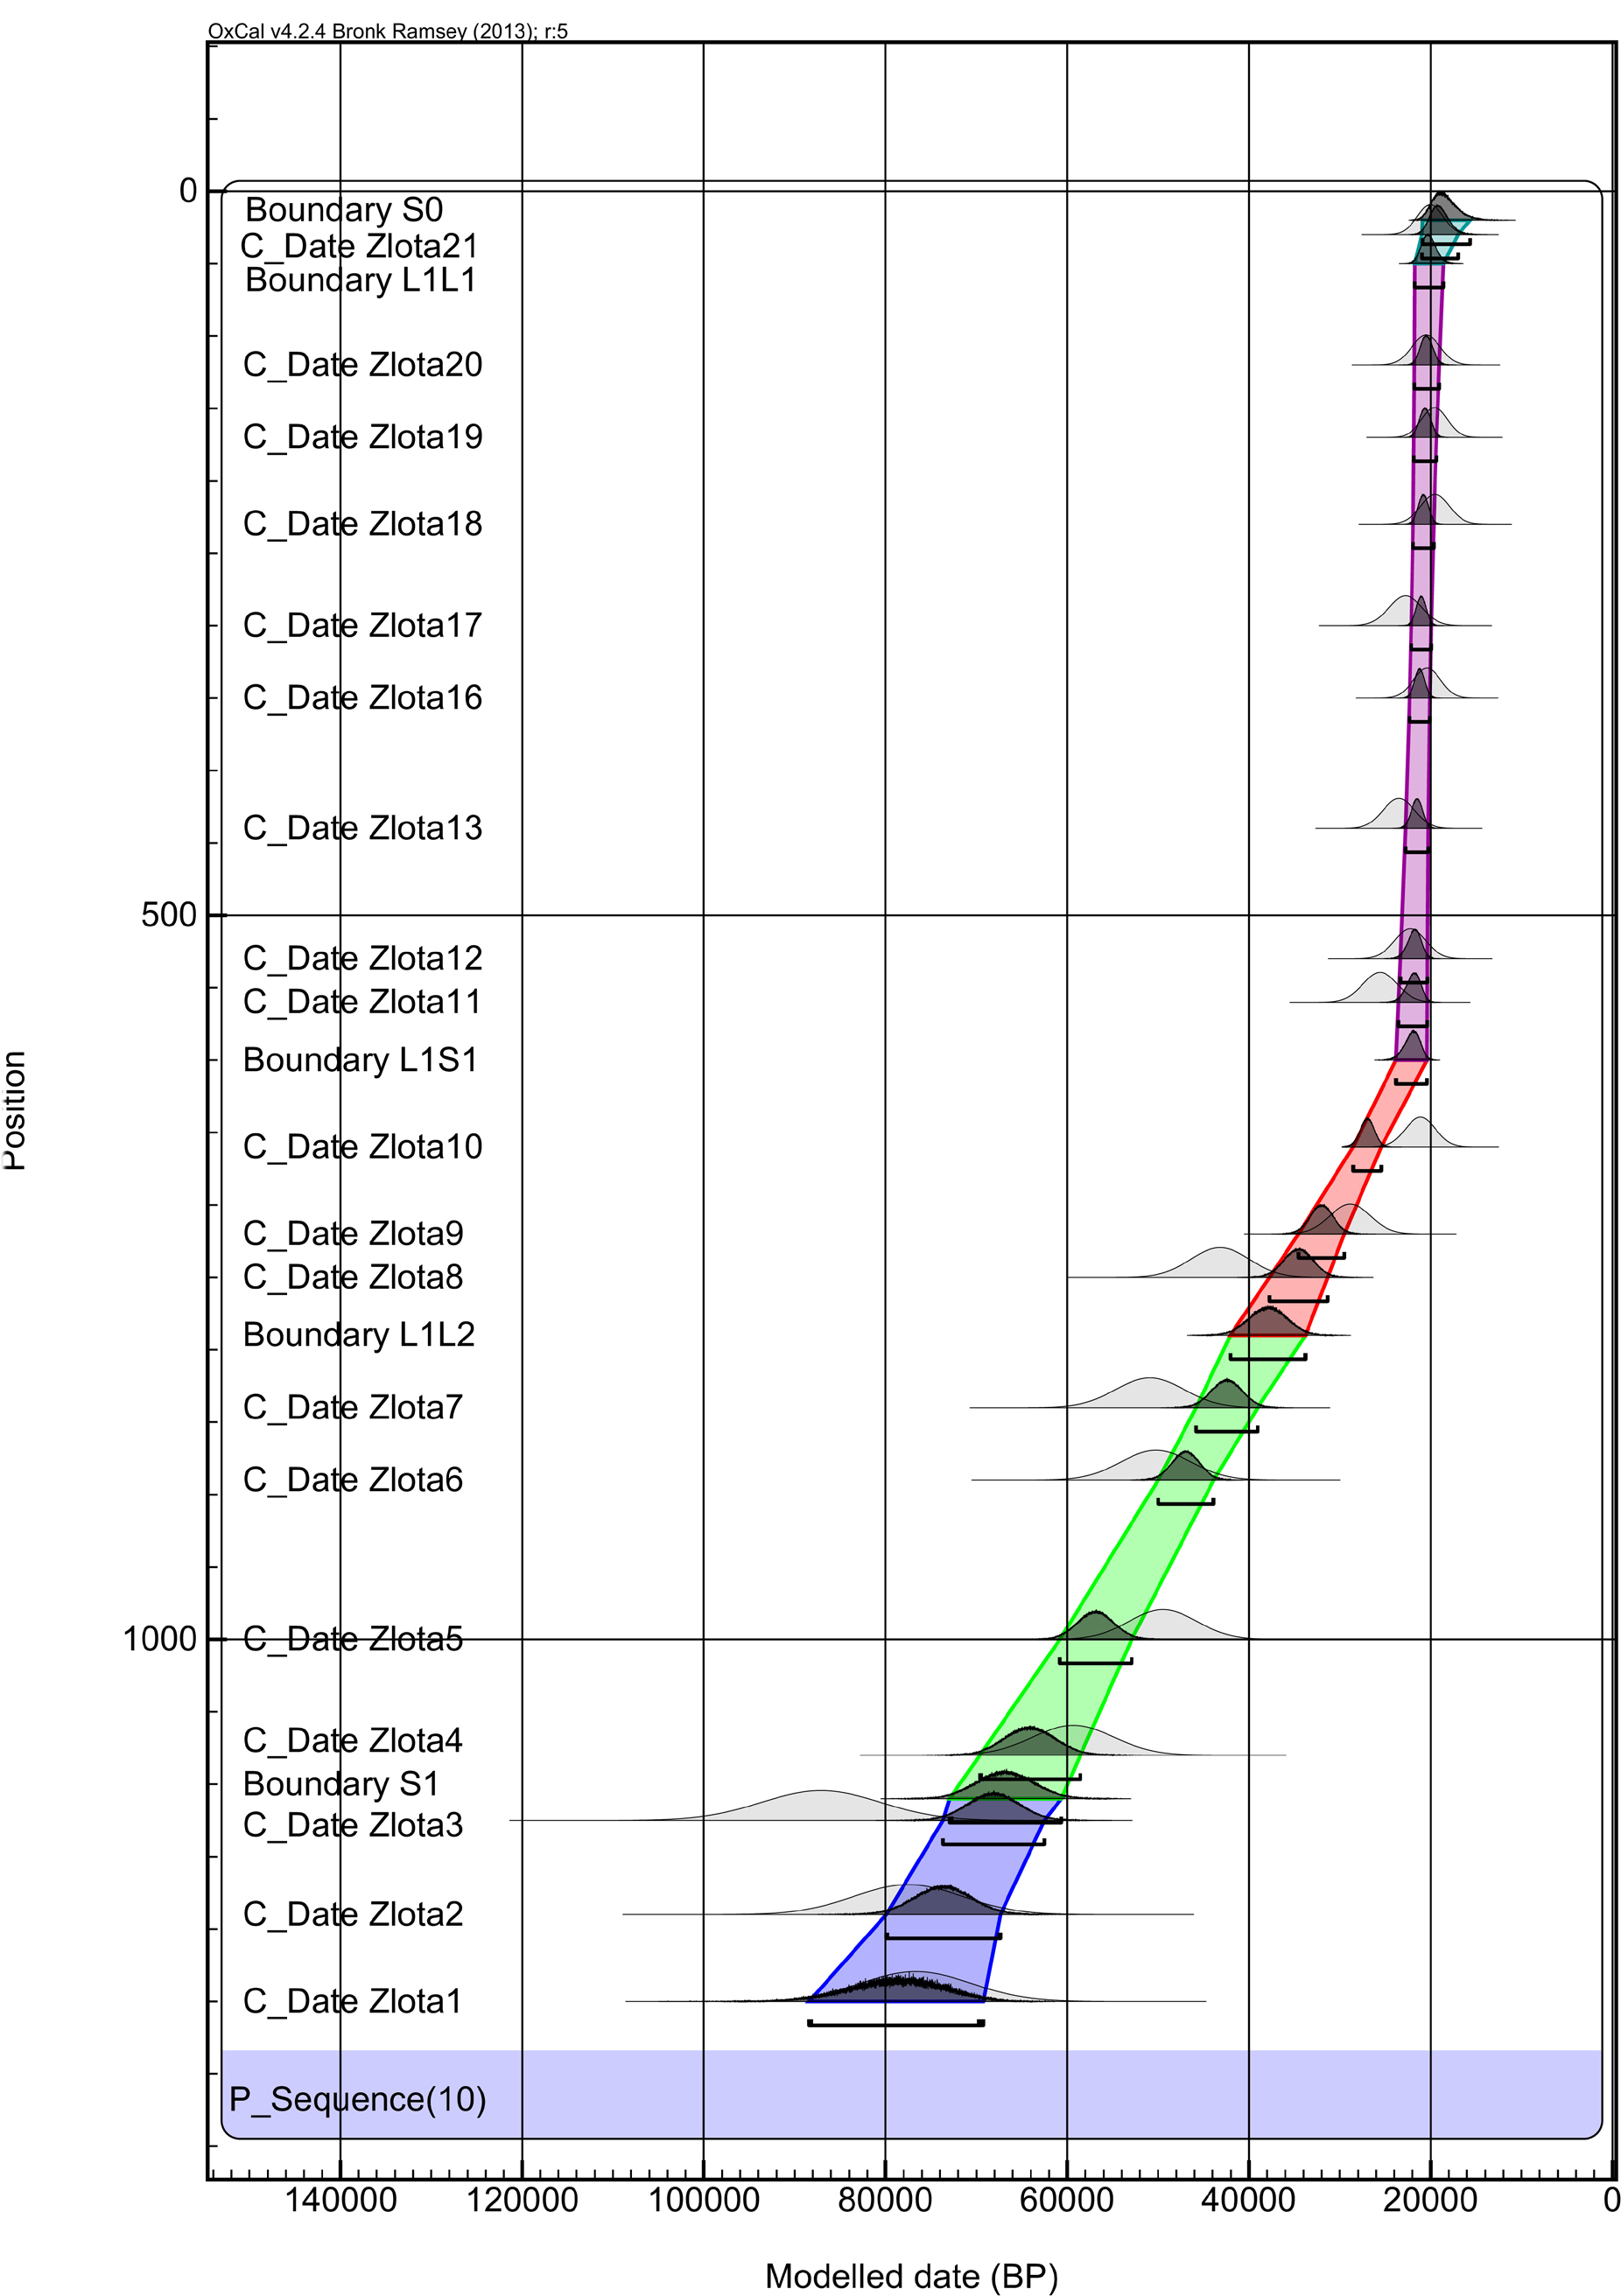
The post-IR IRSL dates were used also to produce an Oxcal (Bronk Ramsey, 2009; Bronk Ramsey and Lee, 2013) age depth model (Bayesian accumulation histories for deposits). The Oxcal model can work with radiocarbon dates as well as other dates on the calendar scale, such as luminescence ages (see Fig. 4)Oxcal divides a core into many thin vertical sections (the default resolution is 0.5 cm), and through millions of Markov Chain Monte Carlo (MCMC) iterations, estimates the accumulation rate (in yr/cm; so more correctly, sedimentation times) for each of these sections. The implementation of the age-depth model for the investigated profile is in our opinion fully justified due to the number of obtained results. Fine grain sized fraction is the most representative because the results obtained for the lower part of the profile are closest to the stratigraphic interpretation of the location. In the presented model, we define characteristic boundaries between the stratigraphic units which can be justified by their different character and hence possibly a completely different rate of sedimentation. The obtained model clearly shows the concept of creation of the sediment at this location during the last 100 ka. We see the characteristic, very rapid sedimentation of the loesses for L1L1 at the level of 1 mm per year. The model also shows a shift of the periods of loess accumulation towards older results (assuming a constant deposition rate for one area), which, at least for the deeper parts of the profile, correlates better with the Rasmussen et al. (2014) chronostratigraphic model.
. Conclusions
The loess–palaeosol sequence in Złota is one of the most important sequences in Poland. This site is representative for this part of Poland. The five main units characterize this section from the sedimentological-pedological point of view.
The magnetic susceptibility changes are characteristic for typical loess profiles which contain fossil soil and loess formations all over the world. The maximum value of MS is observed for very well developed S1 unit while the minimum values appear for the periods of rapid accumulation of loess. Luminescence results obtained in this study are in concordance with stratigraphic boundaries, grain size distribution and magnetic susceptibility variation.
We observe a high consistency of luminescence results between the Biały Kościół (Moska et al., 2012) and Złota loess profiles. Section L1L1 is represented by 6 meters of loess deposits which was created during relatively short period about 3–5 ka, the age boundaries for unit L1L1 are the same for Złota and Biały Kościół. We notice that at the time of formation of the L1L1 unit in east central part of Poland there were good conditions for loess accumulation. Using Oxcal age-depth model sedimentation rate was calculated close to 1 mm per year and is very similar to results obtained for the site Nusloch by Antoine et al. (2009) and about 30% higher than for Biały Kościół section.
Results for the one of the most important markers in the profile-L1S1 section with the fossil soil are very similar to those obtained for similar sections in Europe.
Similar to our investigation for the loess section in Biały Kościół (Moska et al., 2011, 2012), the L1L2 section is represented by considerably thick lower younger loess and obtained result is similar to results for the Biały Kościół and Dolni Vestonice in Czech Republic (Antoine et al., 2013).