
. Introduction
East coastal area of Fujian province, centring on the Funing bay, is a major concentrated area of Neolithic culture sites in the middle and lower reaches of Min River which is the longest river in Fujian province of China, with largest water and most extensive area. A large number of neolithic remains were found around this area. Those sites are the firsthand evidence for long-term use of marine resources and coastal environments in human evolution and subsequent development which is vital to understanding patterns of human subsistence (Nian, et al., 2015). In recent decades, several neolithic sites were
discovered and excavated in Xiapu county, east coastal area of Fujian (Fujian provincial museum, 2017). Of particular significance is the Huangguashan Neolithic culture (4300–3500 cal BP) (Lin, 2012; Fan et al., 2014). For instance, Huangguashan site was discovered in 1987 and excavated in 1989 and 2002, respectively. Pingfengshan site, about 8 km from the Huangguashan site, was discovered in 2014 and excavated in 2016 (Fujian provincial museum, 2017). The above-mentioned sites show a similar cultural feature and were named Huangguashan culture by archaeologists. However, no older sites, such as Tanshishan culture sites (5000–4300 cal BP) and Keqiutou culture sites (6000–5500) which is the typical cultures in Taiwan Strait (Fujian and Taiwan), were discovered in this area so far. Is this phenomenon due to the human initiative migrations or regional resource and environment restriction? There is no final conclusion.
The modern topographic features of the research area are mainly showed by coastal plains, ocean bays and winding shorelines. And the palaeoenvironment changes of regions to the north and south of Fujian show a remarkable difference since the early Holocene which can influence the transformation of Neolithic archaeological sites in this area (e.g. Zong , 2004; Ma et al., 2016). Yet, although correlational studies of this area have made solid progress (e.g. Rolett et al., 2011), the high-resolution studies of environmental change and Neolithic cultural response among the east coastal Fujian are completely lacking.
This study aims to fill the gap in our knowledge of the coupling relationship between regional environmental change and Neolithic cultural response of South China. The study in German North Sea coast of Zhang et al. (2014) shown that the optically stimulated luminescence (OSL) dating of quartz is a powerful tool for dating coastal sediments. In this paper, the OSL dating method was employed to quartz (38–63 μm) in coastal sediments from the coast of Funing bay, Fujian China. Sea-level change can influence shifts in settlement pattern and elicit population movement in period of Neolithic cultural (Bailey and Flemming, 2008; Rolett et al., 2011; Jin et al., 2017a). Here we investigate the relationship between sea-level change and different civilisations in both sides of Taiwan Strait (Fujian and Taiwan) in combination with other relative research results, which is conductive to understanding the human-earth coupling relationship, such as environmental change and cultural response among coastal Fujian Neolithic cultures, the emergence of early systematic seafaring and the transmission routes of Austronesian languages.
. Materials and methods
The Funing bay is a silty coast and located in Xiapu County, the east coastal area of Fujian province in southern China about 2 km far away from East China Sea rim (Fig. 1). We collected two cores from Funing bay (Table 1). The core FN1 and FN2 are located in intertidal zone and supratidal zone, respectively. The core FN1 (N26°48'52.567", E120°01'19.486") was located about 2 km from the Pingfengshan Neolithic site (N26°48'36.630", E119°59'44.399"). The core FN1 is up to 15 m deep and contains a sediment record from around 55 ka before present until the present. The top half (0–7 m) of the FN1 core have a continuous sediment record from around 7 ka until the present. This time period spans the entire Neolithic era of the Fujian archaeological sequence.
Fig. 1
Map showing the sampling location and the terrain features of research area. The yellow squares represent the typical sites of North Fujian.
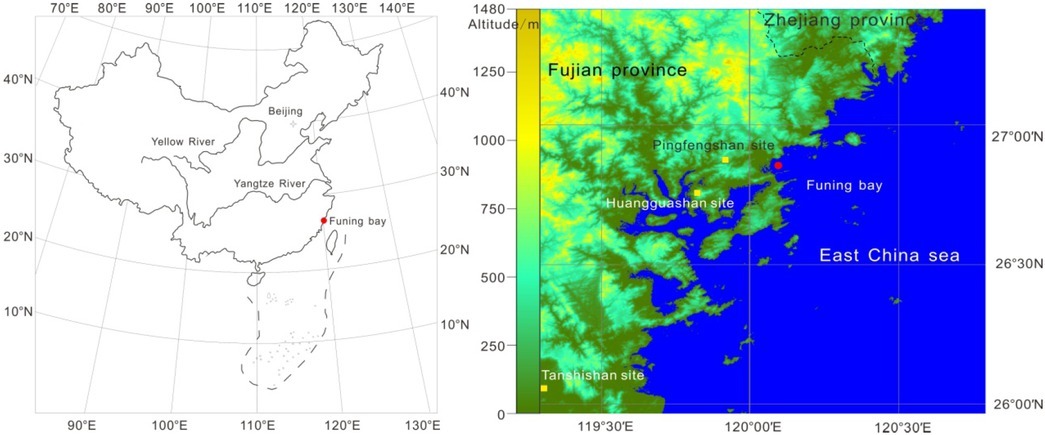
Table 1
Sampling location, altitude and lengths of the Funing bay sediment cores and Neolithic sites.
Optically stimulated luminescence (OSL) dating of quartz has been used successfully and revolutionized since the early 2000s, and this technique can be applied to estimate depositional age of the sediments in different sedimentary environments (Aitken, 1998; Wintle and Murray, 2006). The core chronologies are based on 17 quartz-OSL age data of the sediments.
All sample preparation was conducted under subdued red light. The middle part of sediment in each tube was pretreated with 10% HCl to remove carbonates and with H2O2 to remove the organic matter. The 38–63 μm fractions were etched with 40% HF for 40 minutes to dissolve feldspars and subsequently treated with 10% HCl to remove acid-soluble fluoride precipitates. The purity of the extracted quartz grains were checked using IR stimulation. The single aliquot regenerative dose (SAR) protocol (Murray and Wintle, 2000) was applied to purified medium-grained quartz (38–63 μm) OSL measurement.
Samples were dated by OSL laboratory of Fujian Normal University. OSL measurements were undertaken using an automated RisØ-TL/OSL DA-20C/D reader with 7.5 mm Hoya U-340 filters (290–370 nm) in front of an EMI 9235 QA photomultiplier tube. Irradiation was provided by a 90Sr/90Y beta source (Bøtter-Jensen et al., 2003). Neutron activation analysis (NAA) was employed to determining the contribution of U, Th and K by China Atom Science Research Institute. The water contents are measured using the core samples after the core has been taken back to the laboratory.
In order to understand the grain-size distribution of the sediment, the sediment samples at intervals of 10 cm were analyzed by a Malvern Mastersizer 2000 laser particle size analyzer. 30% hydrogen perocide (H2O2) and 10% dilute hydrochloric acid (HCl) were used to remove organic material and carbonates. And the samples were dissolved in 0.05 mol/L sodium hexametaphosphate ((NaPO3)6) solution to disperse the samples, then the solutions were measured after ultrasonic desaggregation for 10 s on the machine.
. Results
FN1 core stratigraphy and sediment characteristics
The FN1 core consists of silt and sandy material. As a whole, the core can be divided into three different stratigraphic stages (Fig. 2). The uppermost 700 cm of sediments (unit A) are similar to neritic deposit and consists of clayey silt of grey colour (5Y4/1), silt of light grey (5Y7/1). and two ~50 cm wide horizons at depth of 1.5~2 m and 2~2.5 m showed an obvious change in sediment colour and grain-size in contrast to adjacent sediment to thin-bedded clay of grey colour (5Y4/1) and medium sand of yellow colour (2.5Y8/6). They are connected with small steps in sea-level changes, indicated secondary transgression (high sea level) and regression (low sea level), respectively. The OSL samples PFS001 ~ PFS007 were taken from this unit.
Fig. 2
Lithology and grain-size characteristics of FN1 core at Funing bay, Southeast China. And FN1 and FN2 core are located in intertidal zone and supratidal zone, respectively. (a) The distribution of median diameter with depth. The solid circles on FN1 lithology column represent the sampling location of OSL samples. (b) The distributions of different cumulative percentage composition with depth. (c) The sorting coefficient of sediment.
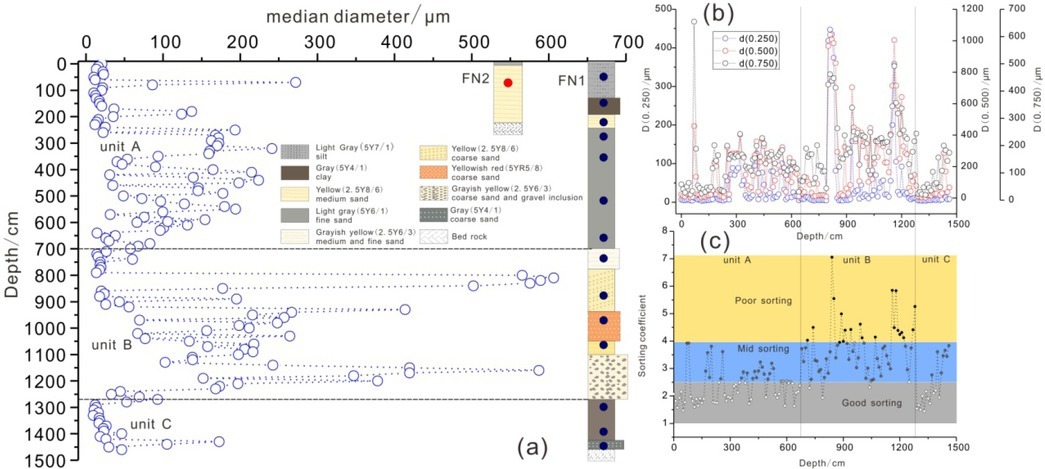
The boundary between the clay silt of the uppermost unit A and the second unit B is visible at the depth of ~700 cm. Sediment composition changes abruptly and a significant step has developed in the unit B (Fig. 2a). The material is incompact and is characterized by the occurrence of various grain-size and colour sandy sediment (Fig. 2a). Specifically, the grain-size and colour of sediment (unit B), in order, are greyish yellow (2.5Y6.3) medium and fine sand, yellow (2.5Y8/6) coarse sand, yellowish red (5YR5/8) coarse sand, yellow (2.5Y8/6) medium sand and greyish yellow (2.5Y6/3) coarse sand and gravel inclusion. Four OSL samples (PFS008 ~ PFS011) were taken from the sand layers in different grain-size within unit B, respectively. There was no OSL sample obtained from the layer at depth of 1100–1270 cm because the loose stratum with coarse sand and gravel inclusion is not suitable for OSL dating, which is very likely exposed in the procedure of drilling sediment core.
The boundary to the lowest unit C of the FN1 core is sharp and occurs at depth of ~1270 cm (Fig. 2a). This unit mainly consists of clay of grey colour (5Y4/1). In addition, coarse sand of grey colour (5Y4/1) also occurs below the clay layer. There were three OSL samples (PFS012 ~ PFS014) were acquired from this unit.
The bed rock of granite was found about 1450 cm below the unit C at the bottom of FN1 core.
The results from grain-size analyses show that the sorting coefficient of unit A and C are good-mid sorting, and the value of unit B is poor-mid sorting (Fig. 2c). In addition, the grain-size of different accumulated percentages can also indicate the sediment phase changes in three stratigraphic units (Fig. 2a/b).
Luminescence characteristics and quartz-OSL chronology
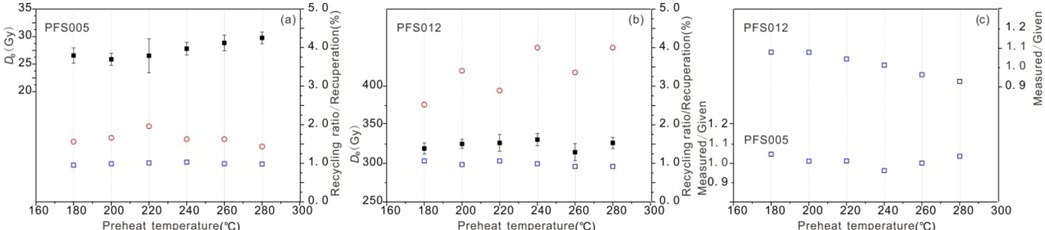
Fig. 3 shows the results of preheat plateau, recycling ratios, recuperation and dose recovery for PFS005 and PFS012. For sample PFS005, the result of the preheat plateau test suggests that the dose measurement is sensitive to the preheat temperature. The Des slightly increased for the preheats of 240 and 280°C. For sample PFS012, the Des slightly decreased for the preheats of 240 and 260°C. Additionally, negligible thermal transfer was detected for preheat between 180 and 240°C. Dose recovery experiment was applied to the samples with medium quartz grains that were bleached by SOL2 solar for 8 hours, and a known laboratory dose of 95.26Gy was recovered using the SAR protocol. The ratios of measured and given dose for selected sample PFS005 and PFS012 were 1.05 (preheat 220°C) and 1.03 (preheat 240°C) from six aliquots, respectively.
Fig. 3
Luminescence characteristics. (a) and (b). Solid squares display equivalent dose as a function of preheat temperature for the medium grained quartz for the sample PFS005 and PFS012, respectively. Open squares and circles refer to the recycling ratios and recuperation values. (c). Dose recovery test data for sample PFS005 and PFS012.
Based on the results of preheat plateau test and dose recovery test, a preheat at 220°C (10 s) and a cut heat at 180°C (10 s) were used for samples (PFS001-PFS008, PFS015), and a preheat at 240°C (10 s) and a cut heat at 200°C (10 s) were selected for the rest of samples (PFS009-PFS014). Then samples were stimulated by blue light at 130°C for 40s. The first 1.6s of the initial OSL signal minus a background estimated from the last 16s OSL signal was used as a measurement of the last component for De estimation.
Fig. 4a–4c shows the decay curves of natural OSL for sample PFS001, 002 and 005. The OSL signal decreases very quickly during the first second of blue light stimulation, indicating that the decay curves are typical for quartz and seem to be predominated by the fast component (Bailey et al., 1997; Jain et al., 2003). The dose representative growth curves are shown in the Fig. 4d–4f. The dose representative growth curves are well represented by exponential fitting with six regeneration dose points, including a zero-dose for testing recuperation and a recycling point for assessing the sensitivity change correction (Murray and Wintle, 2000). The recycling ratios are in the range of 0.9–1.1 and the recuperation values lie below 5%. These statistics suggest that the SAR protocol with medium-grained quartz can be used to establish a dependable chronology for the deposit of FN1 core. Fig. 4g–4i displays the Des distributions for three samples. Dose rate data determined by neutron activation analysis (NAA) are shown in Table 2. The histogram of De distribution suggests that these samples are normally distributed which indicate the quartz grains were completed bleached by sunlight before deposition. So the central age model (CAM) of Galbraith et al. (1999) was used for age calculation and the age results of FN1 core are shown in Table 2.
Fig. 4
Luminescence characteristics. Typical natural OSL decay curves (a–c) using the SAR procedure for mid-grained quartz of sample PFS001, PFS002 and PFS005. The OSL dose response curves (d–f) are plotted from all aliquots of each sample. Radial plots showing how broad the distribution of the De values of sample PFS001 (g), PFS002 (h), and PFS005 (i). The resultant De value of the central age model (Table 2) is shaded.
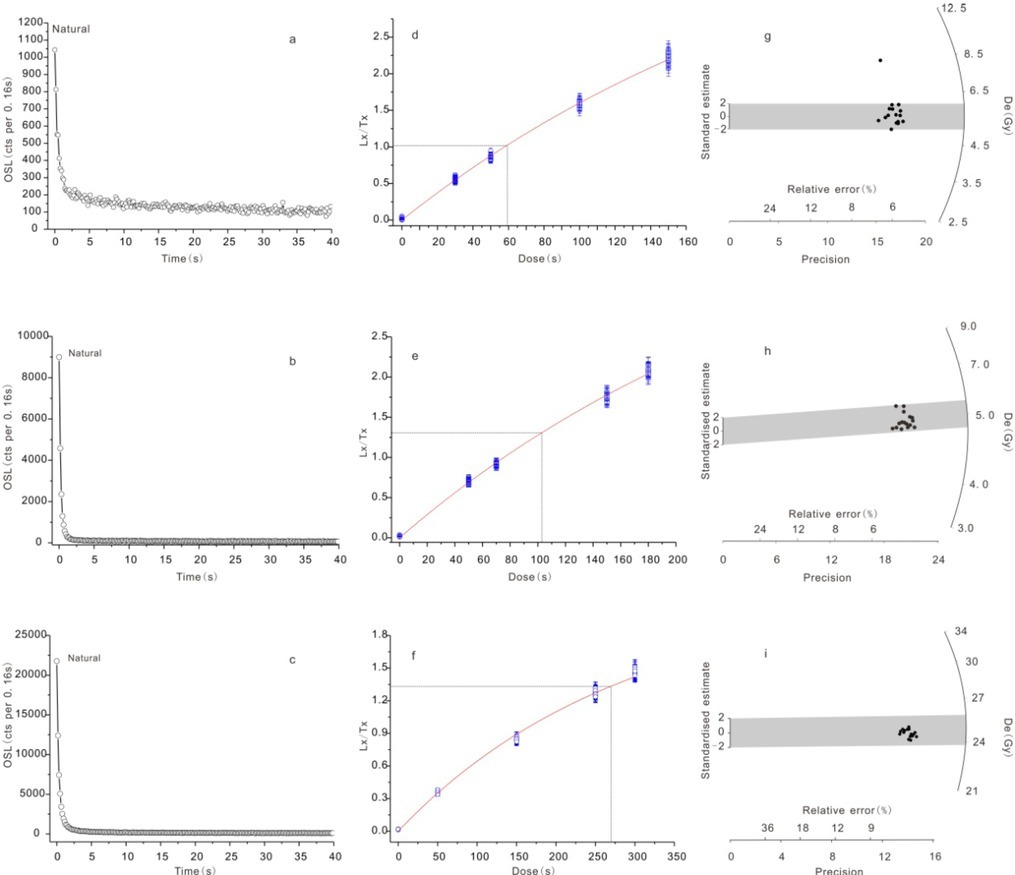
Table 2
The OSL data of FN1 and FN2 cores at Funing bay, Southeast China.
. Discussion
Reliability of quartz-OSL ages
As what mentioned before, the laboratory parameters such as preheat, recycling ratios and recuperation of medium-quartz indicate that those OSL signals are fit for De determination (Long and Shen, 2015; Jin et al., 2017a). According to the relationship between OSL age and depth for the FN1 core, it can be seen that the 14 OSL ages show a well consistency with sequences universally yielding ages in stratigraphic succession. Moreover, in order to further verify the reliability of quartz-OSL ages in this area, 4 OSL samples were collected from the cultural layers of Pingfengshan site. The results of ages comparison are shown in Table 3 and Fig. 5. The comparison of OSL and AMS 14C dating of the layers from Pingfengshan site suggests that the two dating technique agree well for the Holocene samples (Fig. 5). Considering of the depositional characteristics of slop wash and measurement accuracy of OSL technology, we think that the OSL data are reliable.
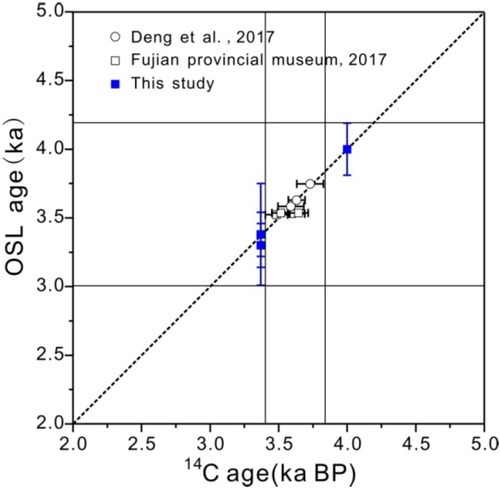
Table 3
AMS 14C and OSL dating results from Pingfengshan site.
| Site | Laboratory code | Context NO. | Sample type | Calibrated (2σ range) date | Reference |
|---|---|---|---|---|---|
| Pingfengshan | Beta-434875 | Layer 3 | charcoal | 3565–3403 cal. BP | Fujian Provincial Museum, 2017 |
| Beta-434876 | Layer 4 | charcoal | 3691–3495 cal. BP | ||
| Beta-434877 | Layer 5 | charcoal | 3582–3450 cal. BP | ||
| Beta-434878 | Layer 5 | charcoal | 3716–3572 cal. BP | ||
| UGAMS#27094 | Layer 3 | rice | 3692–3570 cal. BP | Deng et al.,2017 | |
| UGAMS#27093 | Layer 4 | rice | 3684–3494 cal. BP | ||
| UGAMS#27092 | Layer 5 | rice | 3826–3632 cal. BP | ||
| FNU2016003 | Layer 4 | quartz | 3.38 ± 0.37 ka | This study | |
| FNU2016004 | Layer 5 | quartz | 4.00 ± 0.19 ka | ||
| FNU2016008 | Layer 4 | quartz | 3.38 ± 0.16 ka | ||
| FNU2016009 | Layer 4 | quartz | 3.30 ± 0.16 ka | ||
Evolution of the FN1 depositional environment
The ages and grain-size results identify three distinct environmental units in the transformation of the Funing bay and the coastal area of north Fujian (Fig. 6a). Meanwhile, the sketch maps of shoreline change of research area at several typical given times are shown in Fig. 7. We interpret the finding by comparison with the results of previous palaeoenvironmental studies (eg. Zeng, 1991; Lambeck et al., 2002; Lea et al., 2002; Jin et al., 2017a).
Fig. 6
The chronology of FN1 core and compared with fluctuation of sea level. The dash lines in 6a and 6b represent the global sea level change (Lambeck et al., 2002) and the sea level change of North Fujian (Zeng, 1991), respectively. The red cycle in 6b represents the age of corn FN2.
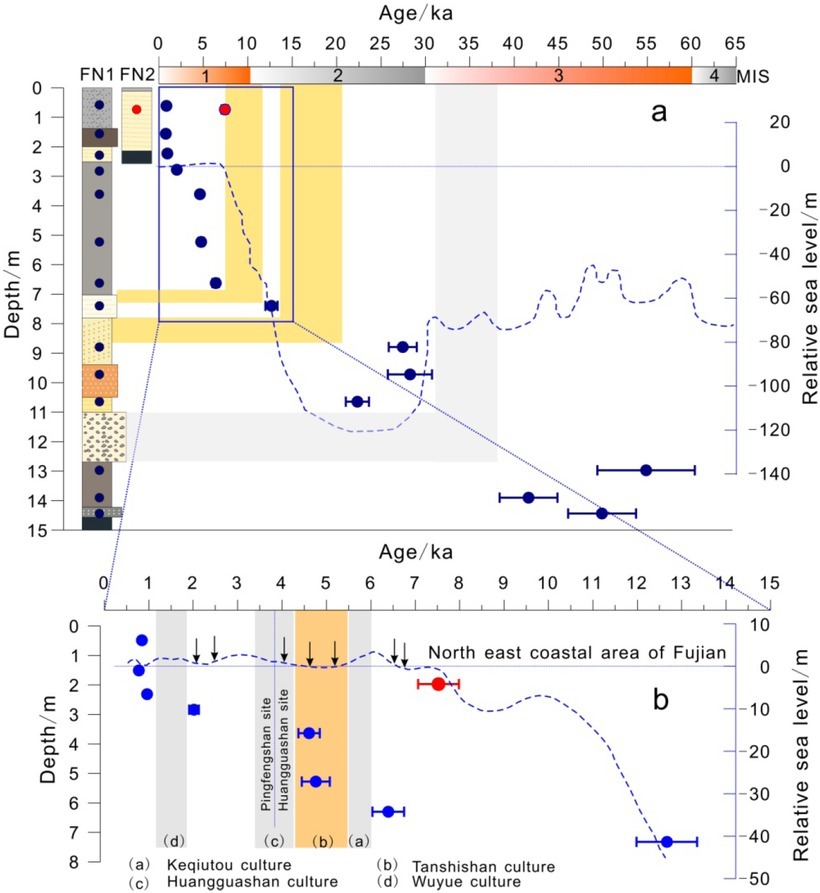
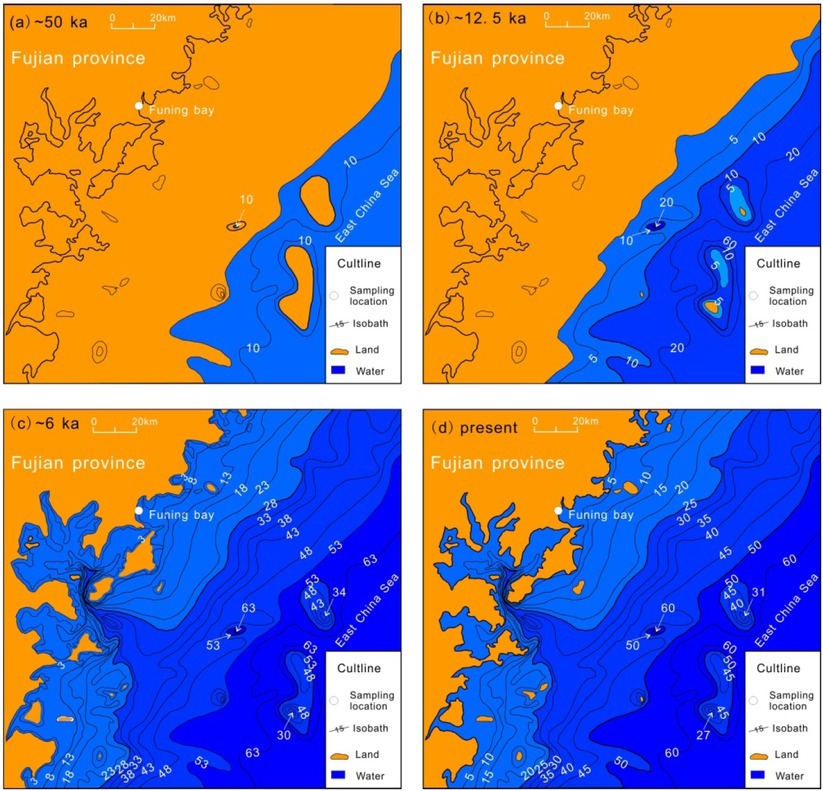
Fig. 7
Sketch map of shoreline change of northeast coastal area of Fujian province, China at different stages.
The earliest stage is roughly corresponding to marine oxygen isotope (MIS) stage 3. The duration of the unit C formation is approximately equal to 60–40 ka from now based on laboratory test results. The mean relative sea level of MIS 3 was about –55 m above sea level (a.s.l) (Kenneth et al., 2005). In some places the relative sea level maintained at –80 m a.s.l (Yokoyama et al., 2000). The clay deposition with thin-bedded coarse sand indicated a neritic and tidal flat facies. Recent research has shown that the climate condition was unstable and several abrupt changes of climate were occurred in this stage. The coastline and the submarine topography were under an accelerated evolution by this quick changing of climate. The sediment of this stage is very likely discontinuous under the influence of complicated hydrodynamic environment. So, the OSL data of this core (unit C) manifest as stratigraphic inversion. The grain-size characteristics of this unit show well sorted and fine particle with a large number organic substance, indicating a stable and relatively weak hydrodynamic environment. There were old coastal aeolian sand, shown in red or brown colour, distributed in Fuzhou basin and coastal area of Fujian in this period according to the newest investigate (Jin et al., 2017b). This suggests that the environment of research area, closer to coastline, should be neritic environment. In the region-wide view, the sedimentary records of MIS 3 are widely distributed and well preserved in China’s coastal plains, Huanghai and Bohai sea and the East China Sea as well (Zhang et al., 2010). Therefore, the OSL dating results of FN1 core (unit C) provide a new chronological evidence on the transgression of MIS 3.
The deposition process of the second stage mainly occured in the MIS3/2 transition and MIS 2. It is mainly continental deposit (in particular, fluvial alluvial and proluvial facies, a small part of aeolian sand deposit) based on the chromaticity and granularity of FN1 core (unit B). This sedimentary facies occur in response to the rapid falling of sea level following the relative thalassocratic period of MIS 3. In some tectonically stable areas or neighbouring regions where the tectonic rate is known and has been removed from the observed signal, a similar phenomenon can be observed (Wang et al., 1981; Bard, 1998; Hanebuth et al., 2000; Yokoyama et al., 2000; Liu et al., 2015). It would be specially mentioned that the sorting coefficient and cumulative relative frequency curves of horizon at depth 10–11 m are much closer to the features of aeolian sand deposit. The aeolian sand is usually eroded or there was no aeolian sand has deposited at that time, because this area is located beyond the coastal crust about a few tens of kilometres (Jin et al., 2017b). Only part of aeolian sand residues has been saved in the former fluvial plain. The sedimentary environment of this period in research area, in this sense, has been influenced by wind, which conformed with the cold and dry climate records of the Last Glaciation Maximum (LGM).
The uppermost 700 cm of sediments (unit A), which are mainly corresponding to mid-late Holocene (MIS 1), represents the final stage in the evolution of the FN1 core depositional environment. The transition to unit A is characterized by steep increase in fine grained content and a steep decline in coarse grained content, coupled with a good-mid sorting and light grey colour. Seven OSL data are 6.393 ± 0.358 ka, 4.76 ± 0.314 ka, 4.61 ± 0.243 ka, 2.019 ± 0.111 ka, 0.960 ± 0.047 ka, 0.776 ± 0.037 ka and 0.845 ± 0.041 ka, respectively. The clay and silt deposit represent a neritic environment, which conform to the result of high sea-level in this period. It has been proved that three thalassocratic stages have raced at coastal area of Fujian since about 7 ka, and the highest sea level was usually less than 4 m a.s.l compared with nowadays (Wang et al., 1994; Zeng, 1991, 1997), although the time highest sea level of each thalassocratic stages happened is still controversial (Ma et al., 2016). In general, the deposition of FN1 core reflects the process of transgression and regression of coastal area of Fujian since MIS 3 to MIS 1.
Holocene sea-level history of northeast Fujian and Neolithic cultural response
As noted above, there is still significant uncertainty over the timing, magnitude and variability of the Holocene highstand in coastal area of Fujian (the west coast of the Taiwan Straits) (Wang et al., 1994; Zeng, 1991), and it is also includes the rate of sea level change (e.g. Ma et al., 2016; Bird et al., 2007; Zong, 2004; Zeng, 1991). Some sea level curves (Lea et al., 2002; Wang et al., 1994; Zeng, 1991) sets are shown in Fig. 5a/b, which also incorporates new OSL data from the FN1 sediment core. Fig. 6 shows sea level curves for globe (Fig. 6a) and the north east coastal area of Fujian (Fig. 6b), which are based on planktonic Mg/Ca and oxygen isotope records and the radiocarbon data from six types of sea level indicators, respectively.
The deposit of unit A (FN1 core) represents the Holocene sea level history. Of particular interest is the clayey silt deposit near the base of unit A stratigraphic sequence (~6.7 m below surface). This layer dated about 6.4 ka likely accumulated along the shoreline during the marine transgression, which corresponds to a large scale transgressive event deposition named “Changle transgression” by Lin (1979). Thus, this result marks the intertidal zone during the Mid Holocene “Changle transgression” of Funing bay. A simple estimation of relative sea level for this index layer, using the present elevation above sea level minus the depth and the tidal data, suggests that it was 2.78 m. It provides a useful approximation for contrast with sea level change from other studies. This estimate of 2.78 m at 6.4 ka is roughly consistent with data form Zeng (1991), which measures relative sea level at 6.1 ka at 3 m. So the lower deposits of unit A provides another sea level indicator.
A transition period between the yellow medium sand layer at 2–2.5 m and the light grey fine sand layer at 2.5–7 m provides an obvious transgression-regression cycle dated to 0.96 ka (~2.2 m) and 2.0 ka(~2.9 m), respectively. Funing bay used to be a ship-building base of the ancient Wenma County which is part of kingdom of Wu in the Period of Three Kingdoms (220–280 AD). A boat was discovered in the foot of Pingfengshan hill and dated 75 to 235 AD under 2 sigma calibration based on AMS radiocarbon dating (Fujian provincial museum, 2017). It can provide evidence that there was a period of sea level rising. That is, there was enough water to float the boat as an ancient port. The discard of ship-building base was very likely related to the change of sea level of the time.
Why there were no sites older than 4.3 ka cal BP discovered in research area so far? It is extremely likely that sea-level fluctuations played an important role in human activities and migrations since about 7 ka (Chen et al., 2015). Fig. 6b shows the relationship between sea level change and ancient cultures since about 7 ka. As a whole, the ancient cultures of Fujian correspond directly to three periods of sea level rising since about 7 ka. As shown in Fig. 6b, Keqiutou culture (age range is about 6–5.5 ka cal BP) is the earliest Neolithic culture in coastal Fujian. One characteristic of this culture is most sites on offshore islands. And the typical sites are distributed mainly over Pingtan Island about 120 km from Fuzhou Basin. This period is just at the highest sea level of Holocene in coastal Fujian, ancient people of here compelled to immigrate to inland westward or offshore island southward because of the rising sea level. So, fishing and hunting might be the main economy (Fujian provincial museum, 1991). Tanshishan culture (age range is about 5–4.3 ka cal BP) characterized by low intensity agriculture is a maritime culture cantered on Fuzhou Basin and the mid-Holocene Min River estuary (Rolett et al., 2011). We should note that these sites of Tanshishan culture period (5–4.3 ka cal BP) mainly located on the estuarine islands or lower terraces of Min River and the elevation is not more than 10 m a.s.l (Lin, 2012). It is indicated that the sites of Tanshishan Lower-layer culture period (5.5–5 ka cal BP) should located in the place where the elevation were lower than that of Tanshishan culture sites (5–4.3 ka cal BP). There are not enough sites to distinguish Tanshishan Lower-layer culture (5.5–5 ka cal BP) from Tanshishan culture (5–4.3 ka cal BP) at present. This inference is likely to lead us to find more sites of Tanshishan Lower-layer culture period (5.5–5 ka cal BP).
Of flourish ancient culture of research area is Huangguashan culture (age range is about 4.3–3.5 ka cal BP). This period characterized by low intensity agriculture and agricultural activities might be the supplement of maritime economy base on the analysis of excavated datum (Fujian provincial museum, 2017). As far as time alignment is concerned, the lifespan of Pingfengshan site (3.8–3.5 ka cal BP) is later than that of Huanggaushan site (4.3–3.8 ka cal BP). This appearance precisely corresponds to the process of sea level rising from 4.3 ka to 3.5 ka (Fig. 6b). The rising sea level can reasonably answer the scientific question that why the sites of early stage of Huangguashan culture period (e.g. Huangguashan site at an altitude of 50 m a.s.l) were moved farther to higher than that of later stage of Huanguashan culture period (eg. Pingfengshan site at an altitude of 163 m a.s.l).
Numerous studies have now shown that there was a period of higher sea level at about 2.0–1.5 ka before present (Zeng, 1997; Lin, 2012; Ma et al., 2016). The radiocarbon dating result (75 to 235 AD) of the unearthed boat can be used as important evidence for higher sea level of the time. As one of the three ship building bases of ancient kingdom of Wu, one of the basic prerequisites should be keep extra depth to ensure navigation safety. The shipyard was deprecated when the sea level restored gradually to current state and continual war (Ge, 2011) after 1.5 ka before present.
. Conclusions
The human-environment interactions in coastal area of South China are still controversial because of the scarcity of a reliable and systematic chronology of both deposit sediments and archaeological sites. In this study, we presented the OSL ages obtained from the medium-grained quartz of FN1 core and Pingfengshan site at the Funing bay along the coastal of Fujian province, China. SAR measurements of archaeological site (Pingfengshan site) yielded internally and stratigraphically consistent ages within errors, indicating competent reliability of the technique verified with AMS 14C technique. The results showed that the ages of FN1 core deposit were varied from 50 ± 4 ka to 0.8 ± 0.04 ka. The deposit periods linked to MIS 3c/b, MIS 3/2 and MIS 1, respectively. And there is a visible break between MIS 2 and MIS 1. The core has a continuous sediment record from around 7 ka until the present. This time period spans the entire Neolithic era of the Fujian archaeological sequence. Based on the direct correspondence between sea level change and different Neolitic culture periods, we deduce that the cultural types of Keqiutou culture and Huangguashan culture all belong to coastal mountainous culture, of which flourishing periods corresponds to the higher sea level periods of mid-late Holocene. Tanshishan culture belongs to estuarine coastal culture, and most sites of this period correspond to a lower sea level period located at lower altitudes. However, at present we could not establish a precise correspondence between sea level change and human dispersal, due to the scarcity of chronology. More dating work is required, and accurate chronologies for Neolithic sites and coastal deposit cores will be the research focus in our further work.
Besides, what deserve attention especially is that the sample pretreatment and grain size component are important for us to make a correct assessment of the grain size of grains being measured and the corresponding dose rate component (Armitage and Bailey, 2005). And the water contents are also important for calculating the dose rates. Paying more attention to those influence factors is required in future work.