
. Introduction
The dating method using the radioactive 210Pb is widely applied for dating geological sediments in the environmental research. It is one of the fundamental and leading methods allowing the determination of the chronology of samples whose ages do not exceed approximately 200 years (the range of the method is determined by the half-life of 210Pb – T1/2 = 22.6 years).
Historically, the investigations of young sediments for which the concentration of the radioactive isotope of lead was measured, were conducted mainly with the goal of reconstructing the changes of the rate of sedimentation of ice, marine, lacustrine, and fluvial sediments. The lead method was successfully applied for water basins of varying area, depth, and rate of sedimentation (e.g. Luque and Julià, 2002; Xiang et al., 2002; Sikorski and Goslar, 2003; Gąsiorowski, 2008; Erlinger et al., 2008; Kinder et al., 2013; Tylmann et al., 2016). During the last decades, the method has become a standard tool for limnology, providing support for the chronology of young sediments.
However, the lead method finds a much wider range of applications, for example for the dating of peat sediments. The last decade has seen a dynamic development of research of peat bogs. They are declining reservoirs that had recorded the history of industrialization which is one of the symptoms of anthropopression (Turetsky et al., 2004; Le Roux et al., 2005; Mizugaki et al., 2006; Ali et al., 2008; Novak et al., 2008; Olid et al., 2008; De Vleeschouwer et al. 2009; Lamentowicz et al., 2009; Śmieja-Król et al., 2010). In addition, the investigations of 210Pb in soils, air samples, ice cores as independent reservoirs or as complementary measurements in the mentioned sedimentary environments and peat bogs are an essential aspect of geochronometric and climatological investigations (Ebaid and Khater, 2006; Olid et al., 2008; Klaminder et al., 2009).
The goal of the presented work was to determine precise age-depth models (e.g. with 1 cm resolution) for the cores where the samples for activity measurements were collected with a lower resolution. The common approach is to divide the core into 1 cm slices and to determine the specific activity of 210Pb in each of them (Putyrskaya et al., 2015; Sanchez-Cabeza et al., 2014; Le Roux and Marshall, 2010, Zaborska et al., 2007). It results in acquiring accurate, 1 cm resolution age results of the obtained model. The deviations from the above, simple method of dating a core every 1 cm are caused by financial reasons. When a site is investigated, the researcher is often faced with the dilemma whether to sample a greatest number of profiles or whether to date them with a higher resolution.
Currently, the typical approach in 210Pb dating method is to calculate the age of the selected sediment layers based on the activity measurements for these layers. Appropriate models are used for this – e. g. CRS – Constant Rate of Supply (Appleby and Oldfield, 1978; Liu et al., 1991), CIC – Constant Initial Concentration (Appleby 2001) or CFCS – Constant Flux, Constant Sedimentation (Krishnaswami et al., 1971; Robbins, 1978).
Increasingly, in the next step, the age for the intermediate layers is modelled using the Bayes or Monte Carlo method (e.g. Blaauw, 2010; Blaauw and Christen, 2011; Hercman and Pawlak, 2012, Hercman et al., 2014).
This work offers a slightly different approach. Namely, it introduces matching the mathematical function that best reflects the values of activity measurements (see Section 3). Based on the selected function, it is possible to calculate the activity for all intermediate layers with the necessary resolution. This approach is less statistically expanded than the ones mentioned above. On the other hand, using ready-made computer programs to create age-depth models may create the threat of too much automation in the application of the the 210Pb dating method to create such models. In the author's opinion, this stage of dating requires special care, regardless of whether we approximate the activity or the age. The performed analyses allowed determining an age model for non-standard profiles that are difficult to interpret. For this purpose, a classical CRS dating model was used. The paper also discusses the possibilities and limitations connected to the interpretations of the ages obtained for the profiles where sampling encompassed only the layers younger than the range of the method.
. Study sites
Silesian Upland
The investigated peat bogs, Bagno Bruch and Bagno Mikołeska (Fig. 1), are located in the northern part of the Silesian Upland in the valley of the Mała Panew River, a tributary of the Odra River. The valley of Mała Panew forms a wide, flat, E-W oriented depression. The initial width of the valley is 3 km, and the final one – 35 km. The average annual air temperature for the described peat bogs is 8°C. In winter, the average temperature is about –1°C, and in summer it is +18°C approximately (Fiałkiewicz-Kozieł et al., 2014). The average precipitation in the years 1971-2000 was 729 mm (Ośrodka et al., 2011). The peat bogs are supplied mainly by rainwater, although groundwater (of very low mineral content) supply cannot be excluded. No surface supplies are present.
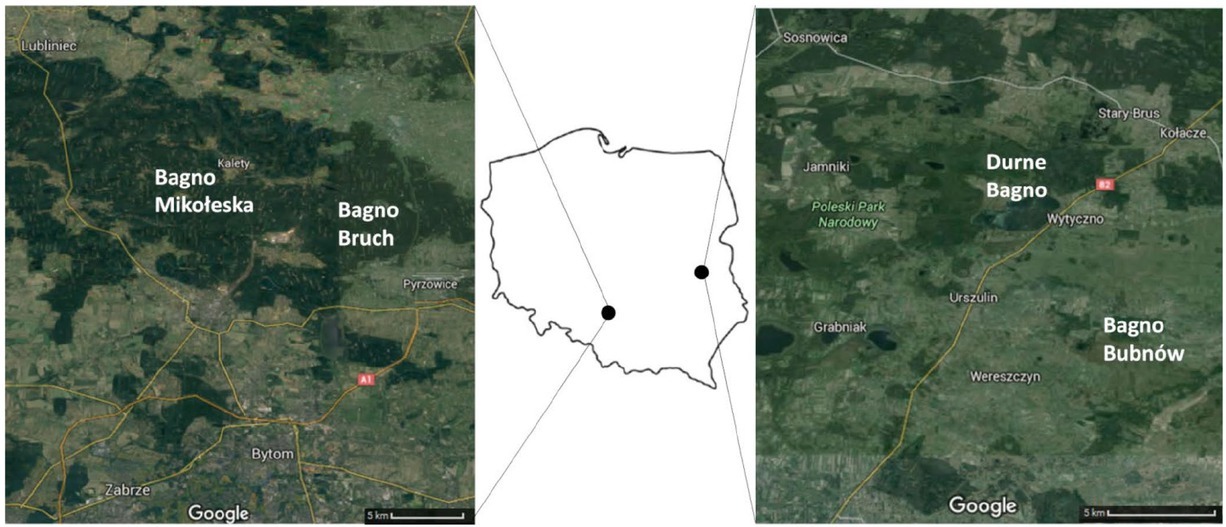
The cores from these peat bogs were collected in 2016, in the central parts of the investigated areas. For comparison purposes, two cores were acquired at a distance of 2 m from each other, from each peat bog – the cores BB3 and BB4 from Bagno Bruch, and BM3 and BM4 from Bagno Mikołeska.
Bagno Bruch (N 50°31'; E: 19°2') poor fen, in the past raised bog (Ekonomiuk et al., 2004), has a surface area of 39 ha. The vegetation includes a mosaic of peat-land species such as Andromeda polifolia, Eriophorum vaginatum, Ledum palustre, Oxycoccus palustris, Pinus sylvestris, Rhynchospora alba, Molinia cerulaea, Carex nigra, Carex panicea, and a variety of Sphagnum species (S. fallax, S.cuspidatum).
Bagno Mikołeska (N: 50°33’38”; E: 18°49’2”) is a small (5 ha) fen. The sampling sites are vegetated by Sphagnum fallax, Eriophorum angustifolium, Oxycoccus palustris, Drosera rotundifolia, and sparse Pinus sylvestris (Fiałkiewicz-Kozieł et al., 2014).
Poleski National Park
The investigated peat bogs (Fig. 1) are located within Poleski National Park area which was established in 1990. It was the first national park in Poland whose aim was to protect peat and swamp areas. The park is situated in the Lublin Voivodeship, in the Polish part of Polesie. The average monthly temperatures in January and July are -4.1°C and +17.9°C, respectively (Kaszewski, 2002). The average annual precipitation in the park is 551 mm (Kaszewski, 2002; Mieczan, 2007). The peat bogs are supplied with water mainly by precipitation. However, groundwater supply cannot be excluded, especially in the case of Bagno Bubnów peat bog, drained by an unnamed watercourse. The cores from these peat bogs were collected in 2014.
Bagno Bubnów (N: 51°21’17”; E: 23°16’26”) has a surface area of 2309 ha. It is a calcareous fen. Due to their rarity in Poland, the most interesting communities are connected to the calcium carbonate present in the soil. These are the species such as Cladium mariscus, Carex davalliana, Schoenus ferrugineus, as well as Molinia calcareous.
The profile TW1 was collected in the central part of the peat bog. The vegetation was dominated by Chara intermedia. Charophytes C. globularis, and Nitellopsis obtusa, as well as Potamogetun natans and Utricularia intermedia that showed a much lower prevalence.
Durne Bagno (N: 57°27’01”; E: 23°13’23”), which has a surface area of 213 ha, is a continental raised bog. The species such as Carex chrordorrhiza, Utricularia minor, Drosera intermedia, D. anglica, and D. Rotundifoliai that are under strict species protection still grow there. The peat bog has a hummock-hollow structure. The profile TW2 was collected in the valley of a typical peat bog community dominated by Eriophorum vaginatum, Ledum palustre, Vaccinium uliginosum, amd Oxycoccus palustris in the flora layer, and Sphagnum fallax, S. magellanicum, and Polytrichum commune in the bryophyte layer (Sugier, 2014).
. Methods
Activity measurements
There are two basic methods used to determine the specific activity of 210Pb – namely alpha spectrometry and gamma spectrometry of the radiation emitted by the sample (e.g. Sikorski and Bluszcz, 2003, 2008; Le Roux and Marshall, 2010).
The most frequently applied approach is an indirect measurement of the 210Pb decay product 210Po (T1/2=138 days) using alpha spectrometry, also applied in the presented work.
The activity was measured using a quad alpha spectrometer (Canberra model 7404) with Passivated Implanted Planar Silicon (PIPS) detector. The sensitive area of the detector is 300 mm2, and its energy resolution is ca. 20 keV. Such resolution enables good separation of the peaks originating from 210Po (E = 5.308 MeV) present in the sample and 208Po (E = 5.105 MeV) added as a standard. Because the half-lives of both polonium isotopes are relatively short (T208 = 2.898 years, T210 = 138.4 days), the results of the measurements are corrected into 208Po radioactive decay from the moment of its calibration, and 210Po disappearance from the moment of polonium extraction from the sediment.
All measurement results are presented according to ISO/IEC Guide 98–3 (2008), so the uncertainties are given in brackets. The decimal separator was not used when giving the uncertainties. Therefore, one needs to keep in mind that the uncertainty is always related to the last two decimal places of the measurement result.
Chemical treatment
The samples were mineralised and chemically processed in order to transfer polonium into the solution. Polonium was subsequently deposited through spontaneous deposition on silver. In the first step of preparation, 208Po standard (manufactured by AERE Harwell, UK), of known specific activity, was added to 1 g of the dry sample. Next, the sample was treated with hot, concentrated HNO3 (90°C, 65%), and placed in a sealed container. In order to separate the desired fraction, the mixture was centrifuged for ca. 10 min at 5000 rotations per minute. Next, 5 ml portions of concentrated HCl were added a few times and evaporated. In this way, HNO3 was eliminated from the sample and replaced by an HCl solution. The remainder of the last rinse was dissolved in 40 ml 0.5 M HCl with an addition of 0.5 g of hydroxylamine (H3NO⋅HCl) and 0.5 g sodium citrate (C6H5O7Na3⋅2H2O) in order to achieve the reduction of inhibitors. Polonium was deposited on a silver disc (Flynn, 1968; Sikorski and Bluszcz, 2003; De Vleeschouwer et al., 2010) from this solution at 80°C for ca. 4 hours under constant stirring.
The obtained radioactive sources underwent alpha spectrometric measurements. This methodology was used for all measured peat samples.
Modelling
For the 210Pb age calculation, the CRS model was used (Appleby and Oldfield, 1978; Sikorski and Bluszcz, 2003). This model assumes that the 210Pb flux remained constant through time, but the peat accumulation rate may have changed.
The results usually are not given as a function of depth, but rather the depth mass, in order to eliminate the possible effect of sediment compaction or the changes in its density. Such approach was also used in the presented work.
In the simplest case, the activity versus mass depth should be described by the exponential function. Unfortunately, exponential fit to the plots of the specific unsupported 210Pb activity vs. mass depth for examined peat profiles did not provide satisfactory results (F-statistics starting from the value = 30 and worse for some other functions).
In the current study, it was proposed to approximate the activity for each depth by matching the mathematical function that best reflects the values of activity measurements. The quality of fitting was tested by the observed value of the F-statistics. In the next step, the age of each layer was calculated using the CRS dating model.
Matching the best mathematical function was determined for each of the cores independently, by the application of the measured activities. The selection of the matching function is crucial not only for the modelling of 210Pb concentration but also for the obtained age-depth model.
The program TableCurve 2D v5.01.01 (http://https://systatsoftware.com/products/tablecurve-2d/https://systatsoftware.com/products/tablecurve-2d/) was used to find a mathematical function that best reflects the course of measurement data. The program has a library of 3665 parametric functions. After importing of the measurement data (depth mass, measured specific activities of unsupported 210Pb and their uncertainties), the program matches these functions for the input data for each sediment core, by the application of the weighted least-squares procedure. The results of fitting are presented as a statistically ranked list of candidate equations. The range of the search was limited to the models consisting of at most four parameters (Curve-Fit Simple Equations) of the best quality of the match. The crucial criterion for the selection of the optimal match was their sorting by the highest value of the F-statistic. The functions that were chaotic or unrealistic (e.g. polygonal chains, single peaks, more than one polygonal chain separated with an asymptote) were not taken into account.
. Results
For the available cores the activity was measured in every second analysed layer. As a result, 70 activity values were obtained for peat bogs Bagno Bruch (BB) and Bagno Mikołeska (BM), and 24 for Bagno Bubnów and Durne Bagno (TW).
Supported 210Pb
The specific activity of the supported 210Pb for each of the BB and BM cores was determined for the measurement from the deep layers (for the depth of 50 cm), and from the measurements of the deepest layers, where the activity reached the value of the deep layer. These values were averaged using a weighted mean. For sites BB3, BB4, BM3, and BM4 these activities Aa with their uncertainties u(Aa) were determined to be 12.2(81); 15.3(83); 20.8(95); 23.4(96) Bq/kg respectively. The results obtained for the cores within each peat bog do not differ significantly – they agree within measurement uncertainties. The values of the Student’s t-test:
where:
tS – values of the Student’s t-test
Aa1, Aa2 – compared specific activities of supported 210Pb (Bq/kg)
u(Aa1), u(Aa2) – uncertainties of the above mentioned activities (Bq/kg) are equal to 0.27 for the peat bog BB, and 0.19 for the peat bog BM. They are smaller than the critical value for a significance level α = 0.05, whose value, in this case, is 2 (uncertainties of Aa1and Aa2 are known from the law of decay hence we may assume that the testing variable has the normal distribution).
Therefore, the results of the t-test allow the calculation of the weighted average for each of the investigated peat bogs. For the cores taken in close vicinity, the following values were obtained: 13.7(82) Bq/kg for BB and, 22.1(95) Bq/kg for BM.
For TW1 and TW2 the activity of supported 210Pb was determined for measurements performed for deep (45 cm) layers of the peat profiles. They are equal to 32(11) Bq/kg and 33(11) Bq/kg, respectively. Although an agreement within individual uncertainties is seen, the results were not averaged because they were taken from two different peat bogs and slightly different sedimentary environments (see Section 2).
Extrapolation of the activity
It is interesting to observe that the best extrapolation results were obtained for the functions described by the same formula for all cores:
where:
x – depth mass (g/cm2)
y – specific activity of unsupported 210Pb (Bq/kg) a, b, c – the parameters of the matched function
The only difference is the value of a, b and c parameters. The parameter c for two cores BM4 and TW2 takes the value c = 3, and for the remaining four cores c = 2.5. For a and b parameters, TableCurve software gives the uncertainties. However, the uncertainty is not determined for c parameter. The only available information is that the tested values were from the set of {0.5, 1, 1.5, 2, 2.5, 3}.
The basic criterion for determining the match quality was the value of the F-statistics.
The values of F-statistic for the investigated peat profiles are as follows:
Bagno Bruch: F = 192 (BB3) and F = 552 (BB4),
Bagno Mikołeska: F = 251 (BM3) and F = 195 (BM4),
Bagno Bubnów F = 571 (TW1),
Durne Bagno F = 169 (TW2).
The Fisher-Snedecor probability distribution was used to calculate the likelihood of an equal or higher F value occurring by chance, and as a result the following probabilities were obtained:
Bagno Bruch: P = 7.7·10–10 (BB3) and P = 1.5·10–12 (BB4),
Bagno Mikołeska: P = 7.0·10–10 (BM3) and P = 3.3·10–9 (BM4),
Bagno Bubnów P = 2.3·10–9 (TW1),
Durne Bagno P = 2.9·10–7 (TW2).
In this case, the null hypothesis is that the observed relationship occurred by chance. These probability values are extremely small, hence we may reject the null hypothesis and assume that the model fits properly with the experimental results.
For mass depths xi, for which activity measurements were not available, the activities Ai were calculated by the formula:
Subsequently, uncertainty of these activities u(Ai) was calculated using the error propagation formula:
where u(a) and u(b) are the uncertainties of a and b coefficients, determined by TableCurve 2D program, respectively. The values of specific activity and its uncertainty were used as input into the CRS model, which allowed the determination of the age and its uncertainty for each analysed layer. A separate model was constructed for the values obtained directly from the spectrometric measurements.
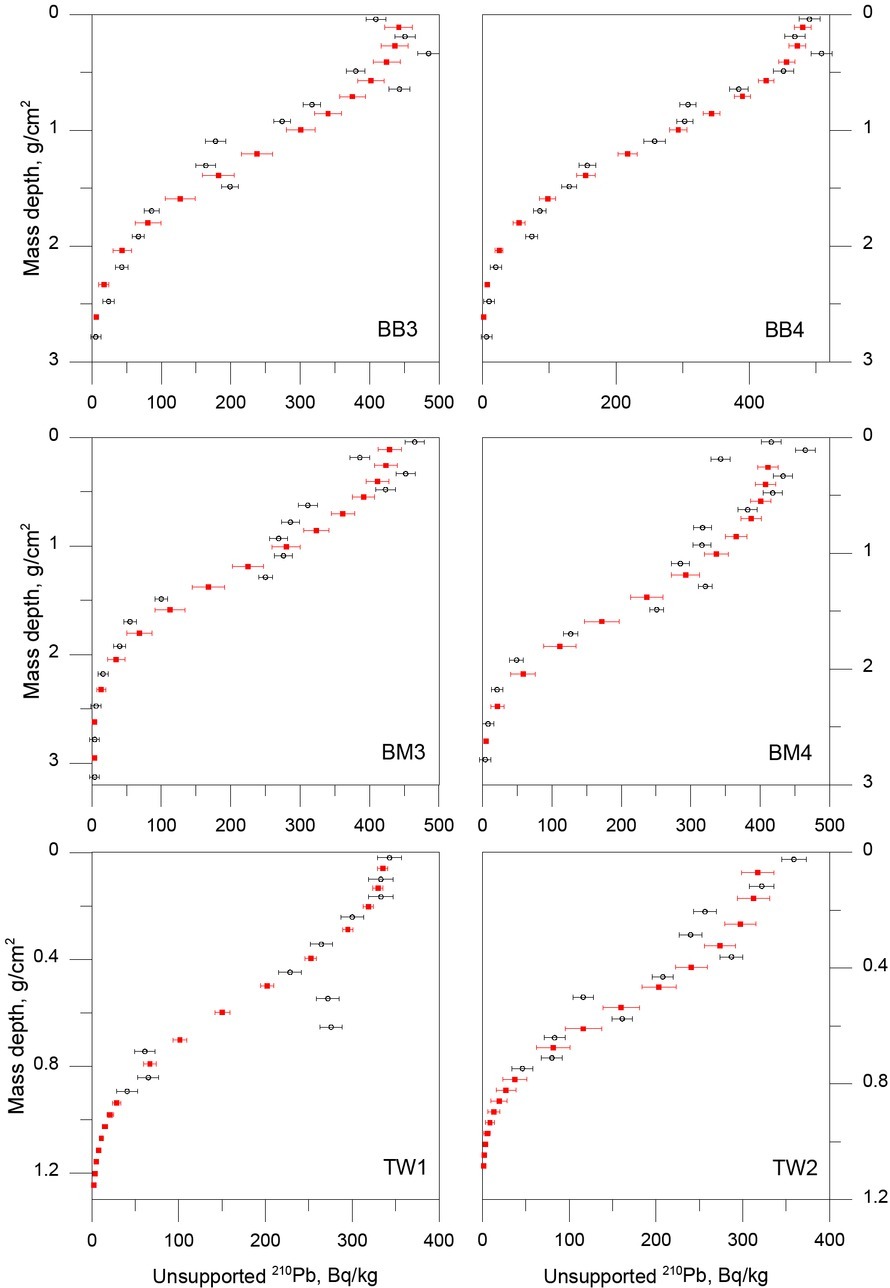
The presented results of specific activity measurements originating from profiles BB3, BB4, BM3, BM4, TW1, TW2 are shown in Fig. 2.
Fig. 2
Specific activity of the 210Pb for measured samples (black circles) and using approximation of activity (red squares).
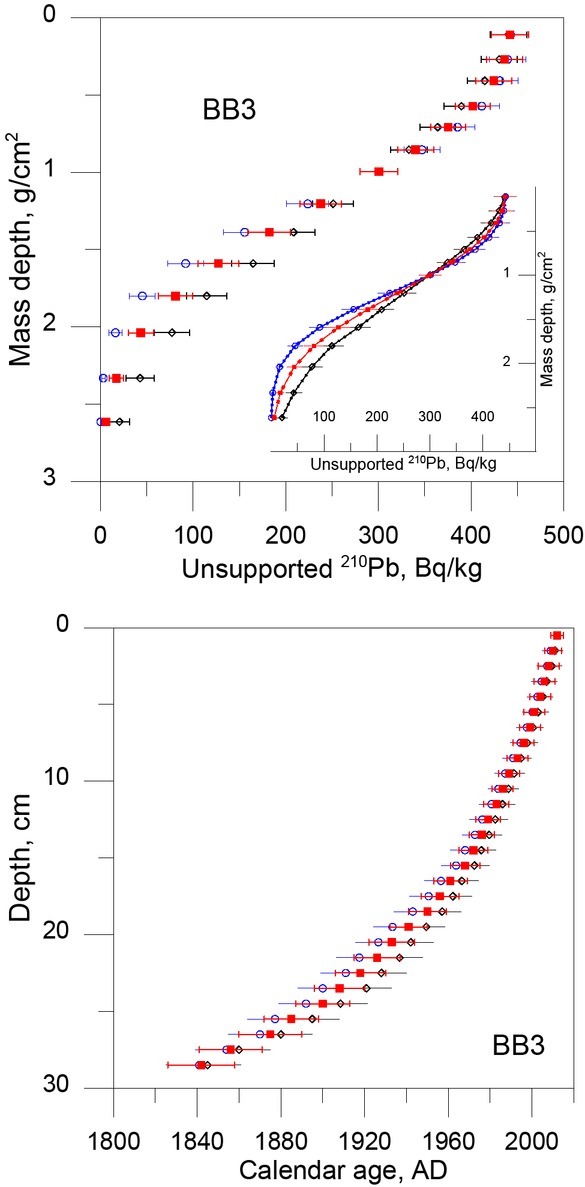
Taking into account the fact that TableCurve does not provide the uncertainty for c variable, the influence of the change of this parameter on the obtained results has been checked. The age has been calculated on the basis of the approximated activities, by changing the value of c parameter within the range available in the program, without changing the values of a and b parameters. For example, for BB3 core, the best match has been indicated for c = 2.5 (see Table 1). It has been tested how the change of this parameter to c = 2 and c = 3 influences the final results. The age-depth models obtained in this way agree within a single measurement uncertainty. The activities defined for different values of c parameter, recalculated for the age of BB3 core are presented in Fig. 3.
Table 1
Parameters a, b, c of the functions obtained in TableCurve program.
. Discussion
Bagno Bruch and Bagno Mikołeska
The above-described procedure of measurements, activity approximation and age determination was applied to the sites located in close vicinity – peat bogs BB and BM.
The used methodology of sediment measurements performed for every second layer and approximation of activity (or age) for the missing layers along the profile has its limitations. However, one has to bear in mind that such approach may lead to missing some changes occurring in the profile, blurring of information, and smoothing of the age-depth model. In such cases, extreme events are not visible. It is particularly dangerous for the profiles
with low sedimentation rate. On the other hand, because the number of dated profiles can be doubled in this way, this approach seems to be justified.
The ages of the layers sampled from the same depths were first compared within each peat bog, and, subsequently, between both peat bogs, BB and BM. It was observed that the ages for the pairs of cores from the same peat bog (BB3 and BB4 as well as BM3 and BM4) are in agreement, whereas for layers located at 46 depths the agreement is within a single uncertainty, and for the remaining 12 – within two uncertainties. A similar agreement is observed between the peat bogs.
The analysed peat bogs are close to each other, and hence the vegetation conditions of the peat are similar, and a similar rate of accumulation would be expected. The agreement of the results obtained for two independent peat bogs suggests a similar deposition history for both localities.
Bagno Bubnów and Durne Bagno (cores shorter than the range of the method)
In the cases where the oldest layers of the investigated profile are younger than the range of the method, this fact has to be taken into account, by appropriately modifying the age model. Such situation is often seen in young, mostly artificial (anthropogenic) reservoirs, when their age is known. In the CRS model, the activity for the whole thickness of the sediment has to be assumed in a way to yield the age of the reservoir for the sample found at its bottom (Sikorski, 2003, Sikorski and Bluszcz, 2003). However, the determination of the activity of the supported 210Pb in such situation is very difficult.
Similar problem is encountered when a core that is too short has been collected. In this situation, an approximation of the activity for deeper samples is necessary. For these profiles, the approximation method described in the Methods section was used. The values obtained in such a way can be then used in the age model. Such problem was encountered in the profiles TW1 and TW2 from the peat bogs from Poleski National Park, where the measurements of activity and concentration of supported 210Pb revealed that radioactive lead reaches deeper than 20 cm, a depth to which the core was taken. For obvious reasons, the ages obtained for layers deeper than 20 cm cannot be a result of direct alpha spectrometric measurements. Modelling has to be applied, and the results cannot be treated with equal validity as in the first case.
It has to be stressed that these are only estimates and should be treated with caution. In environmental research, particular attention and restraint have to be exercised in the interpretation of the results obtained for each layer. Such dating should be treated roughly, as one way of providing the information about the range of the lead method, or determining the average rate of peat accumulations for the whole core.
Correctness tests of the proposed modelling for shorter cores
Additional tests were conducted for the short cores, in order to compare the measured and estimated level of supported 210Pb. The measurement results for BB and BM cores were used for this purpose, but they were modified in such a way that short cores were created from them, by the removal of the results for the layers deeper than 20 cm (1.7 g/cm2) from the set of measurement data. For these new data sets, the activities were extrapolated independently for each profile, in TableCurve 2D software, according to the procedure described in 4.2 section. The values of supported 210Pb, determined in such a way for BB3, BB4, BM3, and BM4 stands, are presented in Table 2, where they are compared with the values obtained from the measurements of complete cores. The t-Student test confirms that the obtained values agree within the limits of the measurement uncertainty. This fact confirms the proposed approach is suitable for the short cores.
Table 2
Comparison of measured and approximated values of supported 210Pb.
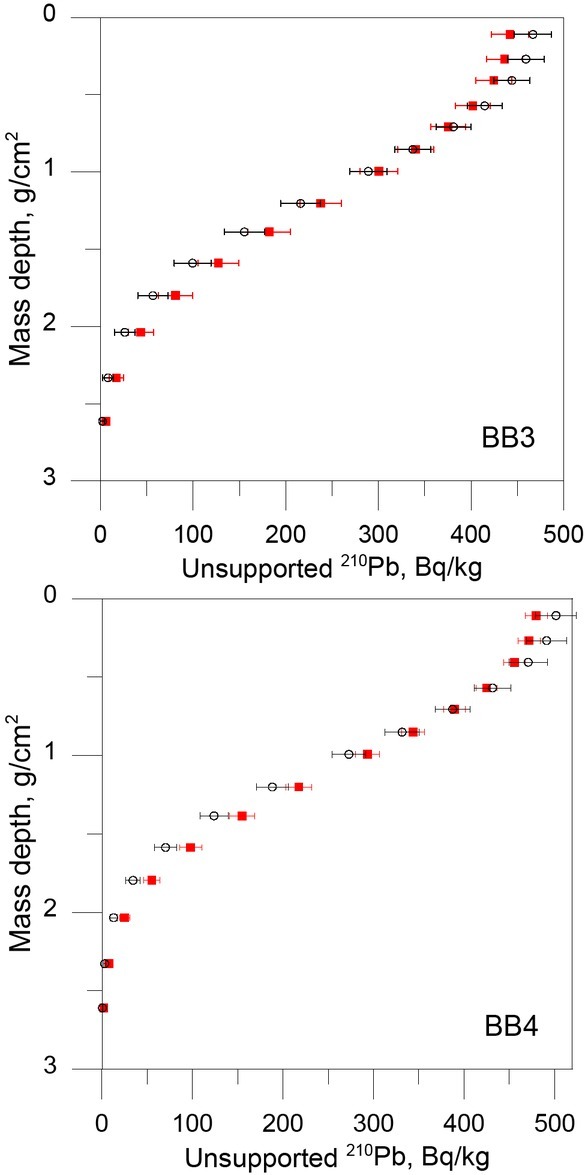
The a, b, and c parameters of the functions for the newly created – shortened – cores from BB and BM sites, have been defined independently for each of them in TableCurve program. The obtained values of the parameters are presented in Table 1, along with the values of these parameters for the cores before their modification. Fig. 4 presents the results of activity approximation for two exemplary cores – BB3 and BB4 – calculated on the basis of the functions defined in TableCurve program – for the cores before and after their shortening.
Ages for measured and modelled activity
Two methods of determining the age were compared in the presented study. In the first, classical approach, the age is calculated using CRS model directly for the measured activity. In the second approach, the approximated values of the activity were used as an input for the CRS model.
The ln y = a + bxc function which provides a good fit for describing the measured data was utilized. It also facilitates the analysis of the activity profile. In the situation when the deviations from the approximation decay of activity are recorded, it is possible to detect disturbances in the sediment. Because of this fact, we achieve better control of the changes taking place in the sediment. At this stage, it is also possible to measure the activity of outlier samples again.
The insufficient number of dating results may result in the need to use the methods based on Bayesian approach or Monte Carlo simulations to determine the age of non-measurable samples. The approximation of the activity enables the use of the lead method as a robust and comprehensive technique of dating.
In practice, the age values obtained for the youngest sediments by the lead method are often combined with the results of the dating of older profile layers (e.g. using the 14C method) to create comprehensive age-depth models. In this situation, the results of 210Pb dating are modelled for the second time. In the first step 210Pb ages for each layer were modelled based on activity measurements and in the next step these dates are used together with 14C dates to create new age-depth model – again for the same layers.
The graphs of the age-depth models calculated on the basis of the CRS model used in lead dating are shown in two variants – with the indication of points only for the depths from which actual samples were taken (Fig. 5 black circles) and with points every 1 cm using activity fitting (Fig. 5 red squares).
Fig. 5
Age calculated from the CRS dating model for measured activity (black circles) and using approximation of activity (red squares).
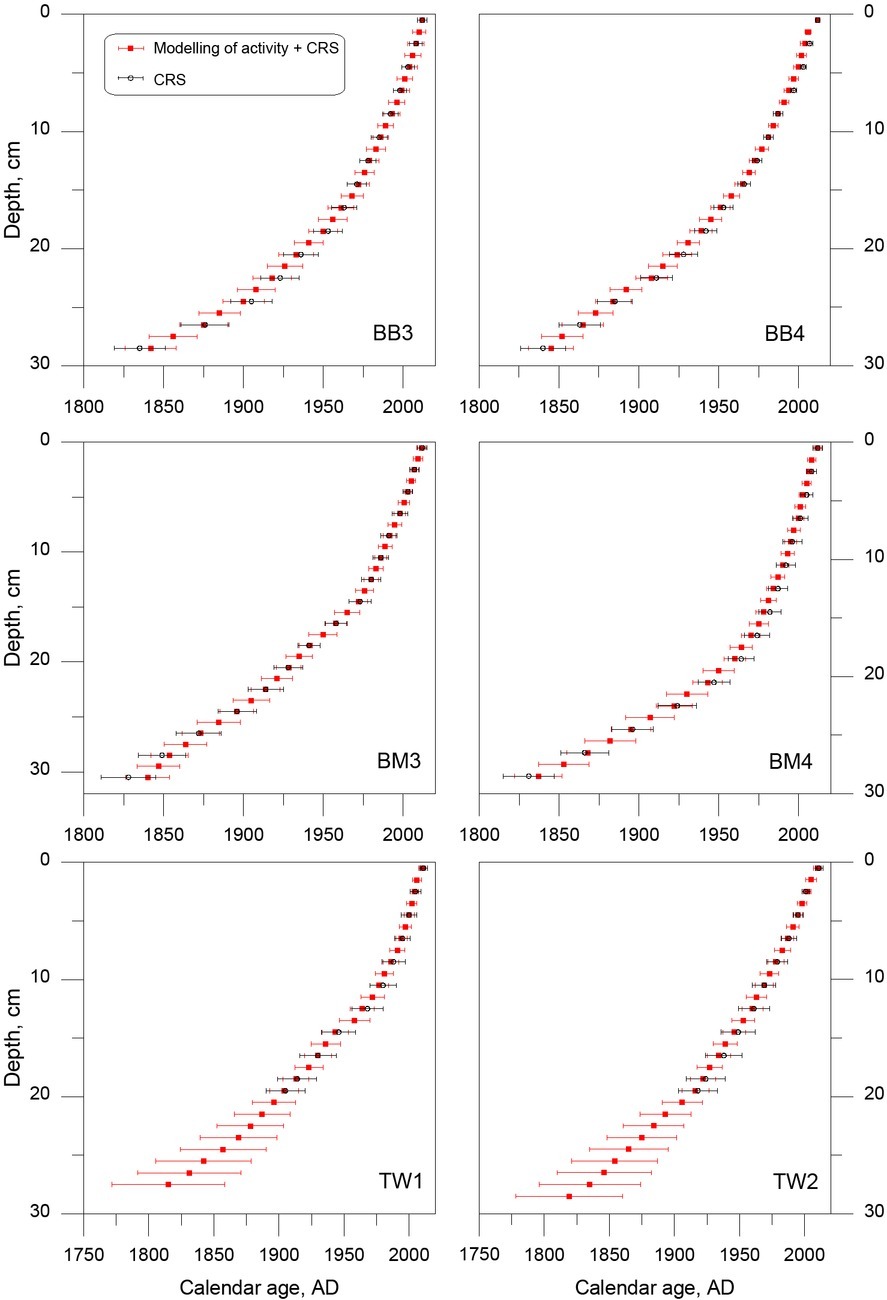
The dating results obtained by two methods are consistent within the limits of the measurement uncertainties. However it can be observed that ages calculated by using the chosen mathematical function describing the changes of activity are younger than the ones calculated by using measured activities for BB and BM cores before 1900 AD. This observation is in line with the observations of other researchers using the 210Pb lead method (e.g. Gunten et al., 2009, Tylmann et al., 2013). However, it requires an in-depth study and will be the subject of further analyses. Moreover, a separate analysis is required for determining the reasons for the lack of linearity of the obtained age charts. The lack of linearity of the age charts is observed both for the age calculated for the activity every centimetre (containing approximated values), and for every second centimetre counted – obtained directly from the measurements. The problem, most probably, results from the variability of the environment at the described site. Moreover, it can be related to the change in the rate of peat growth, resulting from the industrialization. In such case, each of the age charts can be interpreted roughly as the composition of two segments belonging to almost straight lines with different inclinations. In the context of these considerations, one should take into account the information about the intensive development of the smelting industry since the end of the 1960s, when a metallurgical plant of zinc and lead ore was built in the area of Miasteczko Śląskie (about 8 km to the south of the peat bogs). The beginning of industrialization corresponds to the point where two line-segments are connected. The depths for particular cores, determined for the year when the zinc and lead plant was built – 1967 AD – are as follows: BB3: 16 cm, BB4: 15 cm, BM3: 16 cm, BM4: 18 cm. The peat growth rate can be determined in two time intervals. The average growth rates, expressed in mm per year for the relevant peat bogs, before and after 1967, are presented in Table 3.
Comparison of different dating approaches
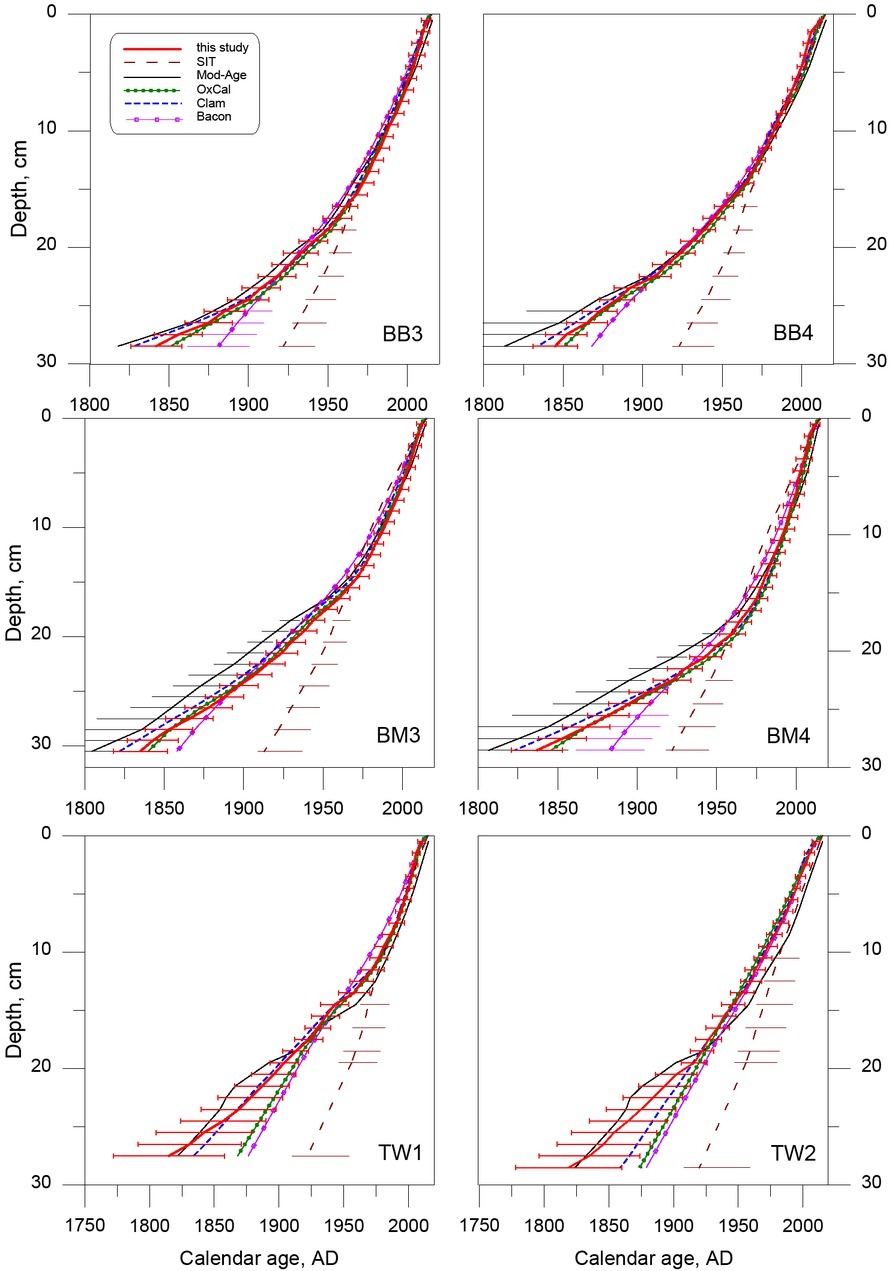
Finally, the obtained age-depth model for each core was compared with the models generated by the following software: SIT (Carroll and Lerche, 2003), OxCal (P_Sequence procedure, Bronk Ramsey, 2008), Clam (Blaauw, 2010), Bacon (Blaauw and Christen, 2011), and Mod-Age (Hercman and Pawlak, 2012).
By the application of OxCal, Clam and Bacon software, the age-depth model was determined on the basis of the age of the sample and its location (depth) in the sediment profile. The approach presented in this paper (activity extrapolation), SIT and Mode-Age programs enable the direct determination of the chronology on the basis of the activity of unsupported 210Pb and the location of the sample within the profile. The comparison is presented in Fig. 6.
Fig. 6
Age-depth models obtained by activity approximation (red) and SIT (brown), Mod-Age (black), OxCal (green), Clam (blue), Bacon (purple) models. For the sake of clarity, the presented charts show the uncertainties (68.2%) for activity approximation only, as well as in the lower layers of the cores for the models that diverge most seriously from the proposed model. This is the case for SIT model for all the cores, and for BB3 and BM4 in the case of Bacon model, and BB4, BM3, and BM4 in the case of Mod-Age model.
The values with normal distribution of uncertainty were applied as the input data in the used models, with the exception of Mod-Age software that accepts the dates with other distribution. It enabled age-depth model construction using the real lead age distributions, for each depth taking account its uncertainties. The actual age distribution is obtained as a result of dating by using Monte-Carlo simulations of activity assuming its normal distribution (Hercman and Pawlak, 2012).
All the models used in the presented research yielded comparable results (Fig. 6). From the present day to the 60-ties of the 20th century, very good conformity of the results obtained for all the cores in all applied models (within the limits of the single measurement uncertainty) is visible.
The chronologies obtained by independent methods for the older samples are generally comparable within the limits of the single measurement uncertainty with the results obtained from the application of activity approximation, with one exception. The deviation from this conformity is the dependence obtained by the application of SIT model. In this case, the dates are significantly rejuvenated, even up to 100 years. Only for the SIT model time marker was introduced: the year when the zinc and lead plant was built – see the previous chapter (1967 AD for the following depths: BB3: 16 cm, BB4: 15 cm, BM3: 16 cm, BM4: 18 cm). The data obtained without this limitation were even younger, by additional 50 years, and unrealistic in relation to the other models. The SIT model, in the presented research, demonstrated the tendency of linearization of the generated age profile for the discussed measurement sites. It causes difficulties in the application of this model, especially for the sites where the deposition rate changes over time. The limitations of SIT model were discussed by other authors (e.g. Abril, 2015), and the discrepancies between the results of SIT and CRS models for older samples were described by e. g. Tylmann et al. (2013, 2014) and Cordoba et al. (2017).
The general tendency to be younger of the results obtained by the application of Bacon software can also be observed. It is also the result of the linearization tendency of the age-depth model – especially for TW cores and the older layers of the other cores (cf. Fig. 7).
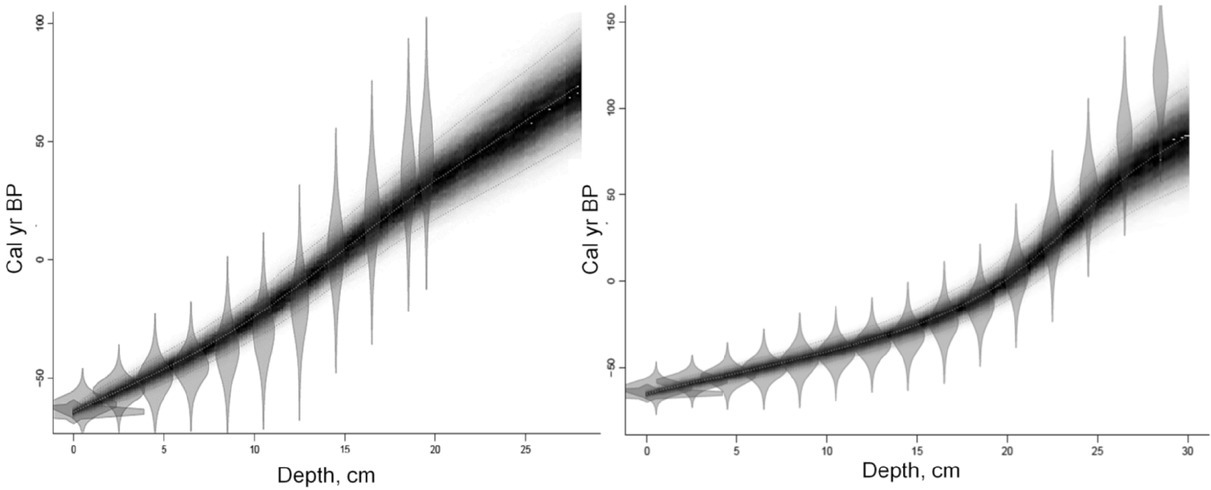
Fig. 7
Examples of age-depth models obtained by Bacon model for cores TW1 (left) and BM4 (right). Note that the models are not matched to the points corresponding to the maximum probability; they only tend to the linearization.
The age characteristics obtained for Mod-Age model are moved in the direction of older dates, in comparison to the ages obtained after the activity approximation. The most probable reason for this divergence is the fact that this model takes into account the skewness of 210Pb age distribution.
. Conclusions
The paper presents the results of the analysis performed for six peat profiles representing two independent research sites. These sites have different geographical location and thus require independent interpretation of the results.
The conducted research can be summarised as follows:
A frequent practice of the users of lead dates is the sole presentation in publications of the final dating results, although such a form is insufficient. The dates should be presented without the points obtained by approximation, and when such points are included it should be clearly indicated how many samples were measured and at which depths they were taken.
In the case of multi-proxy analyses, the best practice is the measurement of activity for each of the analysed layers along the core. Performing measurements for every second layer is acceptable. Naturally, such simplification generates a smoothing of the age-depth profile in the final result, and thus extreme events can be missed.
The lead dating method, taking advantage of the activity approximation, similar to the methods using age approximation, is a tool that enables obtaining an age for any layer of the profile that lies within the age range.
The employment of the activity approximation method enables the estimation of activity, even the supported activity for the cores shorter than the range of the method. The tests conducted on the artificially shortened cores confirmed the usefulness of this method. However, the awareness of the associated limitations is necessary. Such ages are only estimates and should be treated with caution. For example, as the information about the range of the lead method or average deposition rate for the whole core, especially for monotonic profiles with a constant sedimentation rate.
It is worth noticing that for six analysed cores, the function that best fits the measurement activities has the form: lny = a + bxc. A natural question arises if the obtained mathematical function could be applied to other research objects such as cores obtained from other locations. In this case, the approach presented in this paper can prove to be useful for other researchers for the purpose of activity modelling. However, this issue needs further investigations which are beyond the scope of this paper.
A comparison of the activity approximation to creating the age-depth model with the models obtained using the Monte Carlo simulation and Bayesian theorem (using Mod-Age, OxCal, Clam, and Bacon software), showed their compatibility within the limits of a single uncertainty. One should note that among the tested software, Mod-Age program is the only one that offers the possibility of taking into account the skewness of age distribution, introduced into the model.
The results of modelling with the application of SIT software are in accordance with the results obtained from other programs for the upper layers of the researched cores only. For the lower layers, the differences become more pronounced with the depth. It suggests that SIT software applies too much linearization.