
. INTRODUCTION
Luminescence dating has been widely used to date late Quaternary deposits from different geographical areas of the world (Aitken, 1998). Traditionally, optically stimulated luminescence (OSL) dating of sedimentary quartz has been employed to date sediments from a range of depositional settings (Murray and Wintle, 2000). However, the quartz OSL signal generally saturates between ∼100 and 200 Gy, corresponding to 40–80 ka (for a dose rate of 2.5 Gy/ka) (Wintle, 2008) but is also insensitive in some regions of the world (Preusser et al., 2006; Fuchs et al., 2012; Rhodes, 2015, Li et al., 2018). The recent development of post-IR IRSL (pIRIR) methods applied to K-rich feldspar isolates a slower or completely non-faded IRSL signal capable of dating sediments up to 250–300 ka owing to the higher saturation dose of K-feldspar relative to quartz (Thomsen et al., 2008; Buylaert et al., 2012). pIRIR methods have been particularly successful for dating well-bleached eolian deposits like loess and dunes (Buylaert et al., 2012; Yi et al., 2016; Li et al., 2017). However, K-feldspar pIRIR bleaches more slowly relative to quartz particularly at higher stimulation temperatures (e.g., 225–290°C) which may result in age overestimation for samples from depositional environments (e.g. fluvial, glaciofluvial) where signal resetting is not easily achieved (Lawson et al., 2012; Smedley et al., 2015; Colarossi et al., 2015). In fluvial settings, high-energy conditions of transport, or transport of sediment in deep water may occlude grains from receiving equal sunlight exposure resulting in age overestimation (Murray et al., 1995; Olley et al., 1998; 1999; Stokes et al., 2001; Buylaert et al., 2013). Though a number of studies have demonstrated low residual doses for fluvial and coastal samples (Godfrey-Smith et al., 1988; Stokes, 1992; Aitken and Xie, 1992), partial bleaching has been frequently observed for alluvial and lacustrine sediments (Mejdahl and Funder, 1994; Trauerstein et al., 2014; McGuire and Rhodes, 2015). A key concern using pIRIR signals from K-feldspar is accurately quantifying the size of the residual dose which has been found to exhibit large variations in part due to bleaching. For modern loess samples collected from different areas of NW China, the residual dose of quartz OSL signal from the fine-grained loess fraction is generally less than 1 Gy. In contrast, the residual doses from the pIR50IR225 and pIR50IR290 signals of K-feldspar are much higher varying between 2 and 5 Gy, and between 5 and 19 Gy, respectively (Buylaert et al., 2011). Furthermore, long-term laboratory bleaching using a SOL2 solar simulator for K-feldspar samples from the loess-paleosol sequence from NE China shows that the residual dose of pIR50IR290 signal reached a constant (or very difficult to bleach) dose of 6.2 ± 0.7 Gy after ∼300 h bleaching (Yi et al., 2016). The pIR50IR290 residual doses of modern samples from a glaciated bay at NW Svalbard ranged from 20 to 50 Gy (Alexanderson and Murray 2012; Murray et al., 2012), while the K-feldspar pIR50IR290 residual doses from fluvial sediments from different geographical locations ranged from 5 and 10 Gy (Murray et al., 2012). In addition, the residual doses of pIR50IR225, pIR50IR290 and pIR200IR290 and MET-pIRIR signals of well-bleached and poorly-bleached samples were measured by the Chen et al. (2013). Their results indicate that the poorly-bleached samples have larger residual dose than well-bleached samples and thus the residual dose values might be used to check the resetting of samples before burial (Chen et al., 2013).
Lacustrine sediments are conventionally dated using radiocarbon methods, but this is not always possible particularly in previously glaciated settings where there may be contaminated by old carbon (Dodson and Zhou, 2000; Pessenda et al., 2001; Long and Shen, 2015; Long and Zhang, 2016). In addition, the upper limit of 14C dating may be lower than theoretical values due to the low organic content in arid regions (Long and Zhang, 2016). Recently, quartz OSL dating has been successfully applied in the arid regions in China to develop chronologies of lacustrine sedimentation (Chen et al., 2008; Madsen et al., 2008; Li et al., 2015a; Long et al., 2015; Zhang et al., 2016). The tendency of the quartz OSL signal to saturate at less than 60 ka in many parts of China (Buylaert et al., 2007; Chapot et al., 2012; Li et al., 2014; Song et al., 2018) is currently a major obstruction to developing extended chronologies in a range of lacustrine contexts.
As an alternative, dating of lacustrine sediments using pIRIR methods could be facilitated by selecting profiles containing sediments which were subjected to transport conditions optimal for inducing signal resetting. Important developments to the pIRIR protocol (Buylaert et al., 2011) include stimulations at lower temperatures (i.e. the pIR50IR170) which has the advantage of accessing a more easily “bleachable” signal (Li et al., 2015b). However, a comparative study of different pIRIR signals in lacustrine contexts has yet to be undertaken.
Bosten Lake, located in the central Tian Shan, arid Central Asia (ACA), is the second-largest freshwater lake in China. In this study, different potential sources of sediments in the Bosten Lake Basin were collected to evaluate the bleachability of different pIRIR signals (e.g. pIR50IR170, pIR50IR290 and pIR200IR290). The collected samples include: (i) three samples from pluvial fans deposited along the northern margin of the lake; (ii) six samples from point bars at different locations along the Kaidu River; (iii) four eolian sand samples from dunes around Bosten Lake (Fig. 1b). The residual doses of different pIRIR signals (pIR50IR170, pIR50IR290 and pIR200IR290) were measured, and the degree to which they are bleached was evaluated. The extent of signal resetting of different catchment sediments of lake sediment and the suitability of each K-feldspar pIRIR signal as a chronometer of lake sediment deposition is discussed.
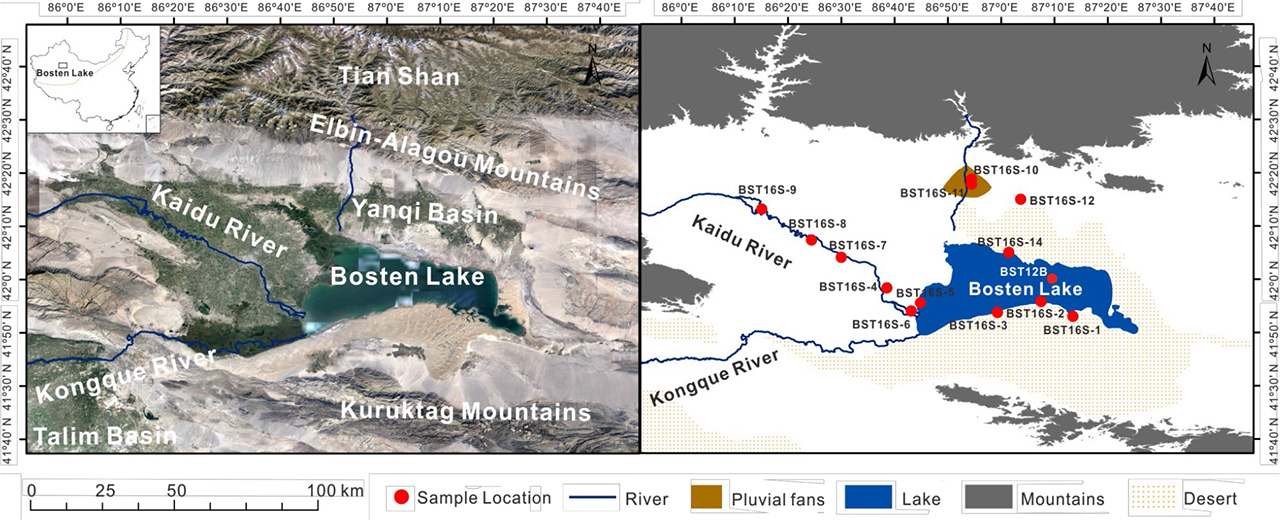
Fig. 1
a) location map indicating position of Bosten Lake located on the southeastern side of the Yanqi basin on the southern slope of the Tian Shan Mountain; b) indicates the distribution of different modern depositional environments around the Bosten Lake Basin which were sampled. Four eolian sand samples (BST16S-1, BST16S-2, BST16S-3, and BST16S-14) were collected from the widespread sand dune field around the lake. Six samples BST16S-4, BST16S-5, BST16S-6, BST16S-7, BST16S-8 and BST16S-9 were collected from the over flooding deposit at different points of Kaidu River channel. Three samples BST16S-10, BST16S-11 and BST16S-12 were collected from the surface of the pluvial fan down the Elbin-Alagou Mountains. The red cycle with BST12B besides is the location of drill core BST12B from Li et al. (2016).
. GEOGRAPHICAL SETTING
Bosten Lake (41°56′–42°14′N, 86°40′–87°26′E) is located on the southeastern side of the Yanqi basin on the southern slope of the Tian Shan, NW China, which is the second-largest inland freshwater lake in China. The Yanqi basin is 56,000 km2 (Cheng, 1993) and is flanked by the northern Tian Shan in the north and Horo-Kurnktag Mountains in the south (Fig. 1a). Bosten Lake extends 25 km from north to south and 55 km from west to east covering an area of ∼1000 km2. The average depth of the lake is 10 m, with a maximum depth of 17 m (Xiao et al., 2010). Bosten Lake is fed by 13 rivers, the largest of which is the Kaidu River, which supplies at least 85% of the total surface runoff in the whole basin (Wünnemann et al., 2006). The Konqi River flows out of Bosten Lake into the Tarim Basin (Wünnemann et al., 2006). The Yanqi Basin is climatically dominated by the Westerlies. Annual precipitation in Bosten lake basin is 68.2 mm which mainly falls in the summer. The mean annual temperature is 6.3°C (Liu et al., 2013). The annual average evaporation is about 2000 mm (Xu et al., 1996). From high to low altitude, there are five distinct zones of regional vegetation: 1) the Alpine cushion vegetation zone at 3800–3500 m a.s.l; 2) the alpine meadow zone (3500–2800 m a.s.l); 3) grassland belt (2800–2100 m); 4) desert steppe zone (2100–1600 m a.s.l), dominated by Neopallasia pestinata and Artemisia macroephala; 5) the desert zone below 1600 m a.s.l consisting of desert vegetation growing on the piedmont pluvial fans (Huang et al., 2004).
. MATERIALS AND METHODS
Sampling
The potential source materials of lake sediment from Bosten Lake mainly consist of fluvial sediments transported by the Kaidu River, and aeolian sand dunes and pluvial fans deposited around the lake. A total of thirteen modern samples were collected from different locations of the lake basin (Fig. 1b, Table 1). The locations of modern analogue samples collected from different potential sources of lake sediment at Bosten Lake Basin are shown in Fig. 2. Samples were collected from 5 cm below the surface of these deposits and were sealed in black bags to avoid light exposure and evaporation of moisture during transportation.
Fig. 2
Locations of modern analogue samples collected from different potential sources of lake sediment at Bosten Lake Basin.
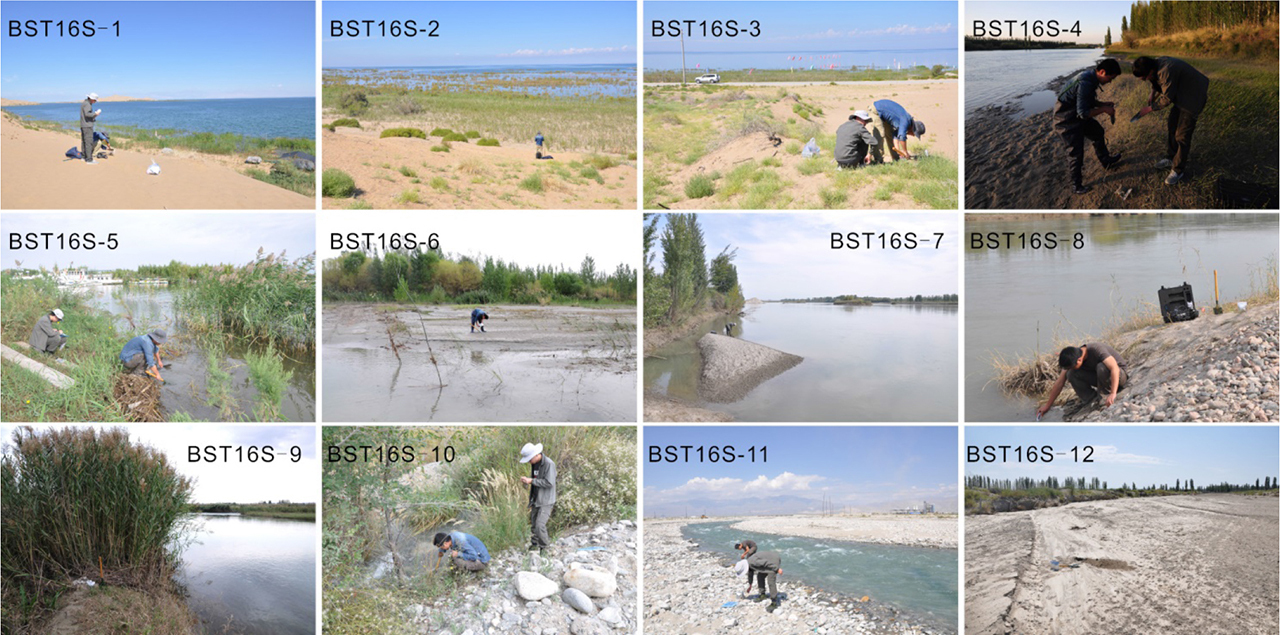
Table 1
The location and sediment type of samples from Bosten lake Basin.
Luminescence dating samples preparation and measurement
Sample pretreatments and luminescence measurements were conducted in a darkroom under subdued red light. Sample preparation followed the methods described by Aitken (1998). The preparation method comprises the following steps: firstly, soaking the samples in HCl (10%) and H2O2 (30%) for removal of CaCO3 and organic matter, respectively. Samples were then wet sieved to obtain the 90–125 μm fraction, from which K-rich feldspar was concentrated using sodium polytungstate liquid at a density of 2.58 g/cm3. The K-feldspar fraction was etched using 10% HF for 40 min to remove the outer layer irradiated by alpha particles. Finally, the samples were dissolved by using 1 mol/L HCl for 15 min to remove fluorides created during the HF etching. A total of thirteen K-feldspar samples were prepared for measurement. Etched grains were mounted on 5–6 mm aliquots using silkospray.
Luminescence signals were measured using an automated Risø TL/OSL-DA-20 reader (Bøtter-Jensen et al., 2003) equipped with blue LEDs (470 nm, ∼80 Mw/cm2) and IR LEDs (870 nm, ∼135 mWcm−2). Laboratory irradiation was conducted by using 90Sr/90Y sources mounted on the reader. The IRSL signal was observed using a PMT with the IRSL passing through Schott BG-39 and Corning 7–59 filters. Sample equivalent doses (De) and residual doses were measured using the pIRIR protocol at different elevated temperatures (pIR50IR290, pIR200IR290 and pIR50IR170 signals) (Table 2). Test dose size was set to 30% or more of sample De for sensitivity correction (Yi et al., 2016). In order to reduce the influence of temperature on the recuperation of the young samples, a 200 s stimulation using the IR LED array was conducted at 325°C at the end of each single aliquot regenerative (SAR) cycle (Jain and Ankjærgaard, 2011; Buylaert et al., 2015).
Table 2
The pIRIR dating protocol using: (i) the pIR50IR170 signal (Li et al., 2015b); (ii) the pIR50IR290 signal (Thiel et al., 2011); and (iii) the pIR200IR290 signal (Li and Li, 2012).
Dose recovery tests for the different pIRIR signals were conducted on sample BST16S-1 to check the suitability of the SAR protocol for the modern samples (Wallinga et al., 2000). For each pIRIR SAR protocol, two given doses of 22.63 Gy and 188.60 Gy were added to two groups of the sample (4 aliquots each group), respectively, and then the dose was measured as an unknown dose using the protocol shown in Table 2. Sample De was then calculated for each of the three pIRIR protocols (Table 3).
Table 3
Dose rate data based on Neutron Activation Analysis for samples from Bosten lake Basin.
In order to check the bleachability of the pIRIR signals of samples from the Bosten lake area, all K-feldspar samples (three aliquots each sample) were exposed to sunlight for 112 h (8 h per day, 2 weeks, April, 2018, Lanzhou, China), and then the residual doses were measured using the three pIRIR dating protocols (Table 2).
The dose rate of all samples was obtained by measuring the radioactive element concentrations of uranium (U) and thorium (Th) and potassium (K) content using Neutron Activation Analysis. For each sample, ∼5 g of each sample was ground to < 4 μm using an agate mortar. All results were converted to beta and gamma dose rates according to the conversion factors of Guérin et al. (2011). As listed in Table 3, the measured water content (% by dry weight) of eolian sand samples from Bosten Lake (BST16S-1, BST16S-2, BST16S-3 and BST16S-14) ranges from 0.03% to 0.3%. The observed water content of fluvial samples collected from Bosten lake (BST16S-4, BST16S-7, BST16S-8 and BST16S-9) range from 1% to 9%, except samples BST16S-5, BST16S-6 (25 and 32% water content) which were collected from subaqueous contexts (river delta and river channel, respectively). The observed water content of samples collected from pluvial fans from Bosten Lake (BST16S-10, BST16S-11 and BST16S-12) ranges from 0.2% to 2%. As a result, the life average water content of 1 ± 0.5%, 6 ± 3% and 1 ± 0.5% are used for eolian sand, fluvial and pluvial samples, respectively given the uncertainty of samples after deposition. The cosmic dose rate was calculated according to the altitudes of sample location and burial depth (Prescott and Hutton, 1994). The internal dose rate of K-feldspar grains was calculated assuming a K content of 12.5 ± 0.5% (Huntley and Baril, 1997) and Rb content of 400 ± 100 ppm (Huntley and Hancock, 2001; Zhao and Li, 2005).
. RESULTS AND DISCUSSION
Luminescence characteristics of K-feldspar pIRIR signals of samples from Bosten Lake Basin
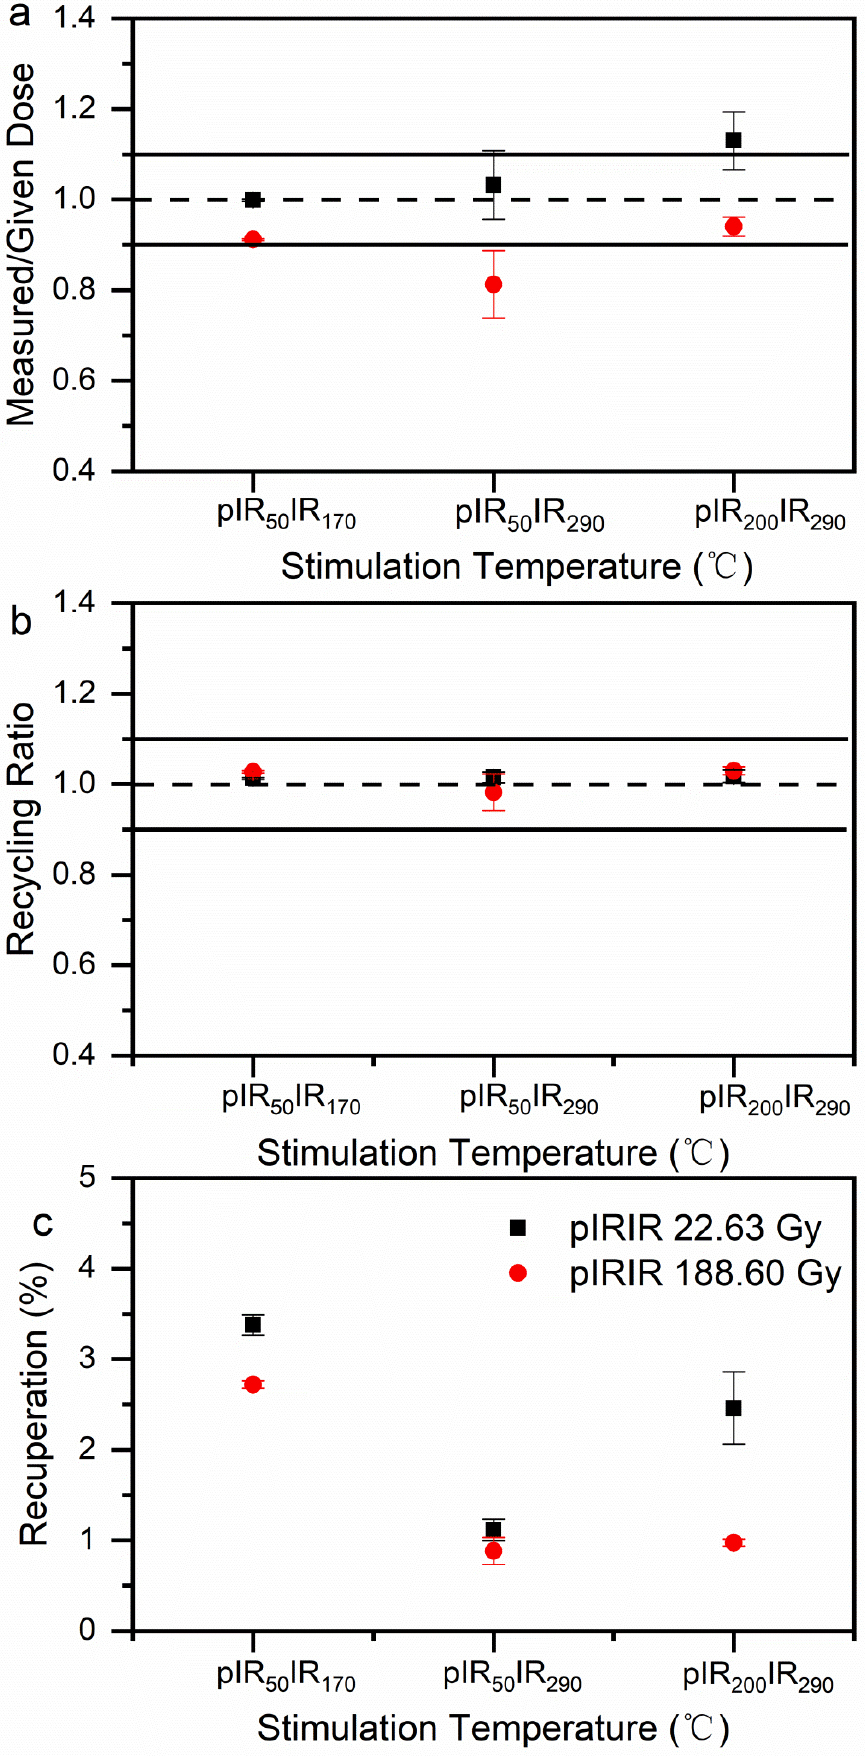
The dose recovery test results of sample BST16S-1 for pIR50IR170, pIR50IR290 and pIR200IR290 signals are illustrated in Fig. 3. The calculated measured/given (M/G here in) dose ratio all lie within 10% of unity except for pIR50IR290 signal for the large given dose of 188.60 Gy. The recycling ratio of all measurement for pIRIR signals fall in 0.98–1.02 and the recuperation of the natural signal for all aliquots is less than ∼4%. These data indicate that the pIRIR dating protocols using pIR50IR170, pIR50IR290 and pIR200IR290 signals can be used to measure the De of these samples from Bosten Lake Basin.
Fig. 3
a) b) c) show the dose recovery test results from sample BST16S-1. a is the measured dose/given (M/G) dose; b) and c) show the recycling ratios and recuperation values.
The growth curve and decay curves of pIR50IR170, pIR50IR290, and pIR200IR290 signals for a K-feldspar sample (BST16S-5) are illustrated in Fig. 4. The natural pIR50IR170, pIR50IR290, and pIR200IR290 signals of the sample are bright enough for De determination. The growth curves for the pIR 50IR170, pIR50IR290 and pIR200IR290 signals of all samples were fitted using a single exponential function.
Fig. 4
Luminescence characteristics of K-feldspar pIRIR signal for samples: a), b) and c) show representative decay and growth curves from the pIR50IR170, IR50, pIR50IR290, IR50 and pIR200IR290, IR200 signals for K-feldspar sample BST16S-5. d), e) and f) show the recycling ratios and recuperation values of all aliquots for the pIR50IR170, pIR50IR290 and pIR200IR290 De measurements for all samples, respectively.
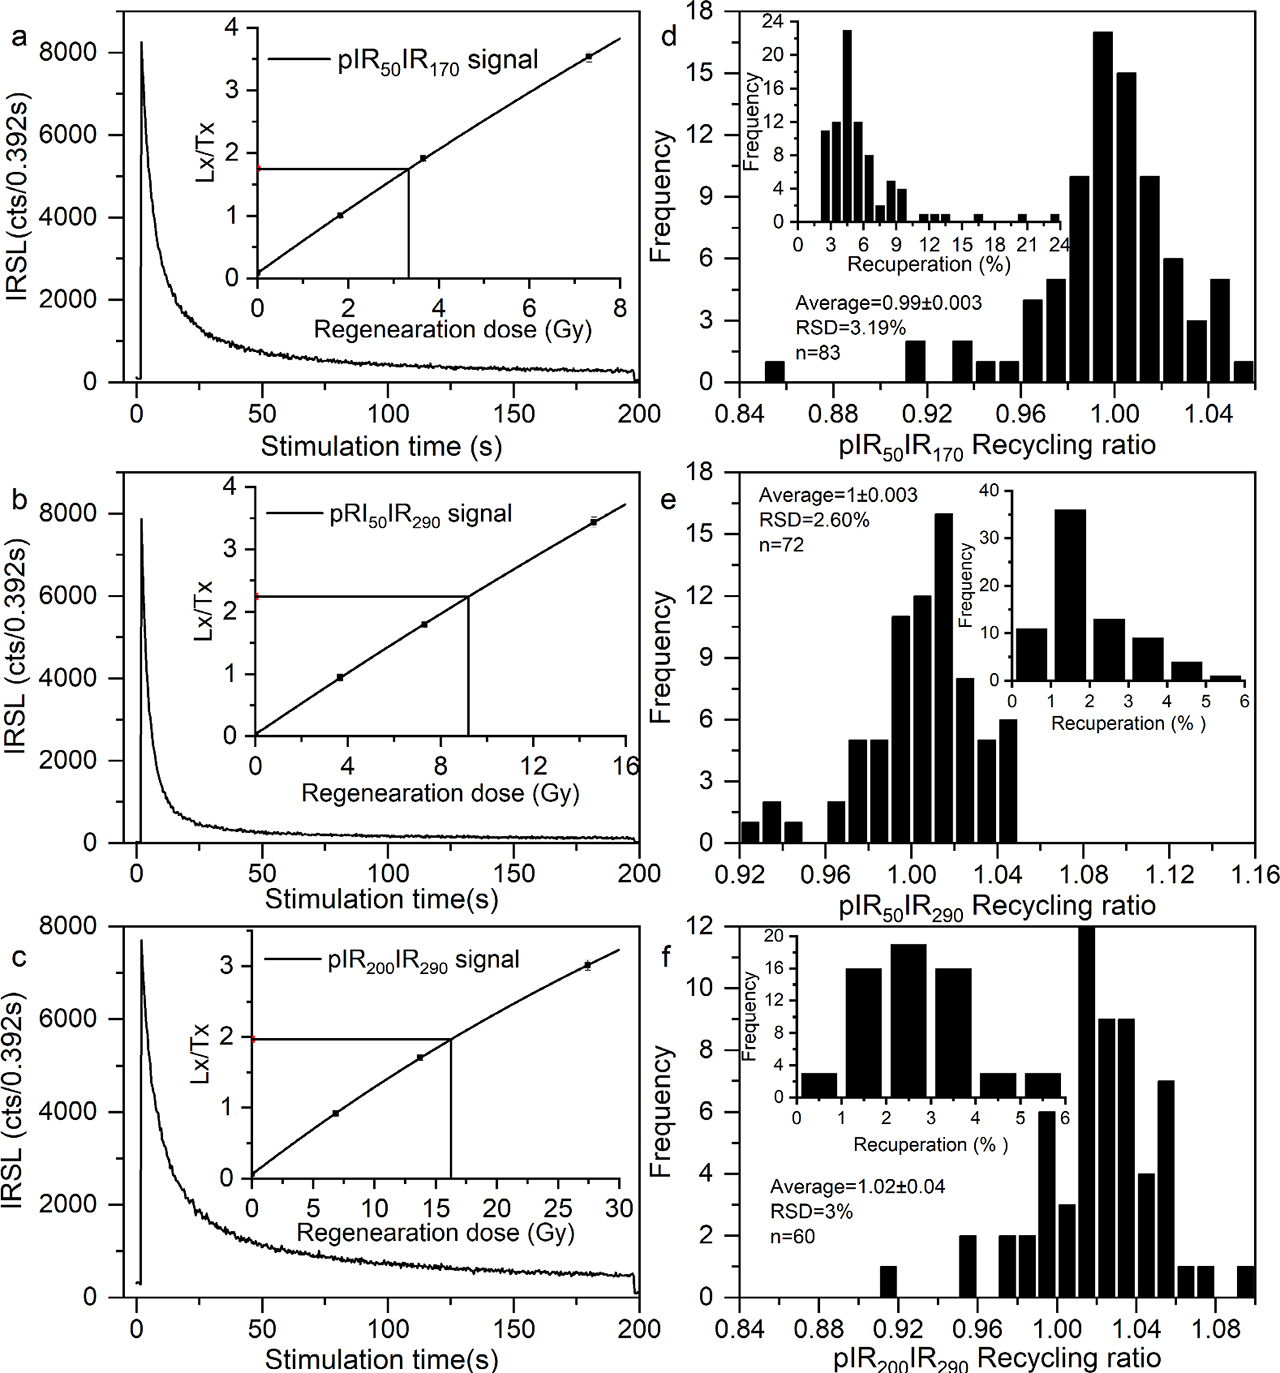
For the pIR50IR170 De measurements, the average recycling ratio for all 83 aliquots of the 13 K-feldspar samples is 0.99 ±0.003. The recuperation of the signals for almost all aliquots (77) is less than 10%, except for six aliquots (Fig. 4d). For the pIR50IR290 and pIR200IR290 De measurement, the average recycling ratio of the 13 K-feldspar samples is within 10% of unity. The recuperation of the natural signals for more than 95% aliquots is less than 5% (Fig. 4e and 4f). Together these results indicate the pIRIR De measurements are acceptable. The average value of 4–14 aliquots’ De was used to calculate the pIRIR De for each K-feldspar sample. The calculated K-feldspar IR and pIRIR Des, and ages for all samples are listed in Table 4.
Table 4
Summary of K-feldspar pIRIR age data for samples from Bosten lake Basin.
The pIRIR residual doses from different source materials
K-feldspar pIRIR residual Des for samples from different sources exhibit large differences (Fig. 5). For all samples, the measured De values show a well-ordered increase with stimulation temperature irrespective of source, which shows that the bleach rates of the lower temperature pIRIR signal is quicker. However, largest residual doses were observed from the pluvial fan samples (19–197 Gy), followed by Kaidu River alluvium (3–40 Gy) and the sand dunes (0.4–13 Gy). Smedley et al. (2015) demonstrated that the bleaching rate of pIRIR signal was higher at lower pIRIR stimulation temperature by comparison of pIRIR225 and pIRIR290 ages of a naturally-bleached dune sand from Argentina using single-grain measurements of the pIRIR225 and pIRIR290 signals.
Fig. 5
The distribution of De (a) and age (b) values obtained using different pIRIR signals (pIR50IR170 De, pIR50IR290 De and pIR200IR290).
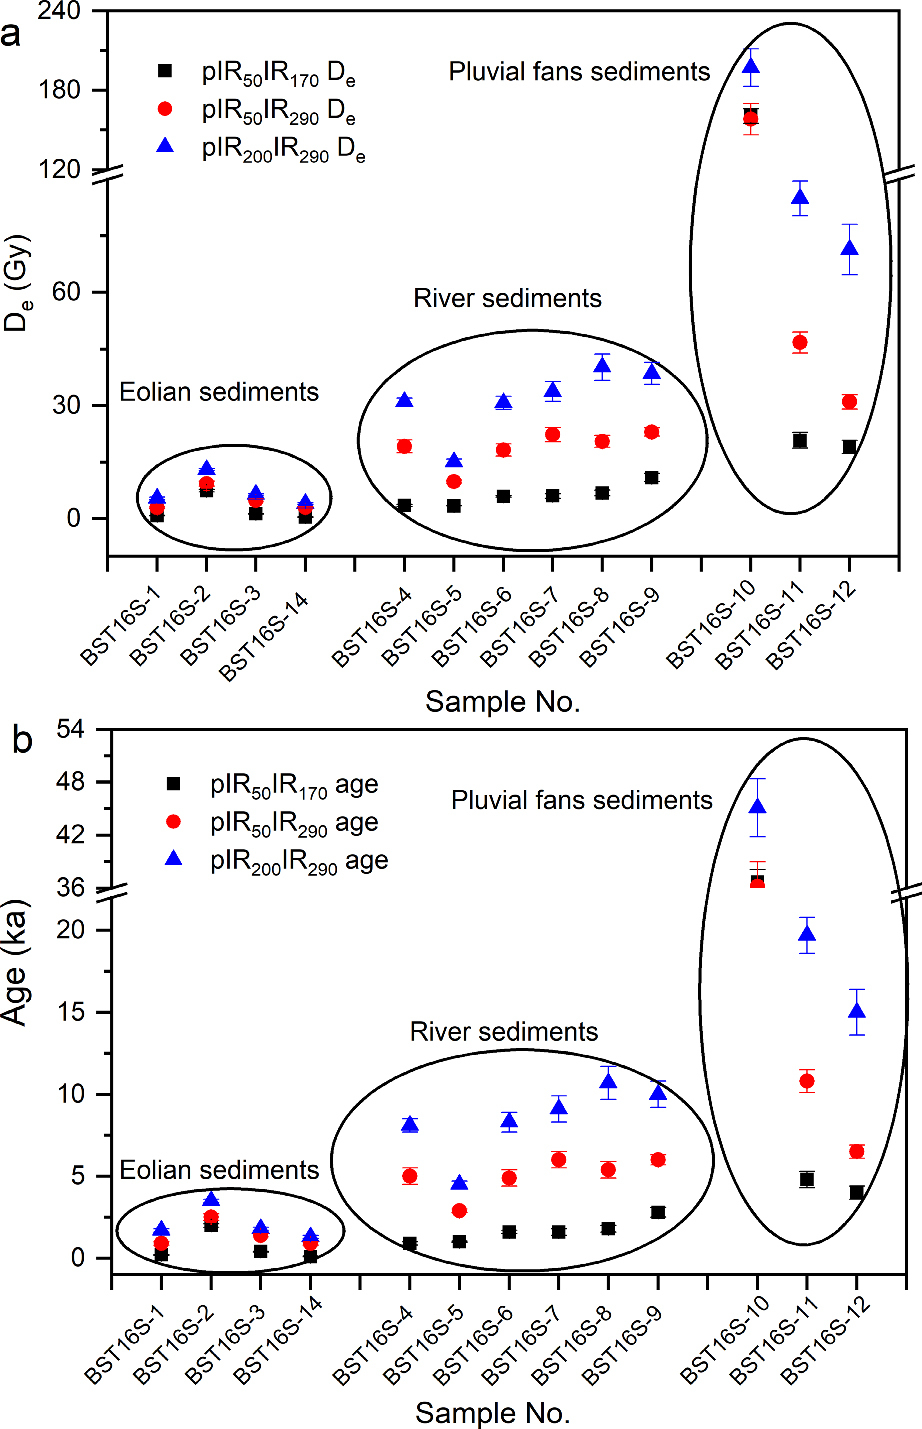
The average pIR50IR170, pIR50IR290 and pIR200IR290 ages for eolian sand samples are ∼ 0.7 ka, 1.5 ka and 2.5 ka, respectively (Fig. 6a). The residual dose from the pIR50IR170 signal is negligible as a proportion of age for Holocene samples. The pIR50IR290 and pIR200IR290 signals produce residual doses small enough to justify their application to Pleistocene samples. Thus the coarse-grained K-feldspar transported from dunes around the lake is resetting well and can be used for lake sediment age determination. The average pIR50IR170, pIR50IR290 and pIR200IR290 ages of the fluvial samples are ∼1.6 ka, 5.1 ka and 8.4 ka, respectively (Fig. 6b). The residual ages of both eolian and fluvial samples exhibit a decreasing trend with proximity to the lake.
Fig. 6
a) and b) pIRIR ages from eolian and river sediments plotted as a function of distance from sampling sites from Bosten Lake, respectively.
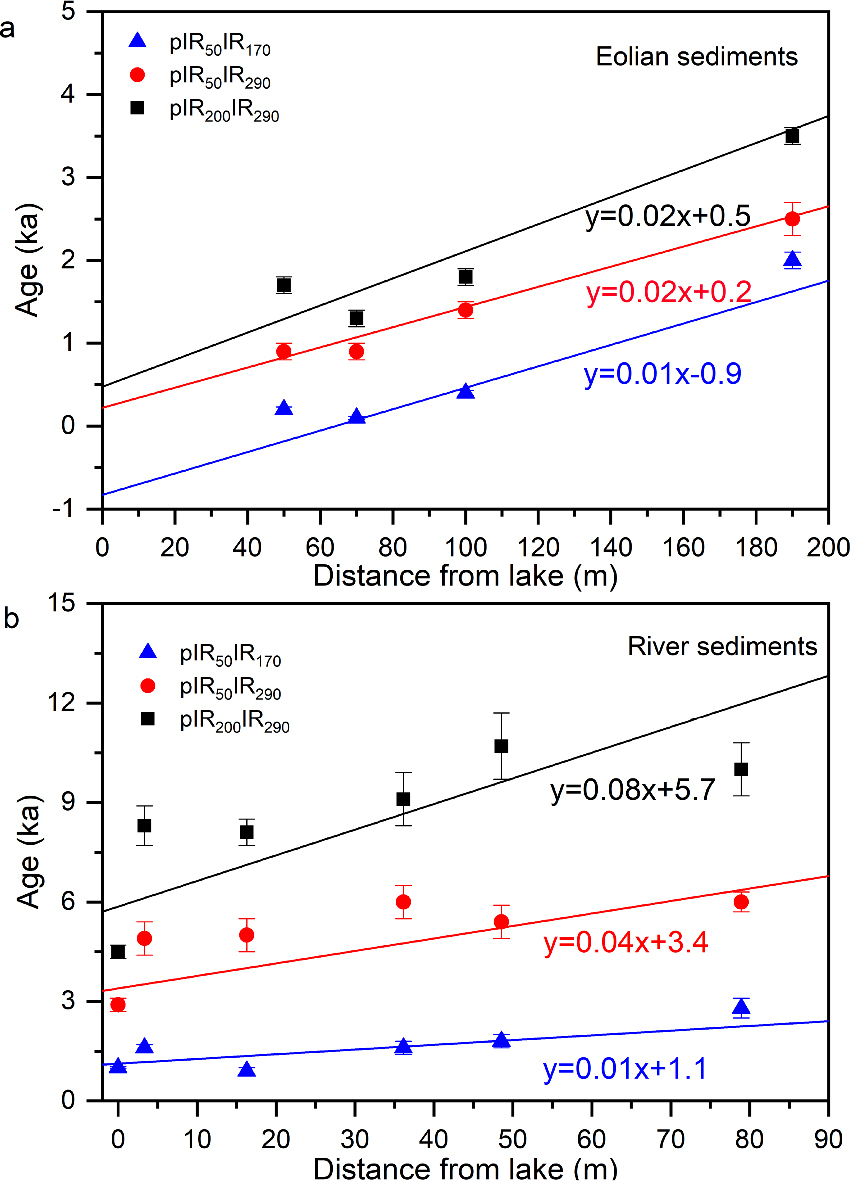
Notably, the pIRIR residual ages of the fluvial samples decrease with proximity to the lake (from 4–1 ka) indicating improved bleaching with transport distance (Murray et al., 1995; Stokes et al., 2001; McGuire and Rhodes, 2015). The smallest age of pIRIR170 signal for fluvial samples is ∼1 ka, which is acceptably low for dating mid- or early Holocene samples. The ages obtained from the pIR50IR290 and pIR200IR290 signals for fluvial sample are 3 ka and 4 ka, respectively, which indicates they may still be suitable for dating Pleistocene samples.
The hard-to-bleach pIRIR residual dose for samples from different sources in Bosten Lake
The residual doses of pIR50IR170, pIR50IR290 and pIR200IR290 for all samples after 112 h sunlight bleaching during April in Lanzhou, China, are listed in Table 5 and illustrated in Fig. 7. The residual doses generally increase with increasing sample age, which is consistent with samples from loess-paleosol sequences in the Tian Shan (Li et al., 2015b). The hard-to-bleach dose component of the residual dose exhibits an increasing trend with stimulation temperature for the same sample.
Fig. 7
Plots of the residual doses of eolian samples (a), fluvial samples (b) and pluvial samples (c) obtained using different pIRIR signals after 112 h sunlight bleaching as a function of the associated De values.
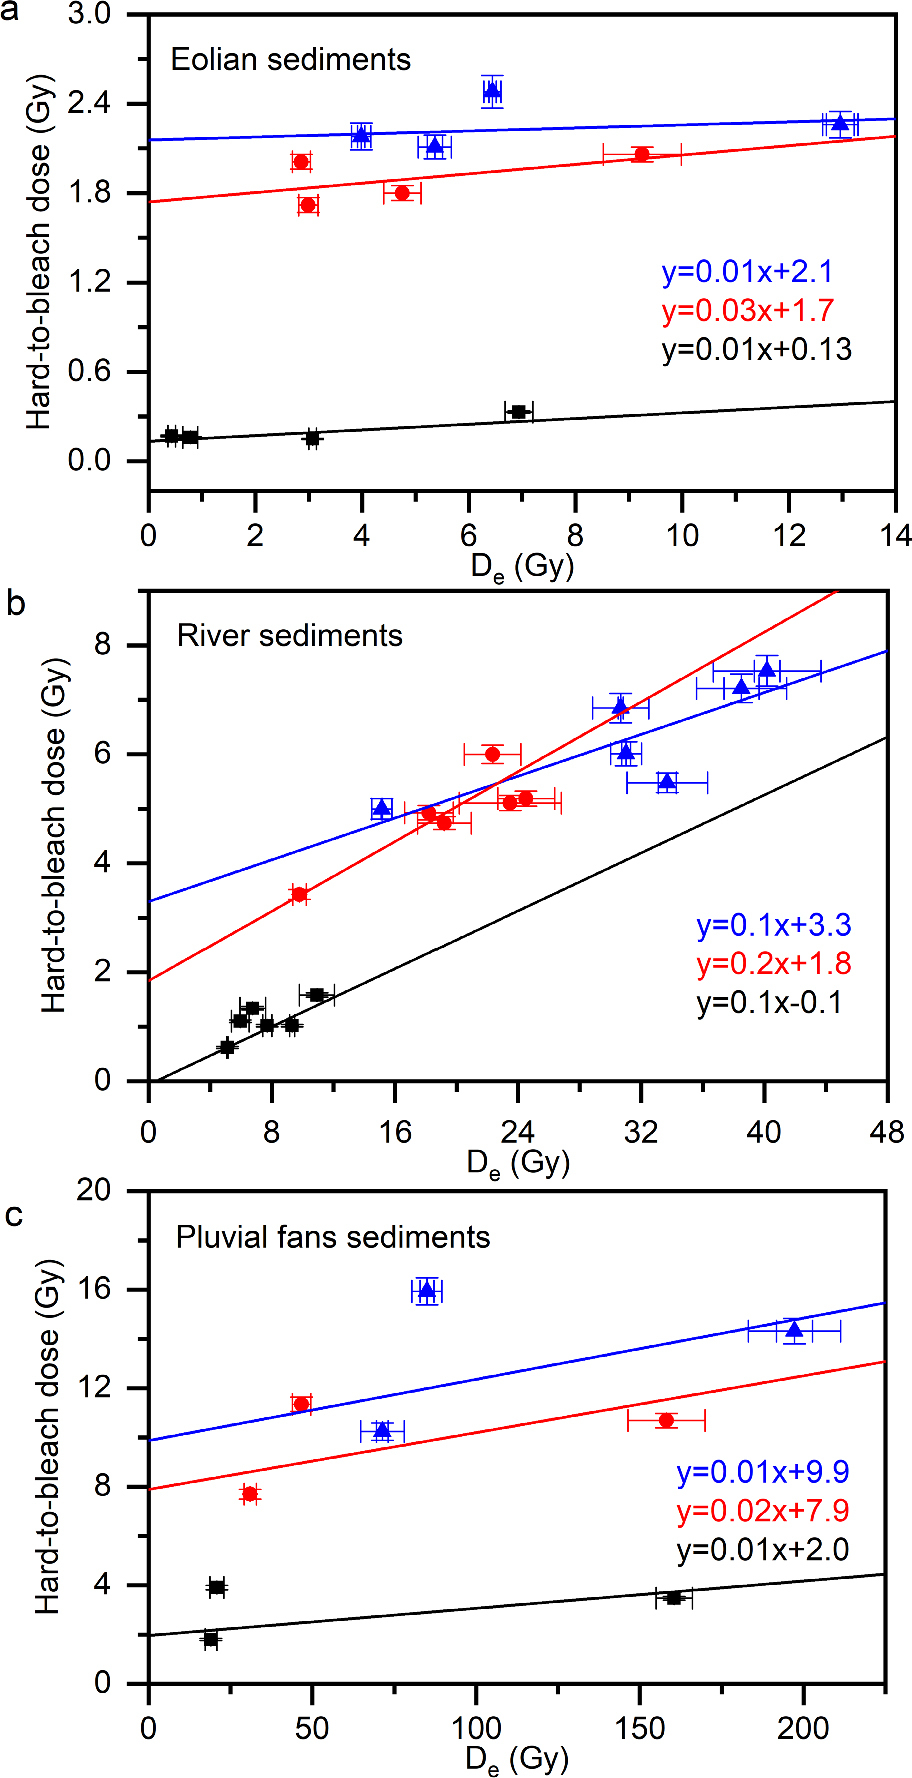
Table 5
Summary of the residual dose after 112 h bleaching under sunlight for all samples from Bosten lake Basin.
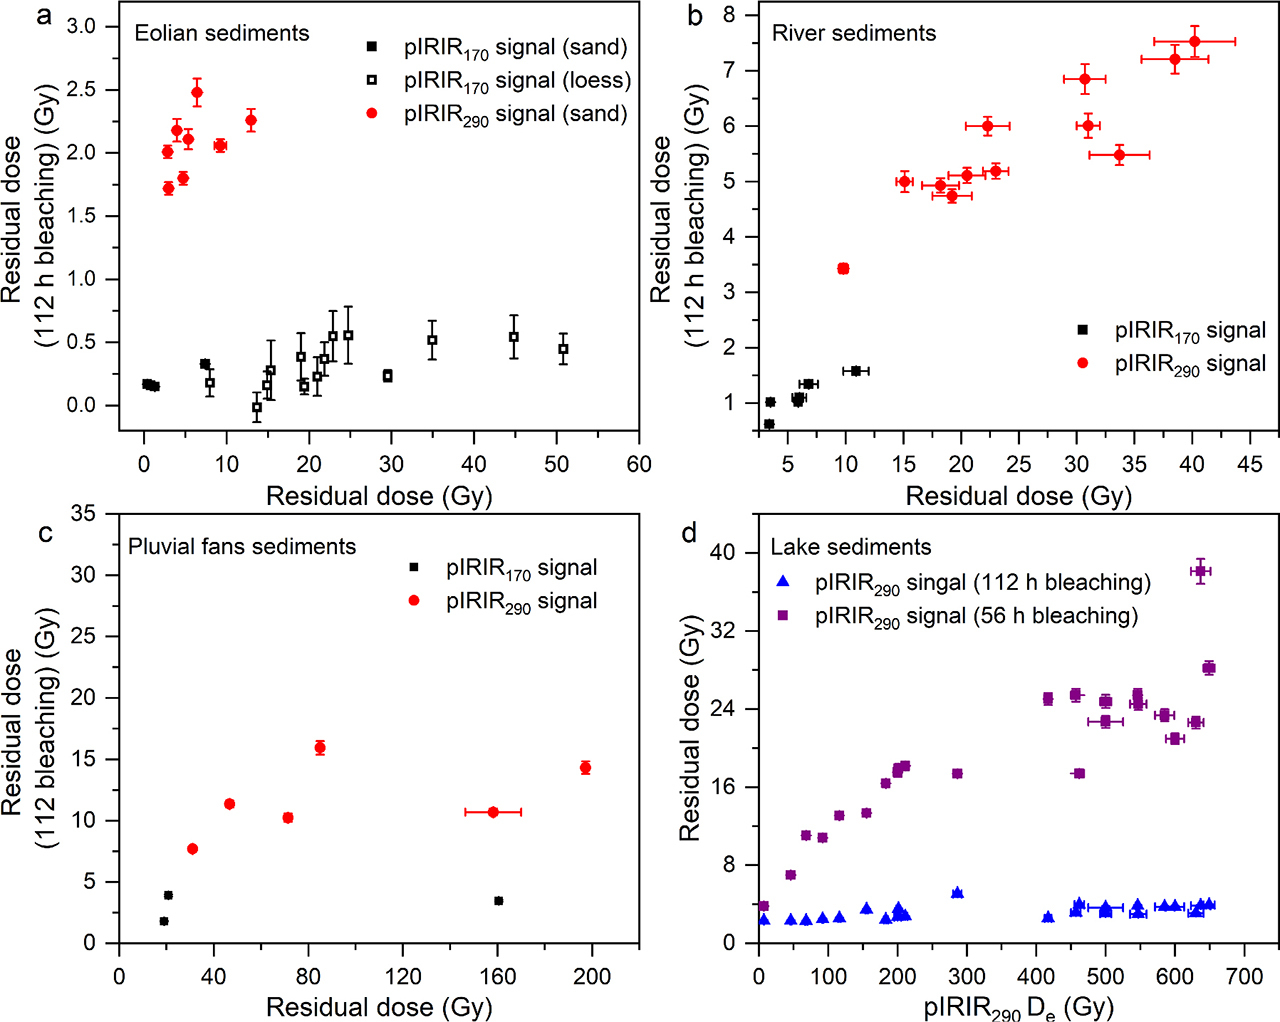
For eolian samples from dunes around the lake, the hard-to-bleach dose of the pIR50IR170 signal ranged from ∼0.15 Gy to ∼0.33 Gy (∼0.03 to ∼0.09 ka), which is similar to previously reported hard-to-bleach dose values (< 0.5 Gy) from loess deposited in the Tian Shan (Li et al., 2015b) (Fig. 8a). The hard-to-bleach dose of pIR50IR290 and pIR200IR290 signals for eolian sand samples increased to ∼ 2 Gy (∼0.6 ka). For the fluvial samples, the hard-to-bleach dose of pIR50IR170, pIR50IR290 and pIR200IR290 ranges from 0.6–7.5 Gy (Fig. 8b). For the pluvial fan samples, the hard-to-bleach dose of pIR50IR170, pIR50IR290 and pIR200IR290 ranges from 1.8–15.9 Gy (Fig. 8c). These results indicate that the hard-to-bleach dose of pIRIR signal is closely related to the types of source materials. The K-feldspar samples from eolian dunes and fluvial deposit are bleachable and can be reset to a background of 0–0.5 ka using the pIRIR170 signal and 1–2 ka using the pIRIR290 signal. However, the pluvial fan deposits exhibit anomalously high hard-to-bleach dose values (up to ∼18 Gy) when the pIRIR290 signal was measured, but this was only ∼3 Gy for the pIRIR170. These residual dose values cannot be dismissed for the Pleistocene sample when using pIRIR290 signal, nor the Holocene samples when using pIRIR170 signal. The ages of pIRIR signals of pluvial fan samples vary from 4.0–45.1 ka, which indicates poor bleaching. The hard-to-bleach dose of pIRIR290 signal for coarse-grained K-feldspar from a 51.2 m deep lake core from Boston Lake were measured after 112 h sunlight bleaching (Li et al., 2017). As illustrated in Fig. 8d, the hard-to-bleach doses from the pIRIR290 signal of the lake sediment range from 2 to 6 Gy, which is much smaller than the pluvial fan deposits (20–50 Gy), is slightly smaller than those obtained (3.8 Gy) from the fluvial deposits but overlaps the values obtained from the eolian dune samples (1.5–2.5 Gy) (Fig. 8a). These results show that the K-feldspar within the lake sediments was mainly sourced from fluvial and eolian deposits, and the pluvial fans contributed very little sediment. It may not be advisable to apply pIRIR dating utilising different pIRIR signals to Holocene lacustrine samples when the source materials are mainly from pluvial deposits due to their high hard-to-bleach dose. However, the residuals associated with the eolian and fluvial deposit are small enough to warrant dismissal (e.g., Using K-feldspar pIR50IR170 signal to date Holocene sample and using pIR200IR290 and pIR50IR290 signals to date Pleistocene samples). When dating water-lain samples, it is advisable to collect samples from areas that exclude inputs from poorly-bleached pluvial fan sediments.
Fig. 8
a), b), c) and d) show the hard-to-bleach dose values for eolian, fluvial, and pluvial and lacustrine samples, respectively. pIR50IR170 residual dose of loess (red cycles) in a) and pIR50IR290 residual dose of lacustrine samples (square and triangle) in d) are cited from Li et al. (2015b) and Li et al. (2016), respectively.
The possibility of distinguishing fluvial and eolian source materials for age determination based on the depositional process of lake sediment is helpful for discussion of the reliability of the chronology. A key advantage of using a low stimulation temperature for pIRIR dating can substantially reduce significant contributions of a residual dose (Kars et al., 2014).
. CONCLUSION
A series of potential sediment source materials (sand dunes, river sediments and pluvial fan sediments) around Bosten Lake, arid central Asia were sampled to investigate the extent to which different pIRIR signals (pIR50IR170, pIR50IR290 and pIR200IR290) had been bleached. There is a significant difference in both the residual and hard-to-bleach doses from the different types of sources materials. When the sampling site is closer to the lake, its pIRIR residual dose is lower. Until the sampling point is located under the lake, the residual ages up to 4.5 ka can be considered well-bleached; but in contrast, the pluvial fan sediment is very poor-bleached. The residual doses of both fluvial and eolian samples were shown to be sensitive to pIRIR stimulation temperature. The evidence in this paper indicates that the pIR50IR170 signal is the most suitable for dating Holocene samples, but the pIR200IR290 or pIR50IR290 signals can be used to date older Pleistocene material at sections containing reworked fluvial or eolian material can be demonstrated. Efforts to date the sediments of Bosten Lake using pIRIR methods should take care to exclude sections likely to have been influenced by significant inputs of poorly bleached pluvial fan material. This study provides an important methodological basis for testing the suitability of pIRIR dating in lacustrine environments and would be an important step forward in constraining the chronology of lacustrine sedimentation, particularly in areas where radiocarbon dating methods are unsuitable.